Fun and learning with set actions to do multilevel drill down and drill up in tableau: Using the…
It has been a while since I tried and learnt something new on the tableau side of things, so I decided to try this out as I prepare to…
Fun and learning with set actions to do multilevel drill down and drill up in tableau: Using the Pune facilities dataset
It has been a while since I tried and learnt something new on the tableau side of things, so I decided to try this out as I prepare to teach the subject again from the next week.
This time, I started by collating data about the types of facilities and buildings in Pune and combining them.
For a start, I took some data of government and private hospitals, schools, gardens, libraries, and combined them with data on other facilities ward wise in Pune.
I have tried collecting data from the PMC website as well as the Open City portal for this so far, I will check out other sources as well.
I believe that we can unlock a lot of insights by combining various datasets and then ask the right questions.
For a start, I picked up government health facilities (PMC hospitals + clinics + dispensaries) vs private facilities (again hospitals + clinics) for analysis, and I show what I found below.
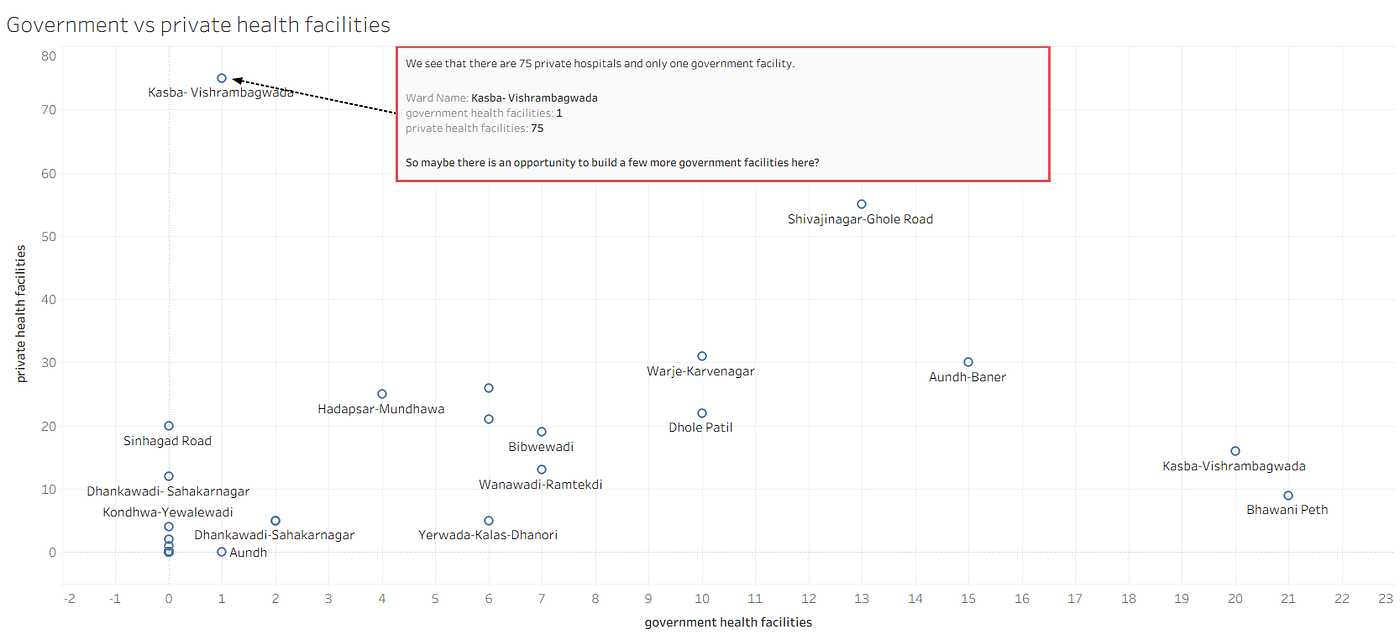
Some areas as shown here have very few government facilities and far more private ones, while others have a good mix.
We see areas such as Kasba-Vishrambagwada, which has 90 private hospitals and just 30 government facilities, while other places such as Bhawani Peth have 21 government facilities vs 9 private ones.
So maybe planners should go drill deeper into their data to see if there is an opportunity to put more government facilities in the Kasba-Vishrambagwada area?
What I also started to do is to use set actions to drill down and display the number of facilities of each type in each ward, and then drill further and display the location of each facility.
This is something nice that I learned today, that I can now execute multi level drill downs (or even drill down by multiple dimensions in the same sheet at the same level at the same time) using set actions.
I found the post at this link particularly useful, and I tried to use it to good effect.
I put the steps below.
- First, I want to drill down and show the types of facilities and their count under each ward.
For this, I used a regular set action (I created a set on ward name) and calculated field as shown below.
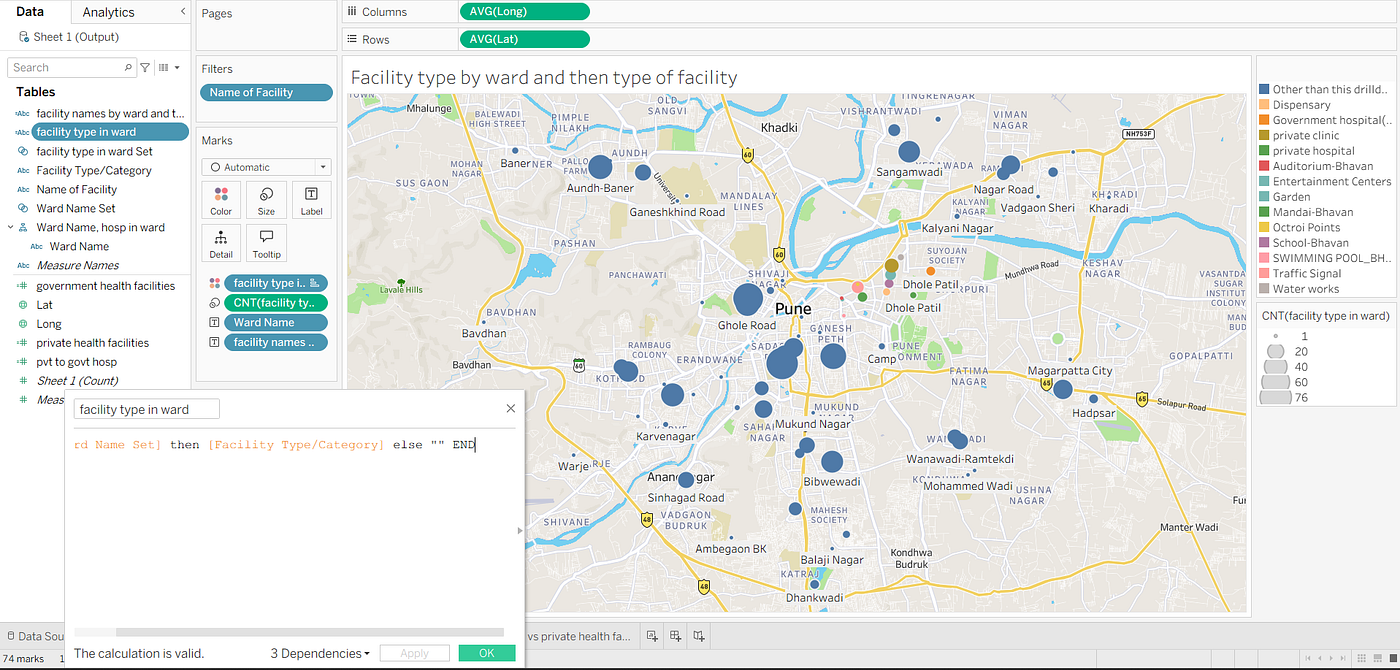
Calculated field for the drill down using a set action

Use of the first set action.
Now for the second level drill down, I used the calculated field we created in the first step to make the new set-this is the key to drill down at the second level.
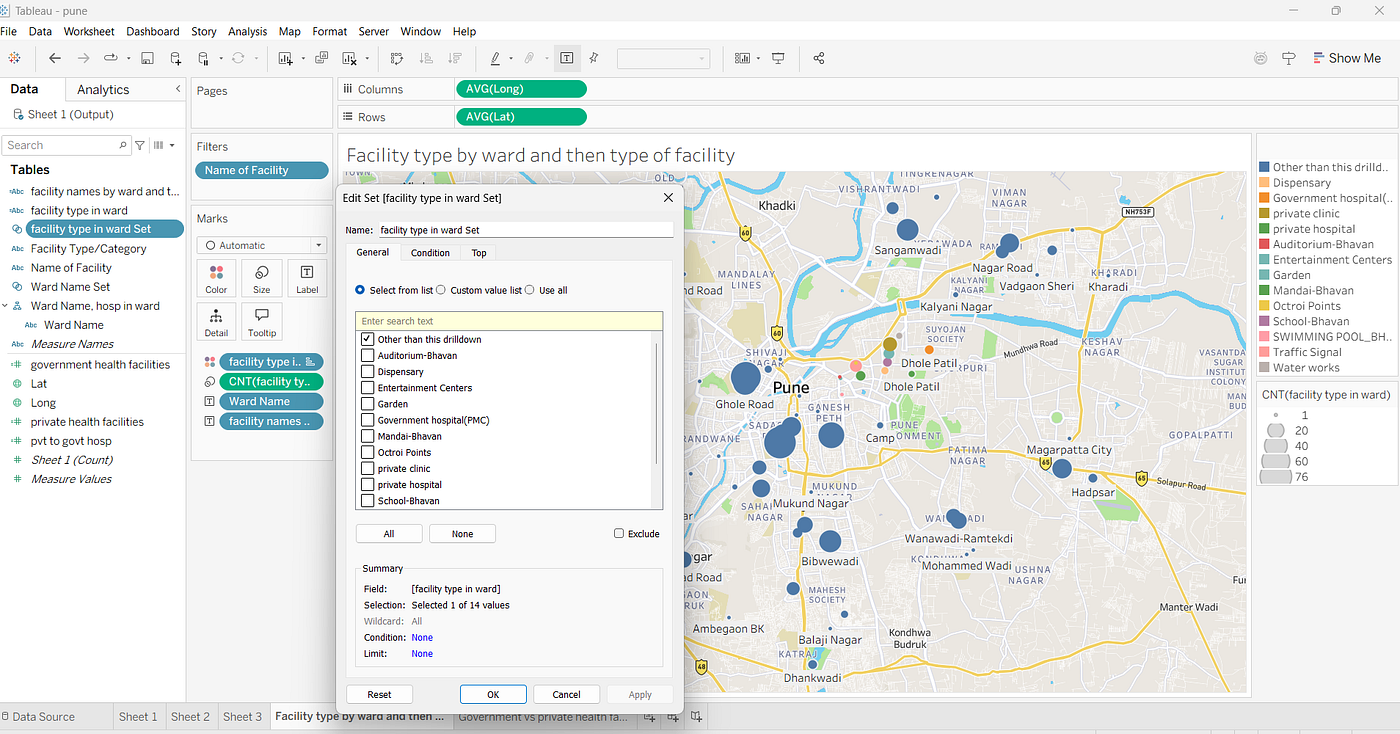
Using the output of the first calculated field as a set for the next drill down
Then in the next calculated field we use the first and the second set both.
In the second set action, we use the set we created from the first calculated field above.
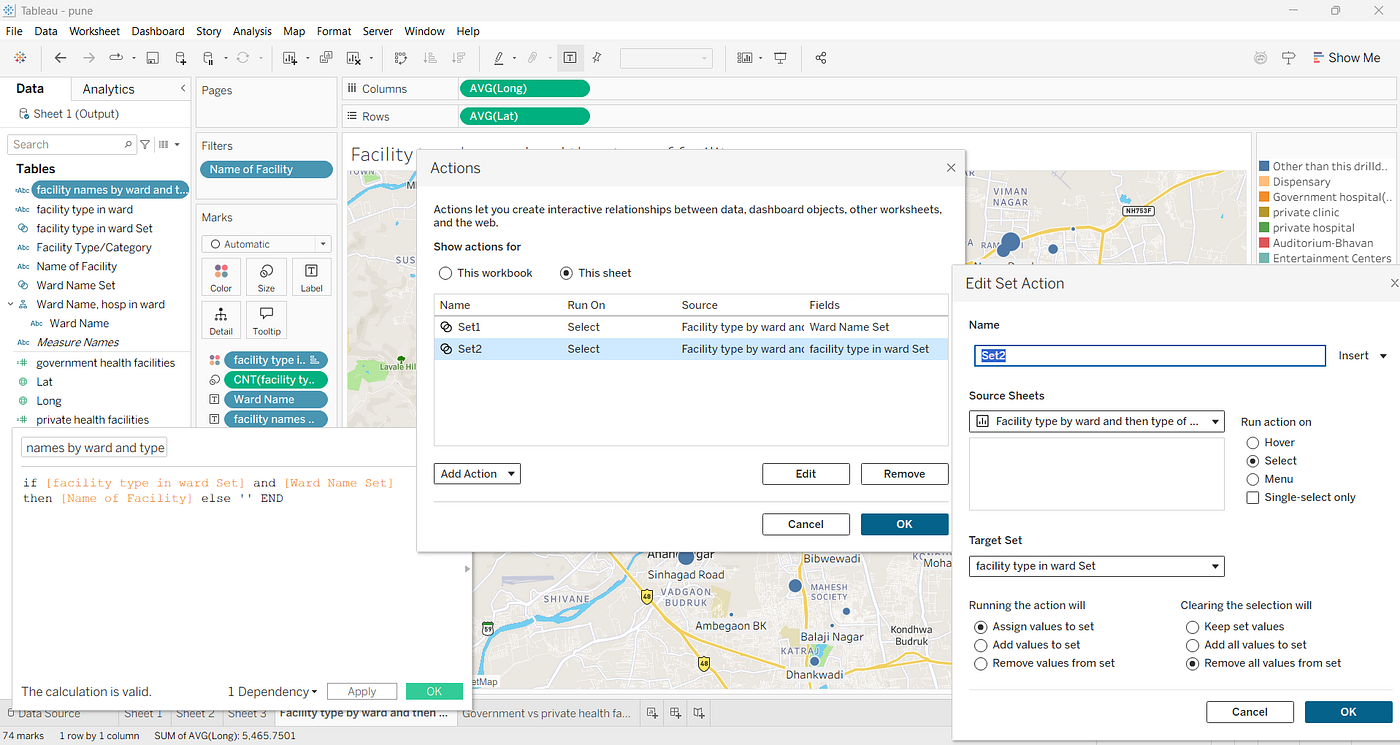
In the second calculated field we need to use the “and” clause to combine both the fields from the first and second sets.
Now we just drag these calculated fields into the marks card, and we are ready.
It works as shown in the steps below.
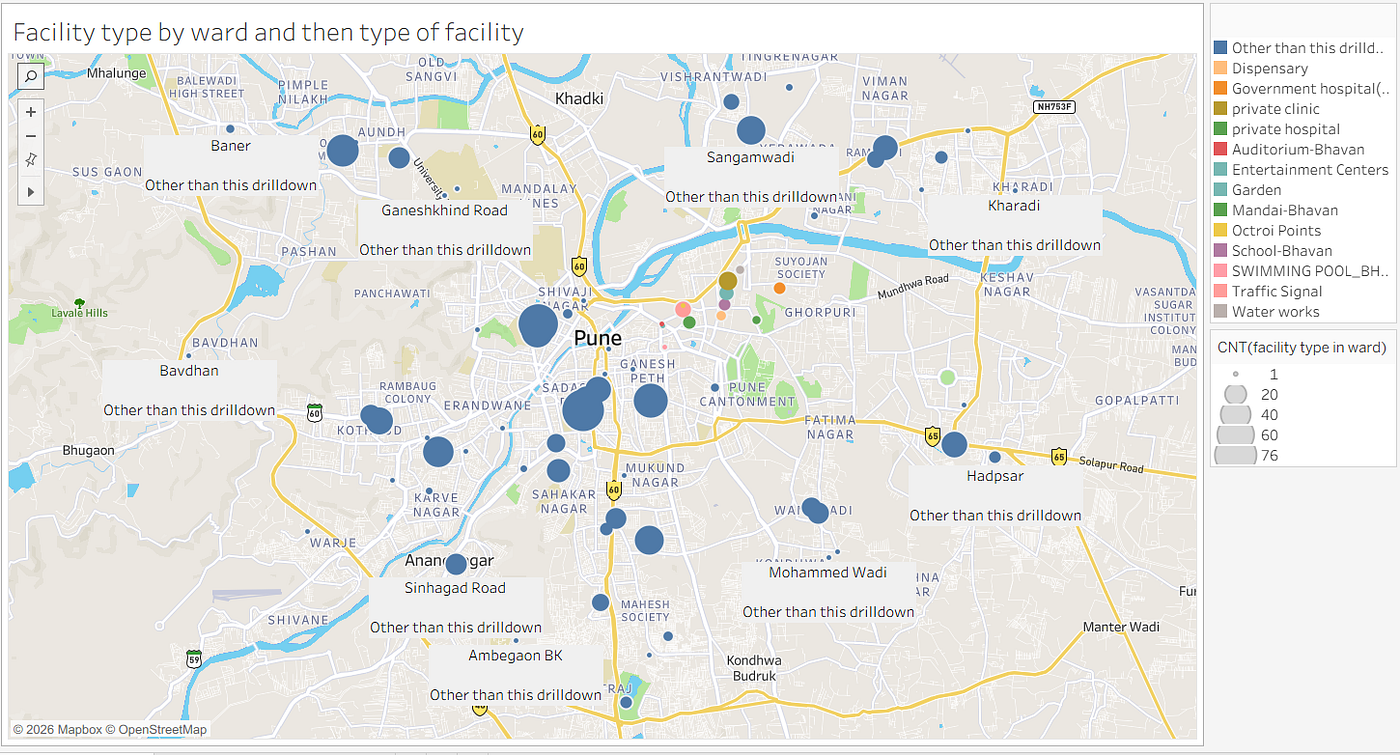
Drill down at the first level: The colours other thsn the blue are the items at the sub level
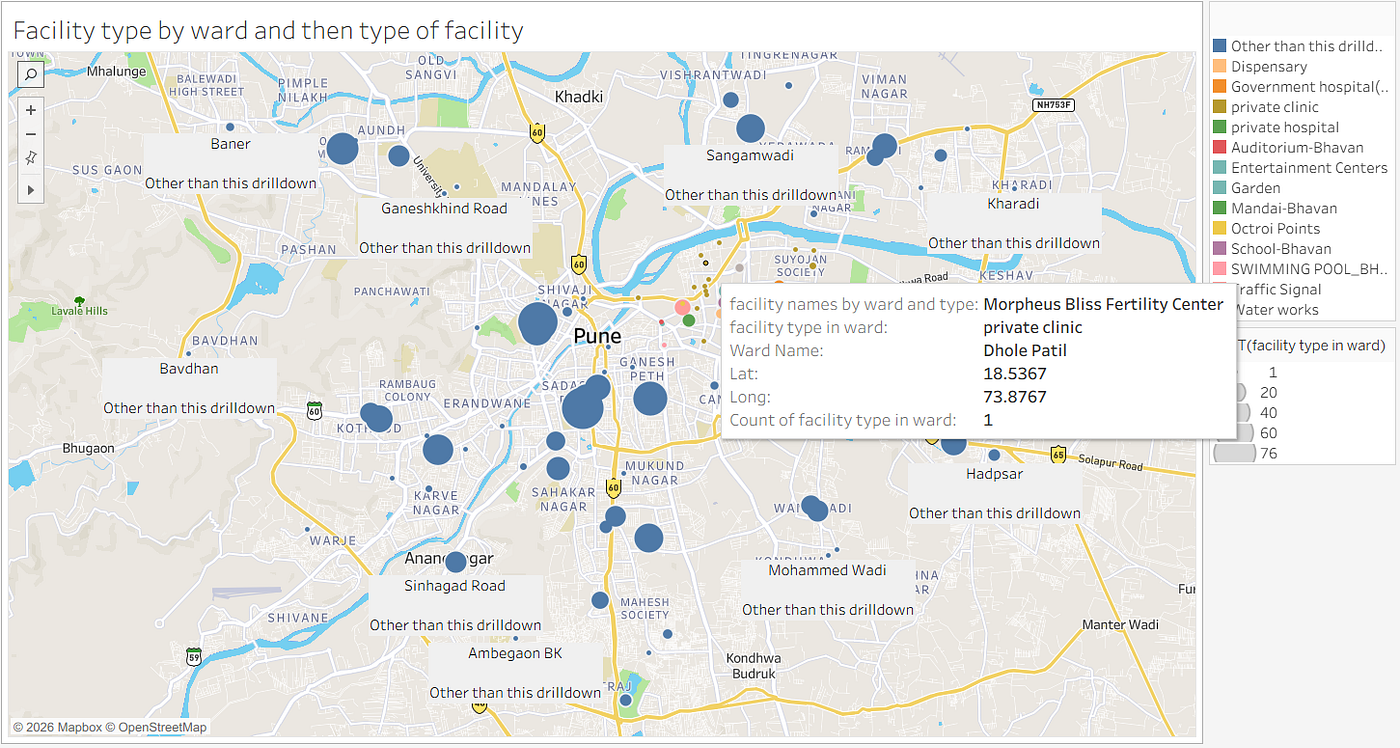
Drill down at the second level when we click on private clinics (The tooltip for one of them is shown below).
So this was my learning for today which I wanted to share.
What I hope to do is combine the data for more facilities (such as metro stations, bus stops, or public toilets, etc.,) together and display them on the map like this.
Then we can query and ask nice questions like which schools, hospitals, or libraries lack access to say a metro or bus stop, for example, and then use that to recommend where to build the next facilities to serve the public better.
I will work on it and analyze it and post again soon, meanwhile I hope you enjoyed reading this one.
This post is more about sharing my learning on how to visualize than about the analysis per se, I will maybe do that next time and share insights and recommendations.
Please do share any feedback for my learning and improvement, I will be happy to implement.
Till I post again then, keep reading!!
메타데이터
- post_id
- 43066857e69d
- slug
- fun-and-learning-with-set-actions-to-do-multilevel-drill-down-and-drill-up-in-tableau-using-the-43066857e69d
- url
- https://medium.com/@srmp1382/fun-and-learning-with-set-actions-to-do-multilevel-drill-down-and-drill-up-in-tableau-using-the-43066857e69d
- canonical_url
- https://medium.com/@srmp1382/fun-and-learning-with-set-actions-to-do-multilevel-drill-down-and-drill-up-in-tableau-using-the-43066857e69d
- author_url
- https://medium.com/@srmp1382
- status
- ok
- fetched_at
- 2026-07-30 03:08:15



