Reproducing Research Papers and Surviving ChIP-Seq
You’ll figure out which types of graphs are best for different datasets (because not all data should be squeezed into a bar graph). 📊
Things I learned while reproducing figures from a published research paper
This time, I’m diving into some pretty technical territory that is closely related to my field, so definitely there are a lot of terms/ideas you may not be familiar with. But don’t worry — I promise to break things down into simple words. I’ve got a habit of making even the most jargon-filled topics relatable (or at least, I try to ! 😉).
For the past month, I have been on a mission to reproduce figures from a published research paper by following a *tutorial by the brilliant Dr. Ming “Tommy” Tang.* A study titled “Genome-wide association between YAP/TAZ/TEAD and AP-1 at enhancers drives oncogenic growth”, conducted by Zanconato et al. in Italy back in 2015, unravels how different protein groups team up to control gene activity in cancer cells. Sounds intense, right? 😬
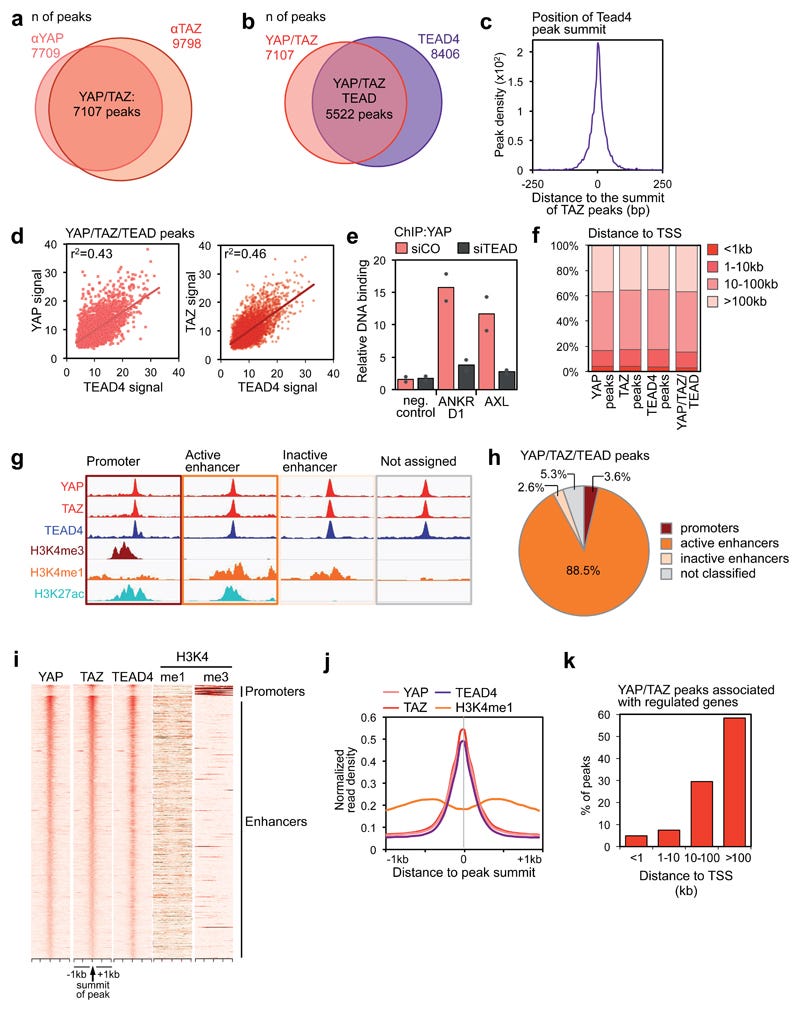
These are the figures from the research paper and at the end I have kept the figures I prepared.
I promise, though there might be a few moments where the technical terms get a bit overwhelming, I’ve sprinkled in real-life parallels to keep things interesting. Stick with me, and by the end of this blog, you’ll not only have a clearer picture of the science behind these figures but also a smile on your face.
**Here are the key players:
- YAP/TAZ: Proteins that are important for regulating organ size and are linked to cancer when they malfunction. 2. TEAD Factors: Proteins that help YAP/TAZ attach to DNA. 3. AP-1 (Activator Protein-1):** A group of proteins that also binds to DNA and helps turn genes on and off.
How They Work Together This study used a technique called ChIP-seq on breast cancer cells to see where these proteins (YAP/TAZ and TEAD proteins) attach to the DNA. They found that YAP/TAZ don’t act alone. Instead, they join forces with TEAD and AP-1. The DNA regions where they bind have specific signals (motifs) recognized by both TEAD and AP-1. When YAP/TAZ, TEAD, and AP-1 come together, they form a complex that turns on genes needed for a cell to progress through its cycle, particularly genes that control when a cell starts copying its DNA (S-phase) and when it divides (mitosis). Interestingly, the activation of these genes mostly happens through distant regulatory regions called enhancers. These enhancers loop around to contact the gene’s promoter (the region where gene activation starts), highlighting the importance of the 3D structure of DNA in gene regulation. Additionally, the study shows that increasing AP-1 levels can boost the cancer-promoting effects of YAP/TAZ, while losing AP-1 diminishes these effects. In animal models (mice), removing YAP/TAZ was able to prevent AP-1-driven skin tumor formation, demonstrating that both are crucial for tumor growth.
If you skipped the above section, here is a summary:
The research reveals that YAP/TAZ proteins control cell growth and division not just by binding DNA directly, but by forming a partnership with other DNA-binding proteins (TEAD and AP-1). This cooperative mechanism, particularly through long-distance DNA interactions, is key to understanding how cells decide when to divide and how tumors may develop when this process goes wrong.
Why Reproducing these figures was a rollercoaster worth trying 🎢)
- ChIP-seq is a Big Deal: This journey taught me a lot about ChIP-seq — how it works, why it’s important, and what kind of biological mysteries it can help solve. I finally understand why scientists love this technique. If you want to know which proteins stick to which part of the DNA (like a molecular game of musical chairs), ChIP-seq is your best friend.
- I got up close and personal with ChIP-seq data formats. Ever heard of bedGraph or BigWig files? Neither had I — until I realized they hold crucial information about where proteins are binding in the genome. A bedGraph file is like a detailed list that tells you exactly where proteins are interacting with DNA, point by point. It’s useful for precise analysis but can get bulky and slow when dealing with large data. A BigWig file, on the other hand, is a smarter, more efficient version. It stores the same information but in a compressed and indexed format, making it faster to load and easier to explore in genome browsers without slowing down your computer. Think of bedGraph as raw notes and BigWig as a neatly organized, searchable summary!
- My R Skills Got a Wake-Up Call ! Apparently, if you don’t code in R for a while, your brain starts treating it like a forgotten language. Analyzing ChIP-seq data using R felt like hitting the gym after months of sitting on the couch. This project forced me to dust off my R skills and got me to work with some new packages such as dplyr, tidyr, and EnhancedHeatMap.
- Genome Browsers are hidden gems ! I used IGV (Integrative Genomics Viewer) for the first time, and wow — it’s like Google Maps but for DNA! I had always looked at entire genomes before, but let’s be real — most of the genome is like background noise at a party. The real action happens in tiny, specific regions where genes and regulatory elements work together. IGV helped me zoom in on those important areas instead of getting lost in the genetic abyss. It was like finally understanding which roads on a map are highways and which ones are dead ends.
Something Relatable?
Reproducing figures from a research paper isn’t just a cool flex — it actually teaches you a LOT. And this is why I suggest you to try it :
- It helps you understand different types of research data.
- You’ll learn biological concepts in more depth.
- You’ll figure out which types of graphs are best for different datasets (because not all data should be squeezed into a bar graph). 📊
So, if you’re an early career researcher, looking to upskill, or just someone who enjoys breaking down scientific puzzles, pick a research paper and try to reproduce a figure. Trust me, you’ll learn a lot — and if nothing else, at least you’ll have something to write about on Medium.
Remember: If you understand the problem, you’ve already solved half of it. The other 50%? Just working through it, one error message at a time. 😅
Here are the figures I generated, which shows some discrepancies in numerical values compared to the original paper, but the qualitative and analytical trends remain consistent.
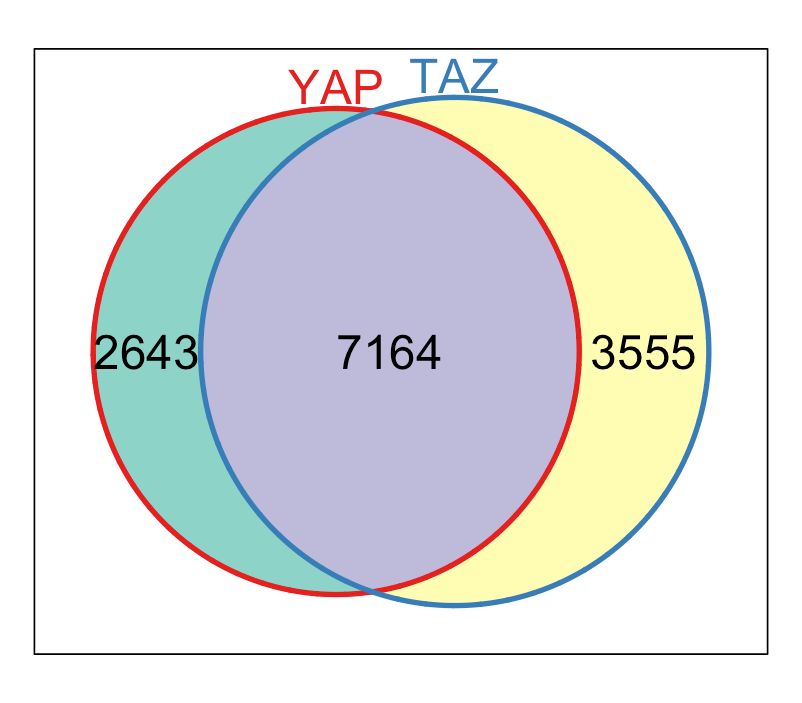
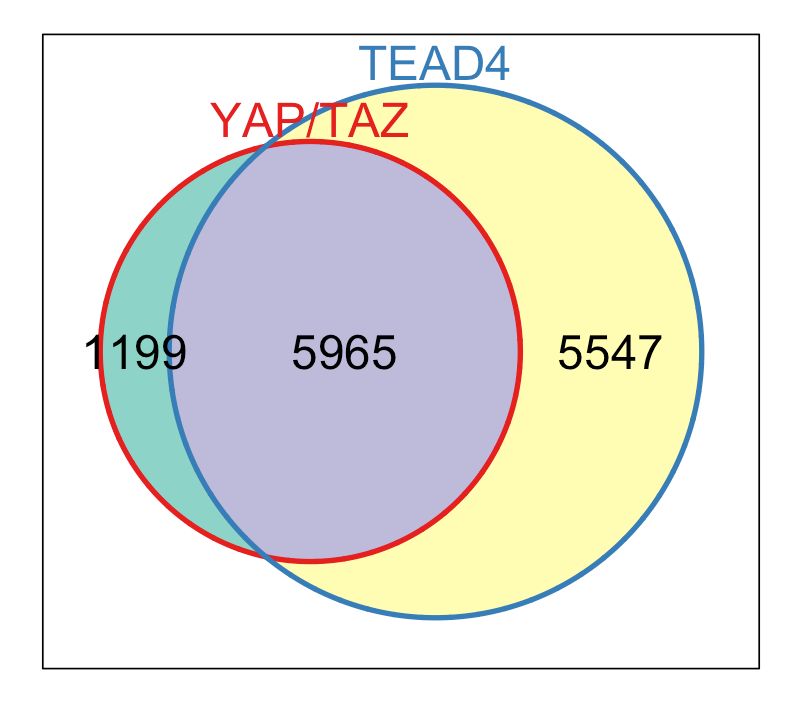
Here, the first venn diagram shows that YAP and TAZ share 7,164 common binding regions. The overlaps indicate that these proteins bind same DNA regions, suggesting they work together. Similarly, the YAP/TAZ overlaps and TEAD4 share 5,965 common binding regions across the region. TEAD4 is a transcription factor that YAP/TAZ are known to interact with. This overlap suggests that a large portion of YAP/TAZ binding is mediated through TEAD4, reinforcing the idea that TEAD4 is a crucial partner in their gene regulatory network.
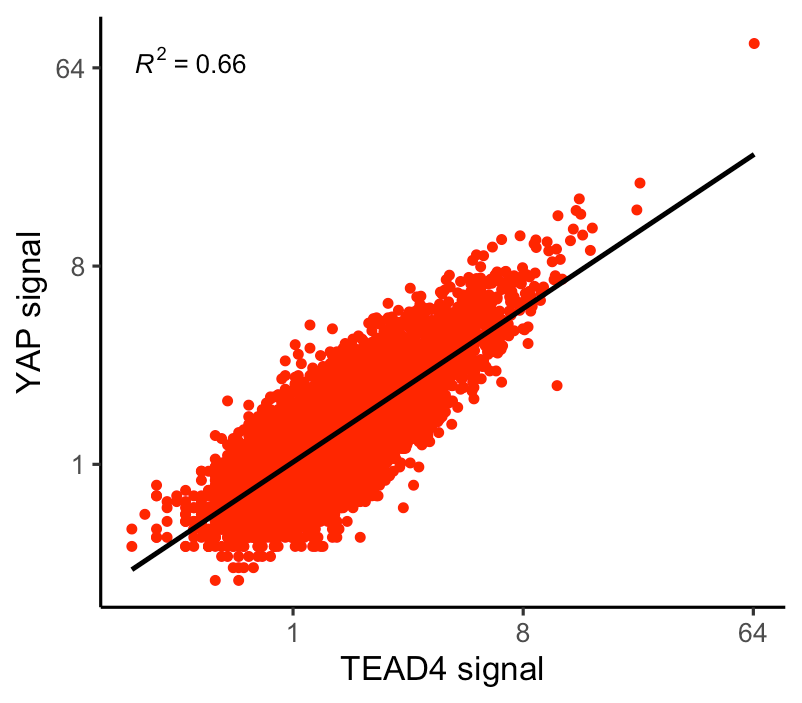
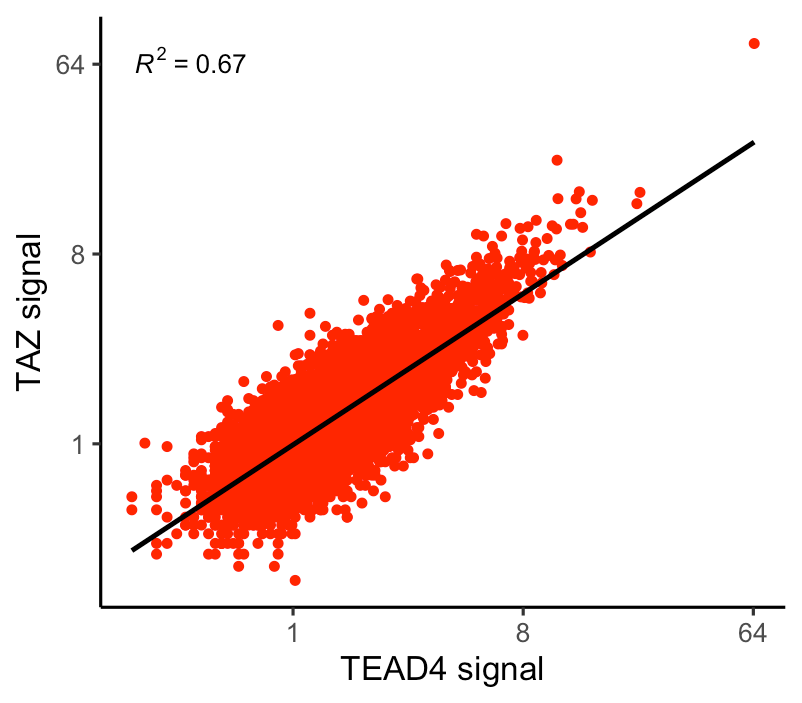
This scatter plot shows how strongly the binding signals of YAP/TAZ and TEAD4 are correlated at 5,965 shared binding sites in the genome. Each red dot represents a genomic region where both YAP/TAZ and TEAD4 bind. The black line (linear regression fit) shows the overall trend between YAP/TAZ and TEAD4 binding signals. The R² value quantifies how well YAP/TAZ binding predicts TEAD4 binding. A higher R² value (closer to 1) means a strong correlation, suggesting that wherever YAP/TAZ binds, TEAD4 tends to bind with a similar intensity.
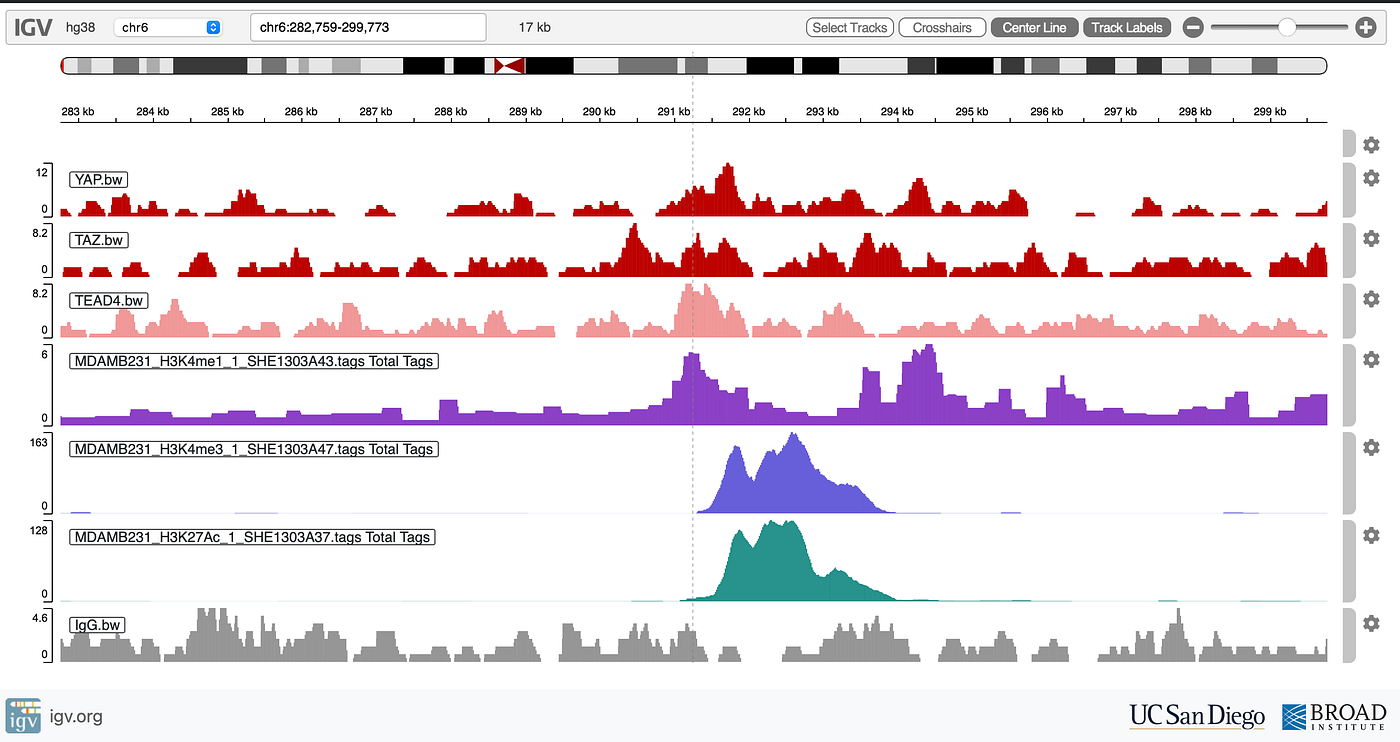
This snapshot provides a visual comparison of the bindings of YAP, TAZ, and TEAD4 with histone modification signals to classify regulatory regions in the genome.
- Top three rows: Show the binding intensity of YAP, TAZ, and TEAD4 from their respective BigWig files. Peaks in these tracks indicate regions where these proteins are interacting with DNA.
- Bottom three rows: Represent histone modifications (H3K4me1, H3K4me3, H3K27ac), which are crucial markers for different types of gene regulatory elements.
By aligning these peaks, we can classify different genomic regions:
- ✔ Promoters → YAP/TAZ/TEAD4 peaks overlapping with H3K4me3
- ✔ Active Enhancers → YAP/TAZ/TEAD4 peaks overlapping with both H3K4me1 and H3K27ac
- ✔ Inactive Enhancers → YAP/TAZ/TEAD4 peaks overlapping with H3K4me1 but NOT with H3K27ac
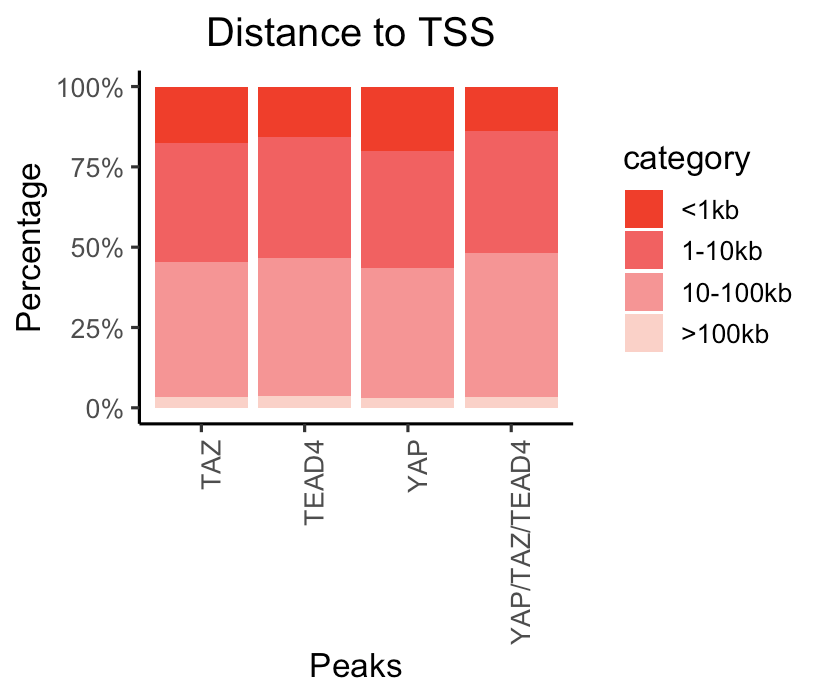
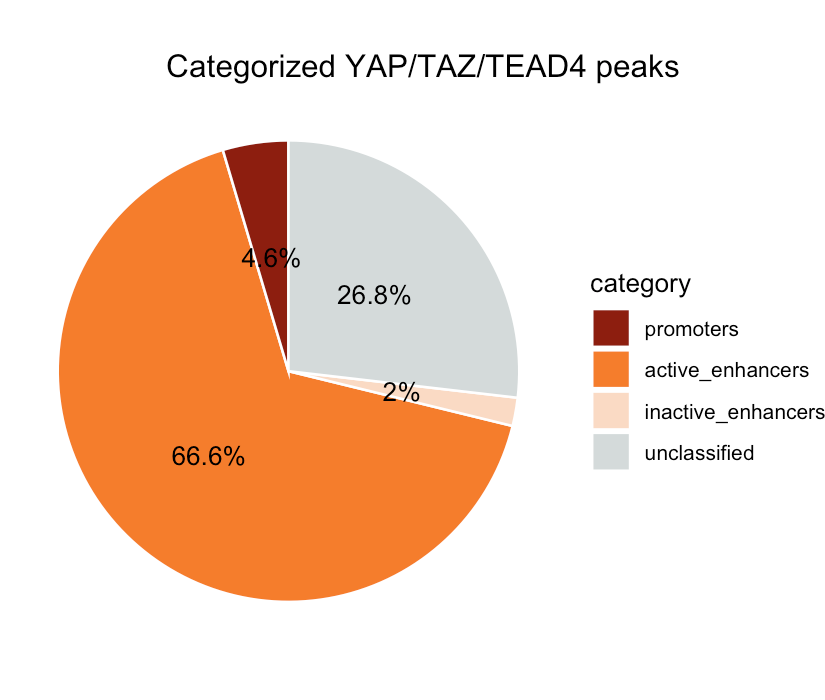
The left side figure is a stacked bar chart that shows absolute distance of YAP, TAZ, TEAD4 and overlapping YAP/TAZ/TEAD4 peaks to the nearest Transcription Start Site (TSS). A majority of the peaks lie between 1 kb to 100 kb from the TSS. This suggests that the majority of YAP, TAZ, and TEAD4 regulatory interactions likely occur in regions farther from the TSS, possibly within enhancer regions or other distal regulatory elements rather than immediately adjacent to the gene promoters. The right figure is a pie chart that shows the fraction of YAP/TAZ/TEAD peaks associated with each category. Majority of the YAP/TAZ/TEAD peaks are associated with active enhancers, supporting the analysis from left figures.
Link to GitHub codes : https://github.com/kuaayush/reproduce_chip_seq_analysis
References 1. Zanconato F, Forcato M, Battilana G, Azzolin L, Quaranta E, Bodega B, Rosato A, Bicciato S, Cordenonsi M, Piccolo S. Genome-wide association between YAP/TAZ/TEAD and AP-1 at enhancers drives oncogenic growth. Nat Cell Biol. 2015 Sep;17(9):1218–27. doi: 10.1038/ncb3216. Epub 2015 Aug 10. PMID: 26258633; PMCID: PMC6186417.
- CrazyHotTommy. Reproducing Genomics Paper Figures. CrazyHotTommy’s Blog. Available from: https://crazyhottommy.github.io/reproduce_genomics_paper_figures/index.html.
메타데이터
- post_id
- 4328ccfaff06
- slug
- reproducing-research-papers-and-surviving-chip-seq-4328ccfaff06
- url
- https://medium.com/@iamaayushojha/reproducing-research-papers-and-surviving-chip-seq-4328ccfaff06
- canonical_url
- https://medium.com/@iamaayushojha/reproducing-research-papers-and-surviving-chip-seq-4328ccfaff06
- author_url
- https://medium.com/@iamaayushojha
- status
- ok
- fetched_at
- 2026-06-09 15:37:30