MongoDB Outage Due to “Too Many Open Files”: Root Cause Analysis, Troubleshooting & Prevention…
How Connection Pool Misconfiguration, File Descriptor Limits, and Application Connection Leaks Can Bring Down Your MongoDB Environment
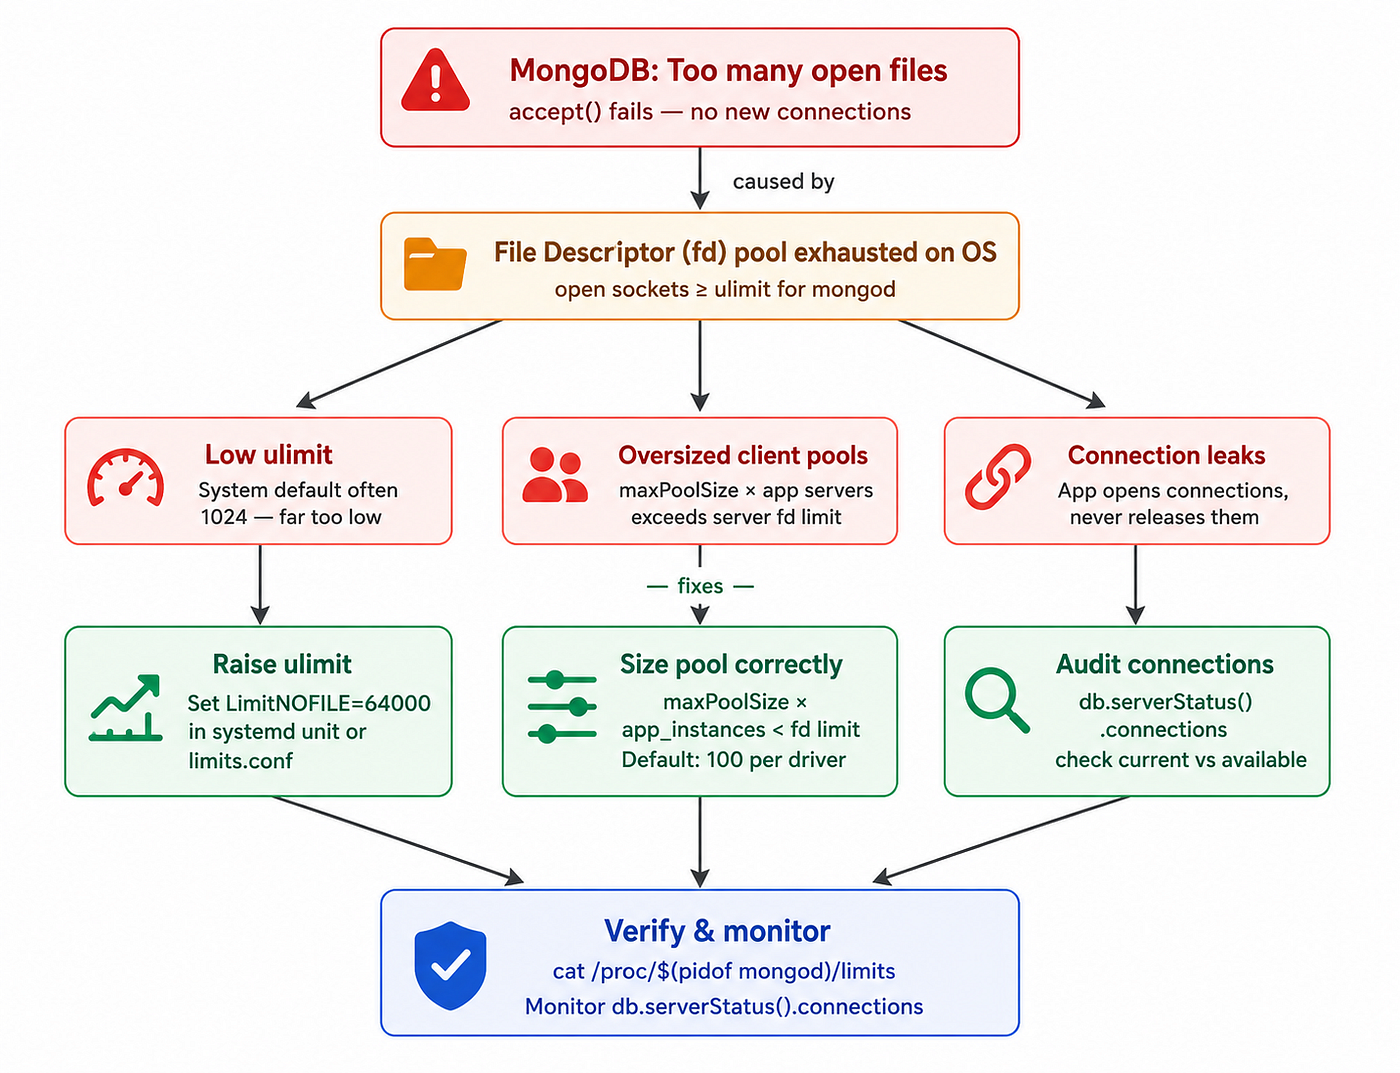
MongoDB Outage Due to “Too Many Open Files”: Root Cause Analysis, Troubleshooting & Prevention Guide
How Connection Pool Misconfiguration, File Descriptor Limits, and Application Connection Leaks Can Bring Down Your MongoDB Environment
**Non-Member= Click HERE!**
MongoDB Outage Due to Too Many Open Files: Complete Root Cause Analysis
Introduction
Production database outages are among the most critical incidents any organization can face. Recently, our MongoDB environment experienced a complete service disruption caused by a “Too Many Open Files” error.
The issue prevented MongoDB from accepting new client connections, resulting in application downtime and service impact.
The error observed in MongoDB logs was:
{
  "msg":"Error accepting new connection on local endpoint",
  "error":"Too many open files"
}
At first glance, this appears to be a MongoDB issue. However, the root cause usually lies deeper within operating system limits, connection pool configurations, application behavior, and infrastructure design.
This article provides a deep dive into the issue, explains why it occurs, how to diagnose it, and the best practices to prevent it from happening again.
What Does “Too Many Open Files” Mean?
In Linux, every open resource consumes a File Descriptor (FD).
These include:
- Database files
- TCP connections
- Network sockets
- Log files
- Pipes
- Temporary files
MongoDB uses file descriptors extensively.
Every incoming client connection consumes one file descriptor on the MongoDB server.
When the operating system’s file descriptor limit is reached, MongoDB cannot accept additional connections.
As a result:
- New application requests fail
- Existing workloads may become unstable
- MongoDB reports connection errors
- Database services become unavailable
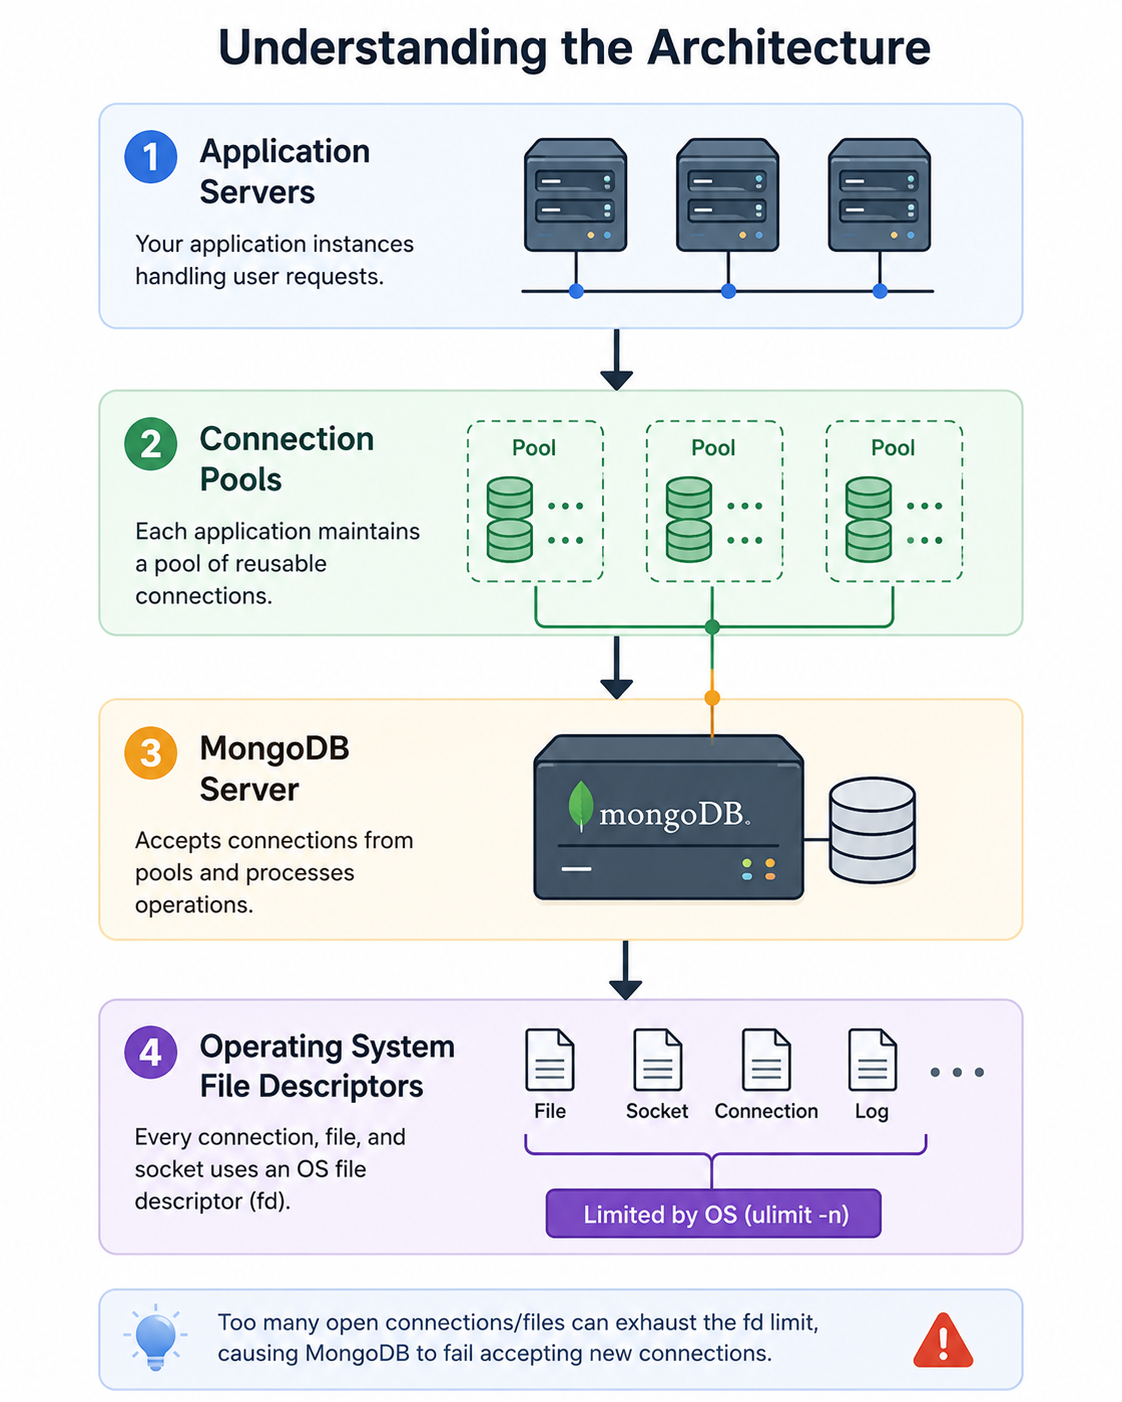
Every layer contributes to file descriptor consumption.
A problem at any layer can eventually exhaust available resources.
Common Root Causes
1. Low File Descriptor Limit (ulimit)
The most common cause is an insufficient OS-level limit.
Many Linux systems still run with defaults such as:
1024
4096
For production MongoDB deployments, MongoDB recommends:
64000+When MongoDB reaches the limit, it cannot create new sockets.
Check Current Limits
cat /proc/$(pidof mongod)/limits | grep "open files"Expected output:
Max open files 64000 640002. Connection Pool Misconfiguration
Modern applications maintain connection pools for efficiency.
However, large connection pools multiplied across multiple application instances can overwhelm MongoDB.
Example
Suppose:
- 10 application servers
- maxPoolSize = 100
Total potential connections:
10 × 100 = 1000 connectionsIf MongoDB’s file descriptor limit is 1024, the database is already near exhaustion.
Recommended Pool Sizes
Python (PyMongo)
MongoClient(
  maxPoolSize=50,
  waitQueueTimeoutMS=2000
)
Node.js
mongoose.connect(uri,{
  maxPoolSize:50
})
Java
.applyToConnectionPoolSettings(
 builder -> builder.maxSize(50)
)
3. Connection Leaks
Connection leaks occur when applications open connections but fail to release them.
Typical causes include:
- Improper exception handling
- Missing cleanup logic
- Thread failures
- Long-running idle sessions
- Poor connection lifecycle management
Over time, leaked connections accumulate and consume all available file descriptors.
How to Diagnose the Issue
Check MongoDB File Descriptor Usage
ls /proc/$(pidof mongod)/fd | wc -lThis shows the current number of open file descriptors.
Check Connection Statistics
db.serverStatus().connectionsExample output:
{
 current: 420,
 available: 63580,
 totalCreated: 182000
}
Important metrics:
| Metric       | Meaning                     |
| ------------ | --------------------------- |
| current      | Active connections          |
| available    | Remaining capacity          |
| totalCreated | Historical connection count |
| ------------ | --------------------------- |
Inspect Running Operations
db.currentOp(true)This provides visibility into all active and inactive operations.
Finding Stale Connections
One of the most useful diagnostic commands is:
db.currentOp({
 active:false,
 secs_running:{ $gt:300 }
})
What It Does
This command identifies:
- Idle connections
- Open for more than 5 minutes
- Potential connection leak candidates
Is It Safe?
Yes.
This command:
✅ Read-only
✅ No locks
✅ No service interruption
✅ No data modifications
✅ Safe for production use
Identifying Problematic Clients
db.currentOp({
 active:false,
 secs_running:{ $gt:300 }
}).inprog.map(op => ({
 client: op.client,
 idle_secs: op.secs_running,
 appName: op.appName
}))
This helps identify:
- Source IP addresses
- Application names
- Idle duration
Making it easier to pinpoint problematic services.
Immediate Fixes
Increase MongoDB File Descriptor Limits
Systemd Configuration
[Service]
LimitNOFILE=64000
Apply changes:
systemctl daemon-reload
systemctl restart mongod
Legacy Linux Configuration
/etc/security/limits.confAdd:
mongod soft nofile 64000
mongod hard nofile 64000
Implement Connection Pool Controls
Connection pools should be carefully sized.
Recommended formula:
Total Connections =
maxPoolSize × Number of App Instances
Ensure:
Total Connections <
FD Limit - 200
The additional 200 descriptors provide buffer for internal MongoDB operations.
Add Idle Connection Cleanup
Configure:
MongoClient(
 maxPoolSize=50,
 maxIdleTimeMS=60000,
 waitQueueTimeoutMS=3000
)
Benefits:
- Removes stale connections
- Prevents resource accumulation
- Improves overall database health
Monitoring Recommendations
Proactive monitoring is critical.
Track:
File Descriptors
ls /proc/$(pidof mongod)/fd | wc -lAlert when:
FD Usage > 80%Active Connections
db.serverStatus().connectionsMonitor trends rather than snapshots.
Connection Creation Rate
Rapid growth in:
totalCreatedOften indicates:
- Connection churn
- Pool misconfiguration
- Application bugs
Best Practices for Production MongoDB
Infrastructure
✔ Set NOFILE ≥ 64000
✔ Monitor FD usage
✔ Monitor connection growth
✔ Use proper alerting
Application Layer
✔ Reuse connections
✔ Limit pool sizes
✔ Configure idle timeouts
✔ Close connections correctly
Operations
✔ Audit long-running sessions
✔ Investigate abnormal connection spikes
✔ Review pool sizing after scaling events
✔ Perform regular capacity reviews
Key Takeaways
✅ Increase MongoDB file descriptor limits to at least 64,000
✅ Monitor open file descriptors continuously
✅ Review application connection pool configurations
✅ Investigate stale or leaked connections
✅ Configure maxIdleTimeMS to clean idle sessions
✅ Establish alerting before resource exhaustion occurs
✅ Regularly review connection growth patterns
***🐧 Linux Server Configuration — Complete Administrator’s Guide (Beginner → Advanced → Production)***
***🏆 Ultimate DevOps & SRE Learning Hub (2026 Edition) — 100% Free, Real-World Knowledge***
🌟 Final Note
This single page is designed to be:
- 📌 Bookmarked
- 📌 Shared
- 📌 Used daily
Thank you for reading! 😊🚀
If you’re a Linux admin, DevOps engineer, cloud engineer, or SRE — this page is your personal technical library.
👏 If it helped you, clap & share 💬 Drop a comment if you want a topic-wise PDF or roadmap next
mongodb MongoDB #mongodberror
메타데이터
- post_id
- 44778db83c18
- slug
- mongodb-outage-due-to-too-many-open-files-root-cause-analysis-troubleshooting-prevention-44778db83c18
- url
- https://blog.devops.dev/mongodb-outage-due-to-too-many-open-files-root-cause-analysis-troubleshooting-prevention-44778db83c18
- canonical_url
- https://blog.devops.dev/mongodb-outage-due-to-too-many-open-files-root-cause-analysis-troubleshooting-prevention-44778db83c18
- author_url
- https://medium.com/@tushar.jadhav29
- status
- ok
- fetched_at
- 2026-06-10 21:21:38