How We Cut Our CI Build Time from 45 Minutes to 4 Minutes
Eighteen months ago, every pull request in our monorepo triggered a 45-minute CI pipeline. Engineers would push a change, context-switch to…
How We Cut Our CI Build Time from 45 Minutes to 4 Minutes
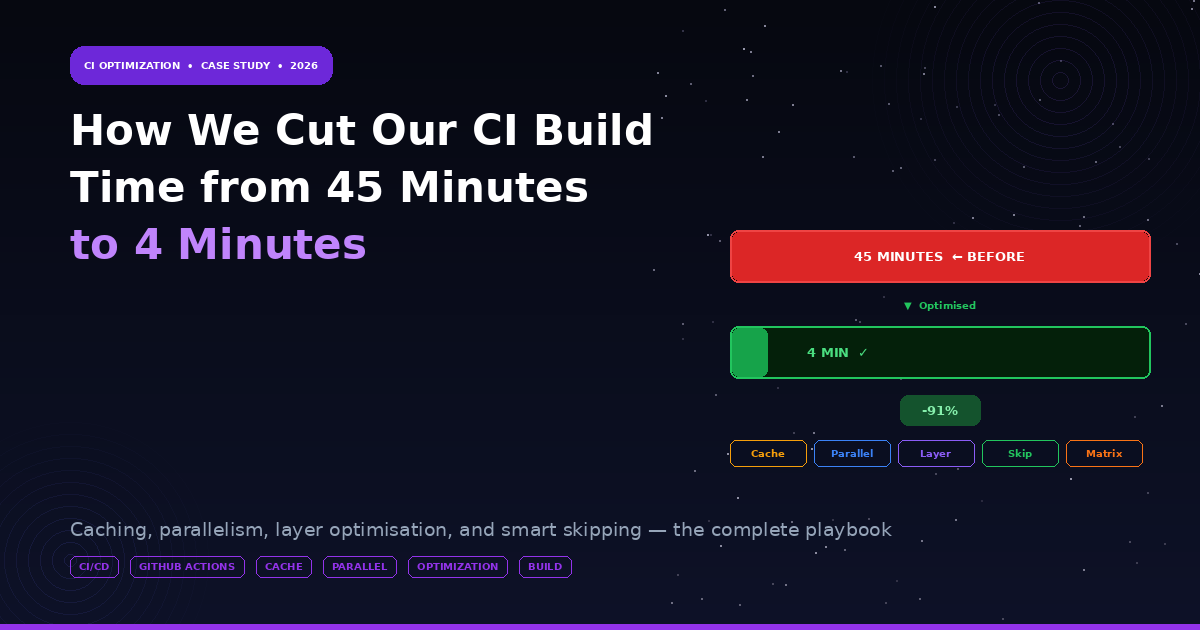
Eighteen months ago, every pull request in our monorepo triggered a 45-minute CI pipeline. Engineers would push a change, context-switch to something else, come back, miss the result, context-switch again, check it, find an unrelated test failure, investigate, fix, push, wait 45 more minutes. In practice, the cycle time from code change to confident merge was over two hours. Iteration velocity was visibly impacted — engineers would batch changes to avoid CI wait time, creating larger, riskier PRs.
Today, the same pipeline runs in 4 minutes for the median change. A broad infrastructure change that triggers most services still runs in under 8 minutes. This document is the complete story of how we got there — the specific optimisations, in the order we implemented them, with the time savings each one delivered. Nothing here is novel engineering. All of it is applying well-understood techniques that are underutilised in most organisations.
OUR STARTING POINT
Monorepo with 12 services (Python, Go, TypeScript). 45-minute CI pipeline: checkout → lint → test (all services) → Docker build → push → deploy to staging. No caching. No parallelism. All services built on every commit. GitHub Actions on ubuntu-latest runners.
The Audit: Why Was It 45 Minutes?
# Before: sequential pipeline, everything runs on every commit
jobs:
  ci:
    runs-on: ubuntu-latest
    steps:
    - uses: actions/checkout@v4
    - name: Install Python deps      # 4 min
      run: pip install -r requirements.txt
    - name: Install Node deps         # 3 min
      run: npm ci
    - name: Lint all services         # 6 min
      run: ./scripts/lint-all.sh
    - name: Test all services         # 18 min
      run: ./scripts/test-all.sh
    - name: Build all Docker images   # 11 min
      run: ./scripts/build-all.sh
    - name: Push images               # 3 min
      run: ./scripts/push-all.sh
    # Total: ~45 minutes
    # Every single step runs for every commit, regardless of what changed
Step

Optimisation 1: Dependency Caching (Saved 7 Minutes)
The single highest-ROI optimisation: cache pip and npm dependencies between runs. On a cold run, installing dependencies takes 4–7 minutes. On a cached run, the restore takes 5–15 seconds. Dependencies change in less than 10% of commits. We were reinstalling them 100% of the time.
Python dependency caching
- name: Set up Python with cache
uses: actions/setup-python@v5
with:
python-version: ‘3.12’
cache: ‘pip’ # Built-in cache — hashes requirements.txt
cache-dependency-path: |
requirements.txt
requirements-dev.txt
Node.js dependency caching
- name: Set up Node with cache
uses: actions/setup-node@v4
with:
node-version: ‘20’
cache: ‘npm’
cache-dependency-path: package-lock.json
Go module caching (manual — setup-go has built-in but needs tuning)
- name: Cache Go modules
uses: actions/cache@v4
with:
path: |
~/.cache/go-build
~/go/pkg/mod
key: ${{ runner.os }}-go-${{ hashFiles(‘**/go.sum’) }}
restore-keys: |
${{ runner.os }}-go-
Result: dependency installation: 7 min → 23s (cache hit rate: 92%)
Optimisation 2: Build Only What Changed (Saved 14 Minutes)
The most impactful optimisation: do not build or test services that did not change. A one-line fix to a Python service’s documentation should not trigger 11 minutes of Go service builds.
Step 1: Detect which services changed
jobs:
detect-changes:
runs-on: ubuntu-latest
outputs:
payments: ${{ steps.changes.outputs.payments }}
user-service: ${{ steps.changes.outputs.user-service }}
api-gateway: ${{ steps.changes.outputs.api-gateway }}
steps:
- uses: actions/checkout@v4
with: { fetch-depth: 0 }
- id: changes
uses: tj-actions/changed-files@v45
with:
files_yaml: |
payments:
-
services/payments/**
-
shared/proto/payments.proto
user-service:
- services/user-service/**
api-gateway:
-
services/api-gateway/**
-
config/nginx/**
Step 2: Each service job only runs if its files changed
test-payments:
needs: detect-changes
if: needs.detect-changes.outputs.payments == ‘true’
runs-on: ubuntu-latest
steps:
- uses: actions/checkout@v4
with:
sparse-checkout: |
services/payments
shared/proto
- run: cd services/payments && make test
Result: median commit touches 1–2 services
Before: test 12 services every time = 18 min
After: test 1–2 services = 2–4 min
Optimisation 3: Test Parallelism (Saved 4 More Minutes)
For services with large test suites, splitting tests across parallel runners dramatically reduces wall-clock time. The matrix strategy in GitHub Actions is the simplest way to achieve this.
Parallel test matrix: split test suite across 4 runners
test-payments:
runs-on: ubuntu-latest
strategy:
matrix:
shard: [1, 2, 3, 4]
fail-fast: false # Don’t cancel other shards if one fails
steps:
-
uses: actions/checkout@v4
-
name: Run test shard ${{ matrix.shard }} of 4
run: |
pytest services/payments/tests/ \
— test-shard-id=${{ matrix.shard }} \
— num-test-shards=4 \
— junitxml=test-results-${{ matrix.shard }}.xml
pytest-shard plugin distributes tests evenly across shards
For Go: use gotestsum with -p flag for parallel packages
- run: |
gotestsum — format dots — \
-p 4 \
./services/api-gateway/…
Merge coverage reports from all shards
coverage-merge:
needs: test-payments
runs-on: ubuntu-latest
steps:
- uses: actions/download-artifact@v4
with: { name: test-results, path: test-results/ }
- run: coverage combine test-results/
Optimisation 4: Docker Layer Caching (Saved 10 Minutes)
Docker builds rebuild from scratch on every CI run without layer caching. GitHub Actions provides a cache backend for BuildKit that stores and restores Docker layers between runs. For a well-structured Dockerfile (dependencies first, application code last), the cached layers mean only the application code layer rebuilds on most commits.
Optimised Dockerfile structure — CACHE LAYERS LAST-CHANGED LAST
FROM python:3.12-slim AS base
WORKDIR /app
Layer 1: System deps (changes rarely — cached for weeks)
RUN apt-get update && apt-get install -y — no-install-recommends \
libpq-dev gcc && rm -rf /var/lib/apt/lists/*
Layer 2: Python deps (changes with requirements.txt — cached until deps change)
COPY requirements.txt .
RUN pip install — no-cache-dir -r requirements.txt
Layer 3: Application code (changes on every commit — always rebuilds)
COPY src/ ./src/
CMD [“python”, “-m”, “uvicorn”, “src.main:app”]
GitHub Actions: Docker build with layer caching
- uses: docker/build-push-action@v6
with:
context: services/payments
push: ${{ github.ref == ‘refs/heads/main’ }}
tags: ghcr.io/${{ github.repository }}/payments:${{ github.sha }}
cache-from: type=gha,scope=payments # Service-specific cache
cache-to: type=gha,scope=payments,mode=max
Result: 11 minutes (cold) → 70 seconds (warm cache, code-only change)
Cache hit rate after first week: 88%
Optimisation 5: Sparse Checkout for Monorepo (Saved 30 Seconds)
Default checkout clones the ENTIRE monorepo (3.2 GB in our case)
For a service-specific job, you only need that service’s files
- uses: actions/checkout@v4
with:
sparse-checkout: |
services/payments
shared/proto
shared/utils
Makefile
Checkout time: 45s (full) → 6s (sparse) for this service
For the detect-changes job: still need full history for git diff
- uses: actions/checkout@v4
with:
fetch-depth: 0 # Full history for change detection
No sparse-checkout — we need to see all changed paths
Optimisation 6: Fail Fast on Lint (Saved CI Minutes via Early Exit)
Run fast checks first — fail immediately if they fail
Don’t spend 4 minutes on tests if lint fails in 30 seconds
jobs:
lint:
runs-on: ubuntu-latest
steps:
-
uses: actions/checkout@v4
-
uses: astral-sh/ruff-action@v1 # Fastest Python linter (< 1s)
with:
src: services/payments/src
- uses: golangci/golangci-lint-action@v6
with:
working-directory: services/api-gateway
args: — timeout 60s
test:
needs: lint # Only run tests if lint passes
…
build:
needs: [lint, test] # Only build if both pass
…
Optimisation 7: Reusable Workflows to Eliminate Duplication
Before: 12 service-specific workflows, each 200+ lines
After: 1 reusable workflow, called by each service
.github/workflows/service-ci.yml (reusable template)
on:
workflow_call:
inputs:
service-name: { type: string, required: true }
service-path: { type: string, required: true }
test-shards: { type: number, default: 2 }
jobs:
test:
runs-on: ubuntu-latest
strategy:
matrix:
shard: ${{ fromJson(format(‘[{0}]’, join(range(inputs.test-shards), ‘,’))) }}
steps:
- uses: actions/checkout@v4
with:
sparse-checkout: |
${{ inputs.service-path }}
shared/
- run: cd ${{ inputs.service-path }} && make test SHARD=${{ matrix.shard }}
Per-service caller: payments-ci.yml (5 lines instead of 200)
on: [push, pull_request]
jobs:
ci:
uses: ./.github/workflows/service-ci.yml
with:
service-name: payments
service-path: services/payments
test-shards: 4 # Payments is large; use 4 shards
The Complete Before/After

The total engineering investment was approximately 20 hours, spread across three weeks of incremental improvements. The return: every engineer on the team gets 37 minutes back per CI run. With 15 engineers averaging 4 CI runs per day, that is 37 hours of engineering time recovered per day — or roughly 740 hours per month. At a conservative engineering cost, the ROI of this 20-hour investment pays back in under two days.
WHERE TO START
Run a timing analysis of your current CI pipeline first: add time tracking to each step and identify where the time actually goes. In our case, 40% of the time was in testing services that had not changed — the detect-changes optimisation alone saved 14 minutes. Your biggest savings are probably in a different place. Measure before optimising.
메타데이터
- post_id
- 46b74fb3b09b
- slug
- how-we-cut-our-ci-build-time-from-45-minutes-to-4-minutes-46b74fb3b09b
- url
- https://medium.com/devops-ai-decoded/how-we-cut-our-ci-build-time-from-45-minutes-to-4-minutes-46b74fb3b09b
- canonical_url
- https://medium.com/devops-ai-decoded/how-we-cut-our-ci-build-time-from-45-minutes-to-4-minutes-46b74fb3b09b
- author_url
- https://medium.com/@shahneel2409
- status
- ok
- fetched_at
- 2026-06-29 01:02:39