TryHackMe | Splunk: The Basics
Understand how SOC analysts use Splunk for log investigations.
TryHackMe | Splunk: The Basics
Understand how SOC analysts use Splunk for log investigations.

TryHackMe | Splunk: The Basics
Task1: Introduction
Splunk is one of the leading SIEM solutions in the market. It allows users to collect, analyze, and correlate network and machine logs in real time. In this room, we will explore the basics of Splunk and its functionalities, and how it provides better visibility of network activities and helps speed up detection.
Learning Objectives
This room covers the following learning objectives:
- Understanding the components of Splunk
- Exploring some available options in Splunk
- Understanding log ingestion in Splunk
- Practically ingesting some Logs in Splunk and analyzing them
Room Prerequisites
If you are new to SIEM, please complete the Introduction to SIEM room.
Answer the questions below
Read the task above.
Task2: Connect With Lab
Before proceeding with the following tasks, start the attached lab machine by clicking the Start Lab Machine below.
The machine may take up to 3–5 minutes to start. After the machine starts, the Splunk Instance can be accessed at http://MACHINE_IP either directly on the AttackBox or via the TryHackMe VPN.
Use the URL exactly as shown after the machine starts. Do not add :8000; this lab serves Splunk on the default HTTP port.
Answer the questions below
Read the task above.
Task3: Splunk Components
Splunk is a platform for collecting, storing, and analysing machine data. It provides various tools for analysing data, including search, correlation, and visualisation. It is a powerful tool that organisations of all sizes can use to improve their IT operations and security posture.
Splunk has three main components: Forwarder, Indexer, and Search Head. These components work together to help us search and analyze the data. These components are explained below:

(1) Splunk Forwarder
Splunk Forwarder is a lightweight agent installed on the endpoint intended to be monitored, and its main task is to collect the data and send it to the Splunk instance. It does not affect the endpoint’s performance as it takes a few resources to process. Some of the key data sources are:
- Web server generating web traffic.
- Windows machine generating Windows Event Logs, PowerShell, and Sysmon data.
- Linux host generating host-centric logs.
- Database generating DB connection requests, responses, and errors.

The forwarder collects the data from the log sources and sends it to the Splunk Indexer.
(2) Splunk Indexer
Splunk Indexer plays the main role in processing the data it receives from forwarders. It parses and normalizes the data into field-value pairs, categorizes it, and stores the results as events, making the processed data easy to search and analyze.

(3) Search Head
Splunk Search Head is the place within the Search & Reporting App where users can search the indexed logs, as shown below. The searches are done using the SPL (Search Processing Language), a powerful query language for searching indexed data. When the user performs a search, the request is sent to the indexer, and the relevant events are returned as field-value pairs.

The Search Head also allows you to transform results into presentable tables and visualizations such as pie, bar, and column charts, as shown below:

Answer the questions below
Which component is used to collect and send data over the Splunk instance?
Answer: Forwarder
Task4: Navigation Splunk
When you access Splunk, you will see the default home screen as shown below:

Let’s look at each section of this home screen.
Splunk Bar
The top panel is the Splunk Bar as shown below:

In the Splunk Bar, we have the following options available:
- Messages: View system-level notifications and messages.
- Settings: Configure Splunk instance settings.
- Activity: Review the progress of search jobs and processes.
- Help: View tutorials and documentation.
- Find: Search across the App.
Apps Panel
Next is the Apps Panel. This panel shows the apps installed for the Splunk instance. The default app for every Splunk installation is Search & Reporting.

You can also switch between the Splunk Apps directly from the Splunk Bar, as shown below, without using the Apps Panel.

Explore Splunk
The next section is Explore Splunk . This panel contains quick links to add data to the Splunk instance, add new Splunk apps, and access the Splunk documentation.

Splunk Dashboard
The last section is the Home Dashboard. By default, no dashboards are displayed. You can choose from a range of dashboards readily available within your Splunk instance. You can select a dashboard from the dropdown menu or by visiting the dashboards listing page.

Answer the questions below
In the Add Data tab, which option is used to collect data from files and ports?
Answer: Monitor
Task5: Adding Data
Splunk can ingest any data. According to the Splunk documentation, when data is added to Splunk, the data is processed and transformed into a series of individual events. The data sources can be event logs, website logs, firewall logs, etc. The data sources are grouped into categories.
Below is a chart listing from the Splunk documentation detailing each data source category.

In this task, we’re going to focus on VPN logs. We’re presented with the following screen when we click on the Add Data link on the Splunk home screen.

We will use the Upload Option to upload the data from our local machine.
Practical
Download the log file VPN_logs from the Download Task Files button below and upload it to the Splunk instance we started in Task #2. If you are using the AttackBox, the log file is available in the /root/Rooms/SplunkBasic/ directory.
To upload the data successfully, you must follow five steps, which are explained below:
- Select Source: Choose the Log file and the data source.
- Select Source Type: Select what type of logs are being ingested, e.g, JSON, syslog.
- Input Settings: Select the index where these logs will be dumped and the HOSTNAME to be associated with the logs.
- Review: Review all the configurations.
- Done: Complete the upload. Your data will be uploaded successfully and ready to be analyzed.
Useful checks
index=VPN_Logs
| stats count
index=VPN_Logs
| spath
| search UserName="Maleena"
| stats countindex=VPN_Logs
| spath
| search Source_ip="107.14.182.38"
| stats values(UserName) as UserName countindex=VPN_Logs
| spath
| search Source_Country!="France"
| stats countindex=VPN_Logs
| spath
| search Source_ip="107.3.206.58"
| stats countAnswer the questions below
Upload the data attached to this task and create an index “VPN_Logs”. How many events are present in the log file?
Press the upload method button:

Now press next:

Now you have to select the source type, which is JSON. Press next again.

Now we have to enter a host field value, which should be similar to the name of the machine (host). Let’s enter VPN_Connections here.

Now, create a new index called VPN_Logs. Press next, check everything and press Submit. Finally, press Start Searching.
Now you come in the search screen. To see the correct number of events I have to press the search button once.

The number of events is 2862.
Answer: 2862
How many log events are captured by the user Maleena?
Great job. Now let’s find how many of these events are captured by Maleena. This is not that hard. Find the Username field on the left menu, and press Maleena.

Alternatively, you can enter the following in the search input field:
source=”VPNlogs.json” host=”VPN_Connections” index=”vpn_logs” sourcetype=”_json” UserName=Maleena
Answer: 60
What is the username associated with IP 107.14.182.38?
If you look at the data rows, you can see that there is a field called Source_ip.
Make sure you removed the filter on Maleena, and press the source ip field. Select any of the IPs to see how to edit the input field. Now you can edit the IP address to sort on.
source=”VPNlogs.json” host=”VPN_Connections” index=”vpn_logs” sourcetype=”_json” Source_ip=”107.14.182.38″
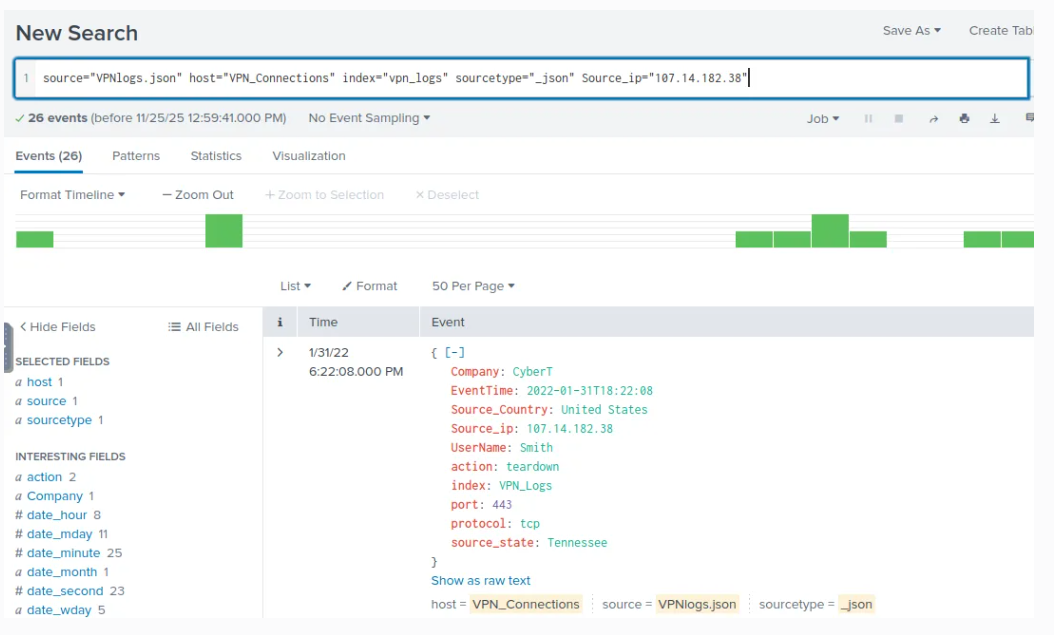
Answer: Smith
What is the number of events that originated from all countries except France?
The field we need to use here is called Source_Country.
Normally, if we were only interested in France we would use something like “Source_Country=France”, but to do the opposite we !=. The search field should look like this:
source=”VPNlogs.json” host=”VPN_Connections” index=”vpn_logs” sourcetype=”_json” Source_Country!=France

Answer: 2814
How many VPN events were associated with the IP 107.3.206.58?
I hope you are getting the grip of these. You should probably know now how to filter on a specific commands using the Splunk search language (SPL). Simply write:
source=”VPNlogs.json” host=”VPN_Connections” index=”vpn_logs” sourcetype=”_json” Source_ip=”107.3.206.58″

Answer: 14
Task 6: Conclusion
Well done! In this room, you learned about Splunk’s core components, explored the Splunk interface, and practiced uploading data to Splunk. You have gained the foundational knowledge of Splunk SIEM.
If you’d like to dig deeper, you can explore the following Splunk walkthrough and challenge rooms to understand how Splunk is effectively used in investigating incidents.
- Splunk: Exploring SPL
- Incident Handling with Splunk
- Investigating With Splunk
- Benign — Challenge
- PoshEclipse — Challenge
Answer the questions below
Read the task above.
Thank you for reading. Until next time :-)
메타데이터
- post_id
- 47bc4004b8a9
- slug
- tryhackme-splunk-the-basics-47bc4004b8a9
- url
- https://medium.com/@Omda404x/tryhackme-splunk-the-basics-47bc4004b8a9
- canonical_url
- https://medium.com/@Omda404x/tryhackme-splunk-the-basics-47bc4004b8a9
- author_url
- https://medium.com/@Omda404x
- status
- ok
- fetched_at
- 2026-07-14 09:24:11