The Hidden Complexity of Lapse Modeling in Life Insurance
Why lapse is not a rate — but a system
The Hidden Complexity of Lapse Modeling in Life Insurance
Why lapse is not a rate — but a system
Lapse Looks Simple — Until It Breaks Your Model
Lapse is often treated as a minor assumption — a small curve tucked somewhere between mortality and expenses. In reality, it is one of the most structurally unstable components in a life model.
I learned this while building a Best Estimate Liability pipeline for non-participating term life contracts. Four cohorts, clean assumptions, deterministic projection. Everything was textbook.
Then I ran the lapse stress.
A +10% lapse shock on a young cohort (age 35, 30-year term) pushed BEL up. The same +10% shock on an older cohort (age 65, 15-year term) pushed BEL down.
Same product. Same stress. Opposite direction. That was the moment I realized:
Lapse is not a rate. Lapse is a system. And like any system, its behavior emerges from interactions — not components.
The Lapse System: Four Forces, One Behavior
Under Solvency II, lapse risk accounts for approximately 50% of the life underwriting risk — making it the single most material sub-module (EIOPA QIS5, 2011). Yet despite its weight, lapse is routinely modeled with a single deterministic curve.
Eling & Kochanski (2013) surveyed over 50 papers on lapse modeling and identified two dominant research streams: theoretical models of surrender behavior and empirical analysis of lapse drivers. Building on their classification, I find it useful to think of lapse as four interacting forces:
- Structural Baseline (Duration) — natural decay
- Economic Triggers (Rate Spread) — incentive
- Behavioral Amplification (Contagion) — multiplier
- Selection Distortion (Adverse Selection) — bias
Each of these is individually well-studied. The problem is that they interact — and models rarely capture those interactions.
What makes lapse a system is not the number of drivers, but the fact that changes in one force alter the sensitivity of the others.
Structural Baseline: The Duration Curve That Lies
The duration curve is familiar — and misleading.
Most actuaries know the pattern: high early-duration lapse rates that taper off over time. It looks smooth, predictable, almost mechanical. But this smoothness hides real structure.
Kochanski, Böttcher, and Geldner (2022) applied automated Lasso methods to policy-level data from a European insurer and found that duration interacts heavily with product type and policyholder attributes. What appears as a smooth curve is often the projection of multiple behavioral regimes — different populations lapsing for different reasons at different times, collapsed into a single line.
Treating it as smooth is not simplification — it is information loss.
This matters because duration is often treated as exogenous, while in reality it is the result of past selection.
And in lapse modeling, information loss becomes risk.
Economic Triggers: Why Rates Act Like a Switch
Lapse does not respond linearly to rates. It responds to thresholds.
Conceptually, the trigger mechanism can be described as:
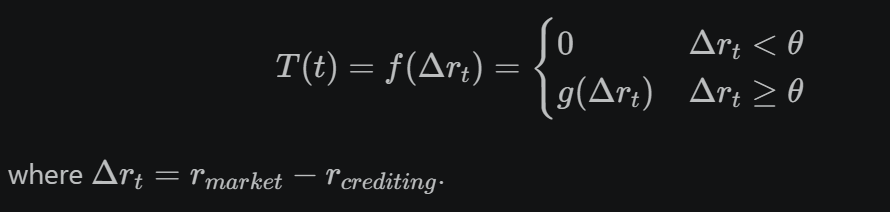
The key point is not the functional form, but the existence of a regime switch.
In practice, this means small market moves often do nothing — until one day they suddenly matter.
Below the threshold, policyholder behavior is stable. Above it, lapses activate — and the response is nonlinear.
Swiss Re (2024) provides empirical support for this pattern: a 100-basis-point rise in policy rates correlates with approximately 30–35 bps increase in lapse rates, with roughly half of the response concentrated in the first three to four hiking periods. The trigger is not gradual — it front-loads.
But triggers don’t determine outcomes.
Triggers activate amplification — and amplification determines the outcome.
Behavioral Amplification: Lapse as Contagion
Once triggered, lapse does not simply increase — it accelerates.
Barsotti, Milhaud, and Salhi (2016) formalize this intuition using a dynamic contagion process where the lapse intensity follows a self-exciting jump process:

Each lapse event (τ) increases the intensity of future lapses by α, with the effect decaying at rate β. Recent events matter more — recency bias is baked into the structure.
In their framework, an external market-driven component activates when the spread between market rates and contractual crediting rates crosses a given threshold — linking the trigger mechanism in Section 4 to behavioral amplification.
This creates the first key interaction:
Trigger → Amplification
Rates create the signal. Behavior determines the magnitude. This is why observed lapse spikes often exceed what economic rationality alone would predict.
Selection Distortion: Amplifying the Wrong Risk
Selective lapse is not noise — it is directional.
When lapse increases, it is not the average policyholder who leaves. Empirically, lower-risk policyholders are more likely to lapse — they have options, they are healthier, they can re-enter the market. Higher-risk policyholders persist — they need the coverage, and they know it.
This is not a claim about every individual policyholder, but about the direction of aggregate selection under stress — which is what capital and BEL ultimately respond to.
This means every lapse event shifts the remaining portfolio toward higher risk.
Now combine that with amplification:
Amplification × Selection
When lapse spikes, the portfolio doesn’t just shrink — it deteriorates.
Haçarız, Kleinow, and Macdonald (2024) demonstrate this risk quantitatively. In their Term-to-100 example, a policy generating an expected profit of $103,000 under assumed lapse rates would produce a loss of $942,000 with zero lapses — a swing driven entirely by the interaction between lapse-supported pricing and selective persistence.
The lesson: lapse risk is not just about volume. It is about composition.
The BEL Paradox: When Higher Lapse Can Move in Either Direction
This is where the system becomes concrete.
When I stress-tested lapse in my BEL pipeline — four cohorts, all non-participating term life, no guarantees, no surrender value — the model didn’t respond uniformly. It reacted according to the underlying cash-flow economics of each cohort.
The same +10% lapse shock produced opposite movements in BEL.
C1 — Age 35, 30-year term: Lapse +10% → BEL increased
Young cohorts are premium-rich and mortality-light. When lapse rises, the model loses a long stream of future premiums immediately, while the mortality cost relief is marginal and far in the future. The premium loss dominates — and BEL goes up.
C4 — Age 65, 15-year term: Lapse +10% → BEL decreased
Older cohorts flip the economics. Premiums are nearly exhausted, but mortality costs are heavy and imminent. When lapse rises, the model releases high-cost future claims faster than it loses premium income. The mortality cost release dominates — and BEL goes down.
The deeper insight:
Nothing in the product design changed. Nothing in the assumptions changed. Only the interaction between lapse and the underlying financial regime changed.
Early durations behave like a premium-driven system. Late durations behave like a mortality-driven system.
The lapse shock changes which side of the balance sheet dominates.
The same lapse shock flows through two different financial regimes, and the model reacts according to whichever force is stronger:
Lapse ↑ → Premium loss vs. Mortality cost release The dominant force defines the direction of BEL. This is not a product-specific curiosity. It is a structural feature of any long-duration life product where premium adequacy varies by age and remaining term. This regime shift is driven by remaining term and attained age, not by product design.
Why Deterministic Curves Fail
Deterministic curves describe the mean. But the risk is in the structure around the mean. They assume:
- independence across policyholders
- linear response to economic variables
- homogeneous behavior across cohorts
The real system is:
- dependent (contagion)
- nonlinear (thresholds and amplification)
- heterogeneous (cohort-specific sensitivity)
- path-dependent (selection shifts the portfolio over time)
So the problem is not simplification.
It’s mis-specification.
Berdin and Gründl (2015) show that in the case of a sharp interest rate increase, the interaction between asset value declines and elevated lapse rates can deteriorate an insurer’s solvency position in the short run — an outcome that deterministic lapse assumptions structurally cannot capture.
Deterministic lapse models don’t just simplify reality — they systematically underestimate the risks that matter most.
They fail exactly where they are most needed: under stress.
This does not imply that stochastic models are always superior, only that deterministic ones require explicit structural safeguards.
What Changes in Practice
Once lapse is understood as a system, the failure of purely deterministic stresses becomes inevitable.
The implication is not to abandon deterministic curves — but to understand what they cannot do.
A curve gives you a baseline. It does not give you a stress response.
A realistic approach must account for:
- threshold activation, not linear sensitivity
- feedback loops between lapses
- selection bias that shifts portfolio composition
- cohort-dependent directionality Most importantly:
Stress the interactions — not just the inputs.
A lapse stress that ignores cohort structure, ignores selection, and ignores amplification is not conservative. It is incomplete.
Final Thought
The issue is not that lapse models are too simple.
It’s that they are blind in the wrong direction.
Triggers, amplification, selection, competing cash-flow dynamics — these forces don’t add. They compound.
And until lapse is modeled as a system, the largest risks will remain hidden — not in the baseline, but in the interactions.
This is not an actuarial problem. It is a system-design problem.
In actuarial modeling, the danger is rarely in what we model — it is in what we assume away.
References
[1] Eling, M. & Kochanski, M. (2013). Research on lapse in life insurance: what has been done and what needs to be done? Journal of Risk Finance, 14(4), 392–413.
[2] Swiss Re Institute (2024). Life insurance in the higher interest rate era. Sigma №2/2024.
[3] Barsotti, F., Milhaud, X., & Salhi, Y. (2016). Lapse risk in life insurance: correlation and contagion effects among policyholders’ behaviors. Insurance: Mathematics and Economics, 71, 317–331.
[4] Haçarız, O., Kleinow, T., & Macdonald, A.S. (2024). Lapse-supported life insurance and adverse selection. arXiv:2409.01843.
[5] Kochanski, M., Böttcher, B., & Geldner, M. (2022). Identifying the determinants of lapse rates in life insurance: an automated Lasso approach. European Actuarial Journal, 12, 315–340.
[6] Berdin, E. & Gründl, H. (2015). Rising interest rates, lapse risk, and the stability of life insurers. ICIR Working Paper Series №29/17.
About the author
SukHee Lee is an actuarial data analyst working at the intersection of insurance, reserving, and data engineering, with hands-on experience in IFRS 17-related data pipelines.
GitHub: github.com/SHLee5864
메타데이터
- post_id
- 488f33f0f928
- slug
- the-hidden-complexity-of-lapse-modeling-in-life-insurance-488f33f0f928
- url
- https://medium.com/@lsh5864/the-hidden-complexity-of-lapse-modeling-in-life-insurance-488f33f0f928
- canonical_url
- https://medium.com/@lsh5864/the-hidden-complexity-of-lapse-modeling-in-life-insurance-488f33f0f928
- author_url
- https://medium.com/@lsh5864
- status
- ok
- fetched_at
- 2026-07-14 02:52:02