Part 1B.1: Visual Studio Profiler — CPU Usage
Functions View Deep Dive: Understanding Every Column, Every Metric, and How to Find CPU Hotspots
Part 1B.1: Visual Studio Profiler — CPU Usage
Functions View Deep Dive: Understanding Every Column, Every Metric, and How to Find CPU Hotspots
Most developers stop at the Summary page and assume they’ve found the problem.
In reality, the Summary page only tells you where the CPU is being consumed. It doesn’t explain why it’s happening.
The detailed views are where the real investigation begins. They allow you to drill into individual methods, follow execution paths, and pinpoint the exact code responsible for the CPU hotspot.
What You’ll Learn
By the end of this article, you’ll know:
- How to navigate to the detailed views
- How to read every column in the Functions view
- The difference between Total CPU and Self CPU
- How to determine whether the bottleneck is in your code or an external library
- How to use Call Count to uncover hidden performance problems
- How to move from “CPU is high” to “I know exactly where to investigate next”
Navigating to the Detailed Views
After your CPU profile finishes collecting and the summary report opens:
Summary Page → click "Open details"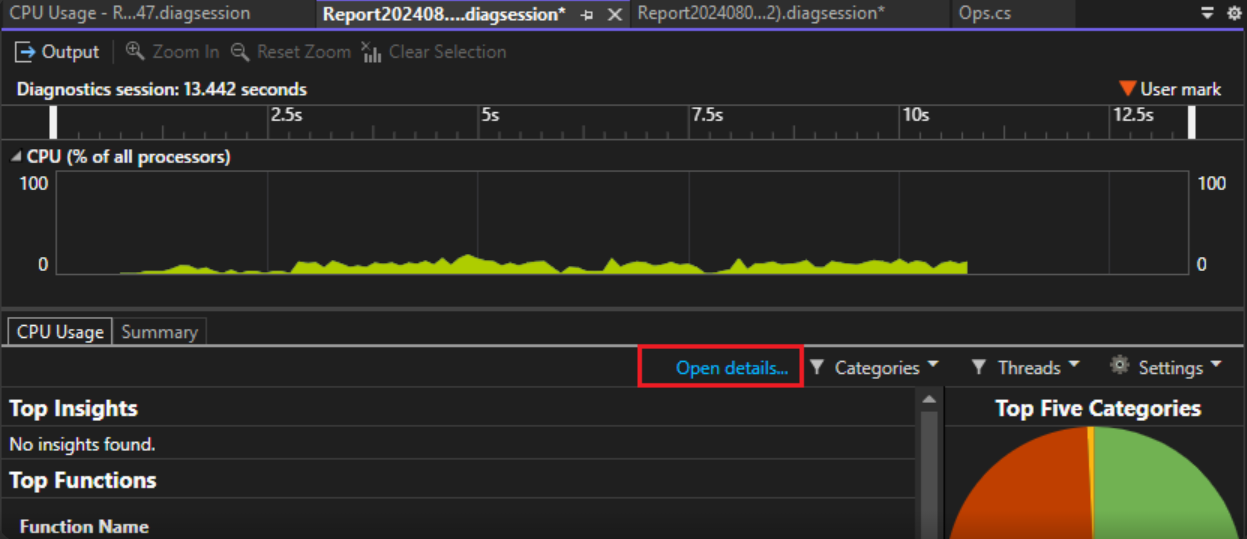
Once inside the detailed report, you’ll see a “Current View” dropdown at the top. This dropdown allows you to switch between all five views provided by the CPU profiler:
image1
Important: Every view except Caller/Callee is sorted by Total CPU in descending order by default.
You can click any column header to re-sort the data, but as a general rule:
Always start with Total CPU sorted from highest to lowest. It immediately surfaces the most expensive code paths.
View 1 — Functions View: Your Starting Point for CPU Investigations
The Functions view is a flat list of every function that ran during your profiling session. No hierarchy — just a ranked table of all methods by CPU cost.
Think of it as a leaderboard. Every method in your app that used any CPU gets a row. The most expensive are at the top.
How to open it
Current View dropdown → select “Functions” (please refer to image1) OR Click any function name on the Summary page → opens Functions view automatically (please refer to image2)
image2
What Does the Functions View Look Like?
A typical Functions view looks something like this:
Function Name              Total CPU    Total CPU%    Self CPU    Self CPU%    Module
─────────────────────────────────────────────────────────────────────────────────────
DeserialisePayload()        3,241ms       54.2%       3,195ms       53.4%    YourApp.dll
ValidateBusinessRules()     1,322ms       22.1%         502ms        8.4%    YourApp.dll
RunRegexValidation()        1,100ms       18.4%       1,100ms       18.4%    YourApp.dll
JsonConvert.Deserialize()   3,100ms       51.8%       3,100ms       51.8%    Newtonsoft.Json.dll
SaveToCache()                 185ms        3.1%         185ms        3.1%    YourApp.dll
Default sort order: sorted by Total CPU% descending. Always start reading from the top row.
Every Column Explained
##Column 1 — Function Name
This column displays the name of the method exactly as it appears in your code.
If “Just My Code” is enabled, you’ll see only the methods from your application. If it’s disabled, the view also includes framework and third-party library methods, giving you a complete picture of where CPU time is being spent.
Pro Tip: Double-click any function name and Visual Studio automatically opens the corresponding source file and highlights the lines responsible for the highest CPU usage.
For beginners, this is one of the most powerful features of the profiler because it takes you directly from profiling data to the code that needs investigation.
##Column 2 — Total CPU [ms]
This column shows the total CPU time consumed by the selected function during the chosen time range, including the time spent executing the function itself and all the methods it calls.
In other words, it represents the end-to-end CPU cost of the function and its entire call hierarchy, making it useful for identifying code paths that consume the most CPU overall.
Think of it this way: If Method A calls Methods B and C, the Total CPU for Method A includes the CPU time spent in Method A plus the time spent executing Methods B and C. This helps you understand the overall cost of invoking that function.
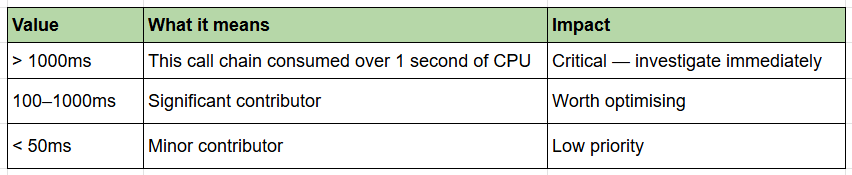
##Column 3 — Total CPU [%]
This column represents the same CPU cost as Total CPU [ms], but expressed as a percentage of the total CPU time captured during the profiling session.
It answers the question:
Out of all the CPU time consumed by the application, how much was spent in this method and everything it called?

##Column 4 — Self CPU [ms] and Self CPU [%]
This column shows the amount of CPU time consumed directly by the selected function during the chosen time range.
- Self CPU [ms] represents the actual CPU time (in milliseconds) spent executing the function’s own code.
- Self CPU [%] indicates the percentage of total CPU time spent in that function.
Importantly, these metrics exclude the time spent in any functions called by the selected function. In other words, they measure only the CPU work performed by the function itself, making them particularly useful for identifying methods that are inherently CPU-intensive.
Think of it this way: If Method A calls Method B and Method C, the Self CPU of Method A includes only the time spent inside Method A’s own code — not the time spent executing Methods B and C. This helps you pinpoint where the CPU is actually being consumed.
The Most Important Concept: Total CPU vs Self CPU
Function                  Total CPU%    Self CPU%    Verdict
─────────────────────────────────────────────────────────────
DeserialisePayload()         54%          53%        🔴 THIS METHOD is the problem
ValidateBusinessRules()      22%           8%        🟡 Method + its children both cost
RunRegexValidation()         18%          18%        🔴 THIS METHOD is doing the heavy work
ProcessOrder()               87%           1%        ✅ Just a container — drill into children
Decision table based on Self CPU %:

##Column 5 — Module
This column shows the DLL or assembly that contains the selected function.
The Module column is particularly useful for determining where the CPU time is being spent. It quickly tells you whether the hotspot is in:
- Your application code (for example,
YourApp.dll) - The .NET Framework (for example,
System.dll) - A third-party library (for example,
Newtonsoft.Json.dll)
Pro tip: If a function has high CPU usage and belongs to an external module, the bottleneck may not be in your code directly. Instead, it could indicate inefficient usage of a framework API or a third-party library that warrants further investigation.
##Call Count Column (Optional — .NET Only)
Hidden by default. This tells you how many times a method was called — and changes the meaning of Self CPU% entirely.
To enable it:
Step 1 → Before starting profiler:
         Click the ⚙️ Settings icon next to CPU Usage
         → Enable "Collect call counts (.NET only)"
         → Start profiling as normal

Step 2 → After report loads, open Functions view:
         Right-click any column header
         → Select "Call count" to make it visible
Why Call Count matters:
Function                Total CPU%    Self CPU%    Call Count
──────────────────────────────────────────────────────────────
ValidateEmail()            18%          18%          1,200,000   🔴 called 1.2 million times
ProcessOrder()             54%          54%                  1   🟡 called once but very slow
At first glance,
*ValidateEmail()* consuming 18% Self CPU doesn't look particularly alarming.
Then you notice the Call Count: 1.2 million.
Suddenly, the problem becomes clear. The method isn’t expensive because it’s slow — it’s expensive because it’s being executed an excessive number of times, perhaps once per character in a string rather than once per field.
Call Count often changes the question from “Why is this method slow?” to “Why is this method being called so many times?”
Two completely different problems revealed:

A Practical Investigation Workflow
Whenever I open the Functions view, I usually follow this sequence:
Step 1 → Sort by Total CPU descending.
Step 2 → Check whether the hotspot is in my code or an external module.
Step 3 → Compare Total CPU and Self CPU.
Step 4 → If Self CPU is low, drill into child methods.
Step 5 → Check Call Count to determine whether the issue is algorithmic or frequency-related.
Step 6 → Double-click the function and inspect the actual code.
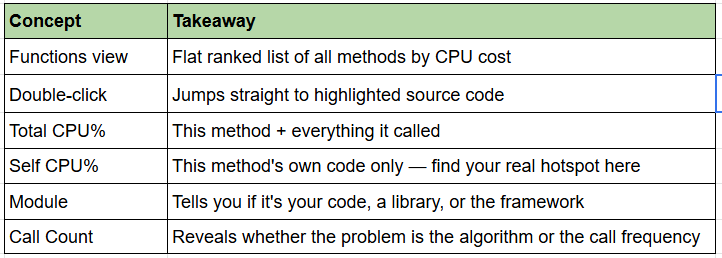
CPU Usage Part 1B.1— Summary
What’s Next?
The Functions view answers an important question:
Which methods consumed the most CPU?
However, knowing that a method is expensive is only half the story.
The next questions are:
- Who called this method?
- Which child methods are actually doing the work?
- Is the CPU cost coming from this method or somewhere underneath it?
That’s where the Caller/Callee View becomes incredibly useful.
In Part 1B.2, we’ll learn how to move from:
“This method is expensive” to “I know exactly who called it and where the CPU time is really being spent.”
Because performance investigations rarely stop at identifying the hotspot.
The real goal is understanding why the hotspot exists.
Series Roadmap
✅ Part 1.1 — Profiling Tools for .NET Performance Engineers
✅ Part 1A — Visual Studio Profiler — CPU Usage: Setup, Configuration, and Collecting Your First Trace
✅ Part 1B.1 — Visual Studio Profiler — CPU Usage: Functions View Deep Dive
⬜ Part 1B.2 — Visual Studio Profiler — CPU Usage: Caller/Callee View Deep Dive
⬜ Part 1B.3 — Visual Studio Profiler — CPU Usage: Call Tree View Deep Dive
⬜ Part 1B.4 — Visual Studio Profiler — CPU Usage: Modules View Deep Dive
⬜ Part 1B.5 — Visual Studio Profiler — CPU Usage: Flame Graph View Deep Dive
메타데이터
- post_id
- 4b021dd4be71
- slug
- part-1b-1-visual-studio-profiler-cpu-usage-4b021dd4be71
- url
- https://medium.com/@satnamgoldi/part-1b-1-visual-studio-profiler-cpu-usage-4b021dd4be71
- canonical_url
- https://medium.com/@satnamgoldi/part-1b-1-visual-studio-profiler-cpu-usage-4b021dd4be71
- author_url
- https://medium.com/@satnamgoldi
- status
- ok
- fetched_at
- 2026-08-04 03:03:18

