How to perform a gross profit analysis
A simple variance shows changes but not their causes. Advanced analysis breaks results into drivers — Volume, Mix, Discount, COGS, Price…
How to perform a gross profit analysis
A simple variance shows changes but not their causes. Advanced analysis breaks results into drivers — Volume, Mix, Discount, COGS, Price, plus new and delisted SKUs — quantifying each impact, but it is more complex. What’s the right choice?
How do you analyze gross profit? What methods can be used?
To run an analysis, you need to compare gross profit across two periods — for example, the current period against a baseline. The baseline could be the previous period, the budget, or the forecast.
The simplest way
The easiest approach is to calculate both the absolute and relative variance of gross profit and its main drivers.
For example, for
GrossProfit = Volume (Price (1 — Discount) — COGS)
To calculate the gross profit variance:
ΔGrossProfit = GrossProfit_actual — GrossProfit_base
%GrossProfit = GrossProfit_actual / GrossProfit_base — 1
And its drivers:
ΔVolume = Volumea_ctual — Volume_base
%Volume = Volume_actual / Volume_base — 1
ΔPrice = Price_actual — Price_base
%Price = Price_actual / Price_base — 1
ΔDiscount = Discount_actual — Discount_base
ΔCOGS = COGS_actual — COGS_base
%COGS = COGS_actual / COGS_base — 1
After the calculation, you can see:

You can see the changes in the metrics, but the size of the impact (effect) of each driver on gross profit is not clear.
So, it’s a simple calculation, but it doesn’t show what actually drove the result.
The best way
Another way is variance analysis.
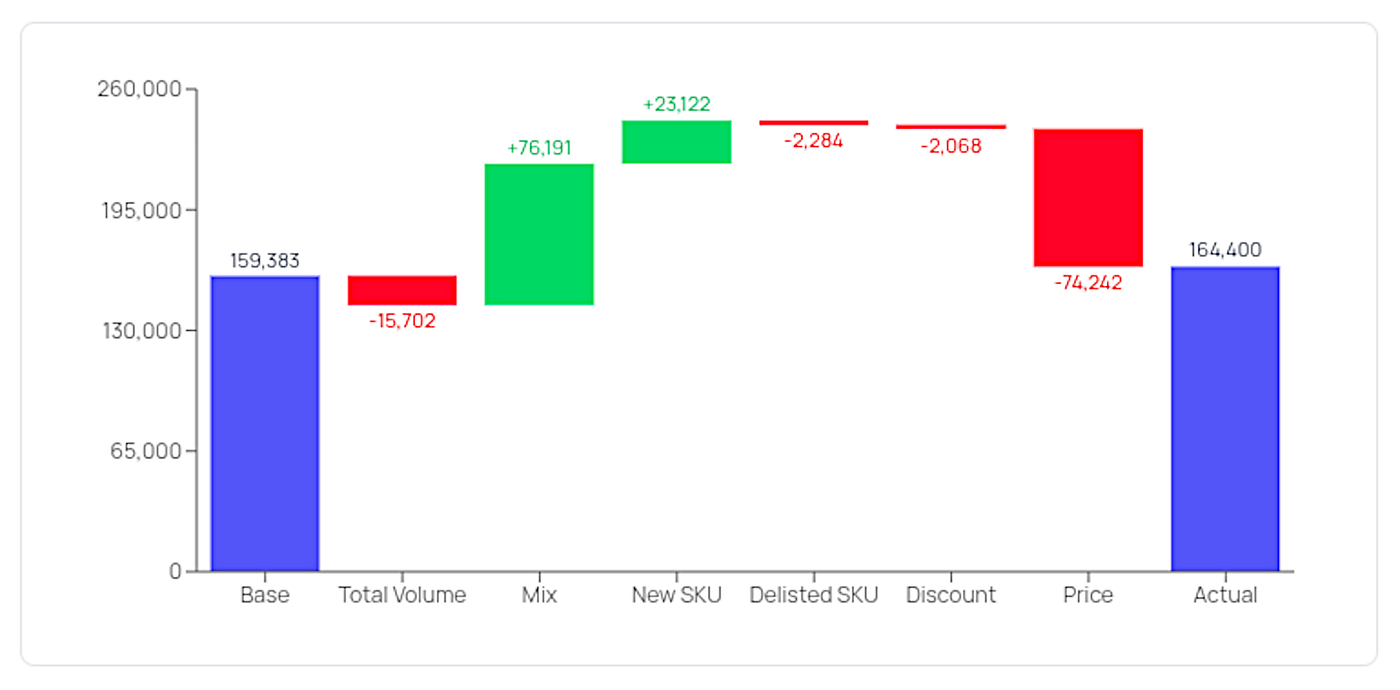
This method is more complex to calculate, but it lets you break down the change in gross profit into separate drivers and quantify the impact of each driver in profit units. This helps you understand why gross profit changed.
In gross profit variance analysis, you can highlight the following drivers: Total Volume, Mix, Discount, COGS, Price. In addition to these, you can also include the impact of new products (NewSKU) and products removed from the assortment (DelistedSKU).
To run the calculation, the following formulas are used:
*TotalVolume = (TotalVolume_actual — TotalVolume_base) %Share_base ((1 — %Discount_base) BasePrice_base — UnitCOGS_base)
*Mix = TotalVolume_actual (%Share_actual — %Share_base) ((1 — %Discount_base) BasePrice_base — UnitCOGS_base)
*Discount = TotalVolume_actual %Share_actual ((1 — %Discount_actual + %Discount_base) BasePrice_base — UnitCOGS_base)
*COGS = TotalVolume_actual %Share_actual ((1 — %Discount_actual) BasePrice_base — UnitCOGS_actual + UnitCOGS_base)
*Price = TotalVolume_actual %Share_actual ((1 — %Discount_actual) (BasePrice_actual — BasePrice_base) — UnitCOGS_actual)
Additional drivers are defined as follows:
NewSKU = if Volume_base = 0 and Volume_actual ≠ 0
then GrossProfit_actual
DelistedSKU = if Volume_base ≠ 0 and Volume_actual = 0
then -GrossProfit_base (negative GrossProfit_base)
The calculation is done for each product, and then the values of the drivers are summed up.
As a result, you get the full picture with the impact of each driver shown in profit units.

This type of analysis can be done with spreadsheets. It requires experience working with them, knowledge of FP&A, and a significant amount of time. But you can easily overcome these challenges by using Fincontrollex’s fully automated Gross Profit Variance Analysis tool: https://www.fincontrollex.com/analyses/gross-profit-variance-analysis
Learn more about performing Gross Profit Variance Analysis here: https://www.fincontrollex.com/blog/how-to-perform-a-gross-profit-analysis
메타데이터
- post_id
- 4bceee1ca15c
- slug
- how-to-perform-a-gross-profit-analysis-4bceee1ca15c
- url
- https://medium.com/fincontrollex/how-to-perform-a-gross-profit-analysis-4bceee1ca15c
- canonical_url
- https://medium.com/fincontrollex/how-to-perform-a-gross-profit-analysis-4bceee1ca15c
- author_url
- https://medium.com/@alex-nazarenko
- status
- ok
- fetched_at
- 2026-06-12 07:40:50