Auto-rollback on Failure: GitHub Actions + AWS ECS Health Checks
Bad deployments should fix themselves. Here’s how to wire health checks, CloudWatch alarms, and automatic rollback into your ECS pipeline.
Auto-rollback on Failure: GitHub Actions + AWS ECS Health Checks
Bad deployments should fix themselves. Here’s how to wire health checks, CloudWatch alarms, and automatic rollback into your ECS pipeline.
PUBLISH METADATA
- Tags: AWS, DevOps, GitHub, Docker, Software Engineering
- Description: How to configure AWS ECS health checks, CloudWatch alarms, and GitHub Actions to automatically detect and roll back failed deployments — so a broken release never stays live for more than 2 minutes.
- Suggested publish date: Week 2 — Thursday
- Suggested cover image: Pipeline diagram with a red alarm triggering a rollback arrow. ECS and GitHub logos. Dark background.
Introduction
You deploy at 6 PM on a Friday. The new container has a startup bug — it boots, passes the first health check, then crashes on the second request.
Without auto-rollback: your site is down until someone notices, logs in, and manually rolls back. That could be hours.
With auto-rollback: ECS detects the failing tasks, triggers a CloudWatch alarm, CodeDeploy rolls back in under 2 minutes. You get a Slack message. Nobody else notices anything.
This guide sets up that exact system.
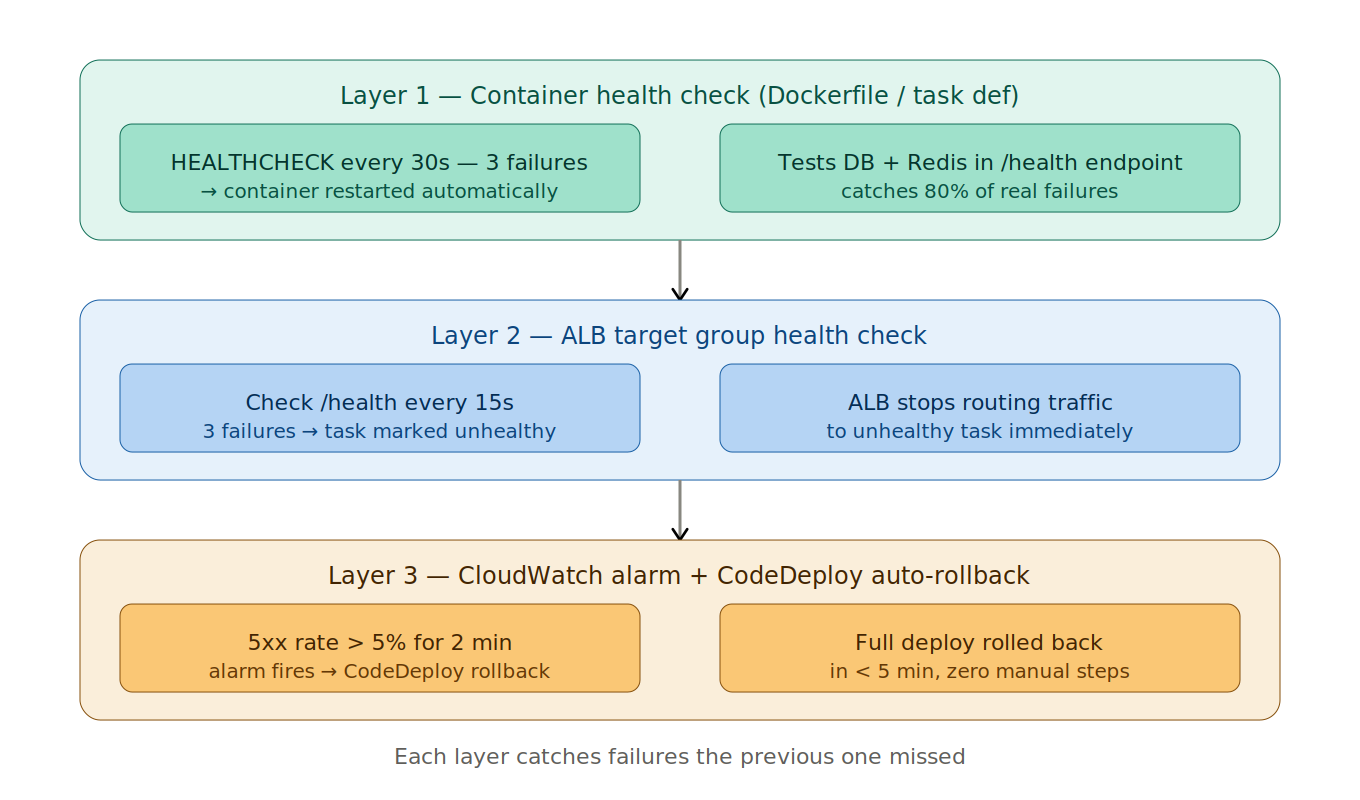
The Three Layers of Protection
Layer 1: Container Health Check (in Dockerfile / Task Definition)
  → Restarts the container if it stops responding
  ↓
Layer 2: ECS Service Health Check (via ALB Target Group)
  → Marks tasks as unhealthy, stops routing traffic
  ↓
Layer 3: CloudWatch Alarm + CodeDeploy Rollback
  → Detects deployment causing errors, rolls back entire deploy
You need all three. Each catches different failure modes.
Layer 1: Container Health Check
In your Dockerfile:
FROM node:20-alpine
WORKDIR /app
COPY package*.json ./
RUN npm ci --only=production
COPY . .
EXPOSE 3000# Health check: hits /health every 30 seconds
# Fails if no response within 10 seconds
# After 3 consecutive failures → container marked unhealthy → restarted
HEALTHCHECK --interval=30s \
--timeout=10s \
--start-period=45s \
--retries=3 \
CMD wget -qO- http://localhost:3000/health || exit 1CMD ["node", "server.js"]And your health endpoint — make it actually test your critical dependencies:
// routes/health.js
const mongoose = require('mongoose');
const redis = require('./redis');
router.get('/health', async (req, res) => {
const checks = {
uptime: process.uptime(),
timestamp: new Date().toISOString(),
status: 'healthy',
version: process.env.APP_VERSION || 'unknown',
checks: {},
}; // Check database
try {
await mongoose.connection.db.command({ ping: 1 });
checks.checks.database = 'ok';
} catch (err) {
checks.checks.database = 'failed';
checks.status = 'degraded';
} // Check Redis (if applicable)
try {
await redis.ping();
checks.checks.redis = 'ok';
} catch (err) {
checks.checks.redis = 'failed';
checks.status = 'degraded';
} const statusCode = checks.status === 'healthy' ? 200 : 503;
res.status(statusCode).json(checks);
});Critical: A health check that only returns
{ status: 'ok' }without testing dependencies catches maybe 30% of real failures. Test your actual critical paths.
Layer 2: ECS Task Definition Health Check
Even if your Dockerfile has a health check, also define it in the task definition. ECS uses this to determine when a task is ready to serve traffic:
{
  "containerDefinitions": [
    {
      "name": "your-app",
      "image": "123456789.dkr.ecr.ap-south-1.amazonaws.com/your-app:latest",
      "healthCheck": {
        "command": ["CMD-SHELL", "wget -qO- http://localhost:3000/health || exit 1"],
        "interval": 30,
        "timeout": 10,
        "retries": 3,
        "startPeriod": 60
      },
      "portMappings": [{ "containerPort": 3000 }]
    }
  ]
}
startPeriod explained: This is the grace period after container start before health checks count. Set this to slightly longer than your app's startup time. Node.js apps typically need 15–45 seconds. If your app connects to databases on startup, add those connection times.
Layer 2B: ALB Target Group Health Check
Configure the ALB target group to be strict about what it considers healthy:
aws elbv2 modify-target-group \
  --target-group-arn arn:aws:elasticloadbalancing:... \
  --health-check-protocol HTTP \
  --health-check-path /health \
  --health-check-interval-seconds 15 \
  --health-check-timeout-seconds 5 \
  --healthy-threshold-count 2 \
  --unhealthy-threshold-count 3 \
  --matcher HttpCode=200
With these settings:
- Checks every 15 seconds
- 2 consecutive successes → healthy (routes traffic)
- 3 consecutive failures → unhealthy (stops routing traffic)
Layer 3: CloudWatch Alarms for Deployment Failures
Create alarms that trigger on the patterns a bad deployment causes:
# Alarm 1: 5xx error rate > 5% over 2 minutes
aws cloudwatch put-metric-alarm \
  --alarm-name "your-app-5xx-rate-high" \
  --metric-name "HTTPCode_Target_5XX_Count" \
  --namespace "AWS/ApplicationELB" \
  --dimensions Name=LoadBalancer,Value=your-alb-arn-suffix \
               Name=TargetGroup,Value=your-tg-arn-suffix \
  --statistic Sum \
  --period 60 \
  --threshold 10 \
  --comparison-operator GreaterThanThreshold \
  --evaluation-periods 2 \
  --alarm-actions arn:aws:sns:ap-south-1:123456789:deployment-alerts \
  --treat-missing-data notBreaching
# Alarm 2: Response time > 3 seconds (P95)
aws cloudwatch put-metric-alarm \
--alarm-name "your-app-latency-high" \
--metric-name "TargetResponseTime" \
--namespace "AWS/ApplicationELB" \
--dimensions Name=LoadBalancer,Value=your-alb-arn-suffix \
--extended-statistic p95 \
--period 60 \
--threshold 3.0 \
--comparison-operator GreaterThanThreshold \
--evaluation-periods 2# Alarm 3: Unhealthy host count > 0
aws cloudwatch put-metric-alarm \
--alarm-name "your-app-unhealthy-hosts" \
--metric-name "UnHealthyHostCount" \
--namespace "AWS/ApplicationELB" \
--dimensions Name=TargetGroup,Value=your-tg-arn-suffix \
Name=LoadBalancer,Value=your-alb-arn-suffix \
--statistic Average \
--period 60 \
--threshold 0 \
--comparison-operator GreaterThanThreshold \
--evaluation-periods 1Wire Alarms to CodeDeploy Auto-Rollback
aws deploy update-deployment-group \
  --application-name your-app-deploy \
  --deployment-group-name production \
  --alarm-configuration "
    enabled=true,
    alarms=[
      {name=your-app-5xx-rate-high},
      {name=your-app-latency-high},
      {name=your-app-unhealthy-hosts}
    ]
  " \
  --auto-rollback-configuration "
    enabled=true,
    events=[DEPLOYMENT_FAILURE,DEPLOYMENT_STOP_ON_ALARM]
  "
Now if any alarm fires during a deployment, CodeDeploy stops the deploy and rolls back to the previous task definition version automatically.
GitHub Actions: Detect Rollback and Notify
Add this to your GitHub Actions deploy job to catch when a deployment was rolled back:
- name: Check deployment outcome
        if: always()
        run: |
          DEPLOY_STATUS=$(aws deploy get-deployment \
            --deployment-id ${{ steps.deploy.outputs.deployment-id }} \
            --query 'deploymentInfo.status' \
            --output text)
echo "Deployment status: $DEPLOY_STATUS" if [ "$DEPLOY_STATUS" == "Failed" ]; then
echo "DEPLOY_FAILED=true" >> $GITHUB_ENV
fi - name: Notify Slack — deployment rolled back
if: env.DEPLOY_FAILED == 'true'
uses: slackapi/slack-github-action@v1.26.0
with:
payload: |
{
"text": "🔄 *Auto-rollback triggered*\nDeployment failed health checks and was automatically rolled back.\n*Commit:* `${{ github.sha }}`\n*Author:* ${{ github.actor }}\n*Check:* ${{ github.server_url }}/${{ github.repository }}/actions/runs/${{ github.run_id }}"
}
env:
SLACK_WEBHOOK_URL: ${{ secrets.SLACK_WEBHOOK_URL }}
SLACK_WEBHOOK_TYPE: INCOMING_WEBHOOKTesting Your Rollback Setup
Before trusting this in production, test it deliberately:
// Add this to a test branch temporarily
app.get('/health', (req, res) => {
  // Simulate a failing health check after 60 seconds
  if (process.uptime() > 60) {
    return res.status(503).json({ status: 'failing' });
  }
  res.json({ status: 'healthy' });
});
Deploy this to staging. You should see:
- Tasks start, pass initial health check
- After 60s, health checks fail
- ALB stops routing traffic to unhealthy tasks
- CloudWatch alarm fires
- CodeDeploy rolls back (if wired to a deployment)
- Slack notification sent
If all 5 things happen, your rollback system works.
Rollback Timeline
With this setup, here’s what happens during a bad deploy:
T+0s   — New tasks start (ECS rolling / CodeDeploy green)
T+45s  — startPeriod ends, health checks begin
T+90s  — First health check failure recorded
T+120s — 3 consecutive failures → task marked unhealthy
T+135s — ALB stops routing to unhealthy tasks
T+180s — UnHealthyHostCount alarm fires (60s evaluation)
T+200s — CodeDeploy stops deployment, begins rollback
T+260s — Previous (blue) tasks fully active
T+300s — Rollback complete. Slack notification sent.
5 minutes from bad deploy to full recovery. Zero manual intervention.
Conclusion
Production reliability isn’t about never having bad deploys. It’s about how fast you recover from them.
With health checks at every layer and auto-rollback wired to real metrics, bad deployments become a minor inconvenience instead of a crisis. Set this up once, and you’ll never again spend an evening manually rolling back a deployment.
#AWS #DevOps #ECS #GitHubActions #HealthChecks #AutoRollback #CloudWatch #CICD #Reliability #SRE
I’m a Full-Stack Developer specializing in React, Next.js, and Node.js. 👉 Connect with me: https://www.linkedin.com/in/chiragmehta900/
메타데이터
- post_id
- 4d60004e06b1
- slug
- auto-rollback-on-failure-github-actions-aws-ecs-health-checks-4d60004e06b1
- url
- https://medium.com/@chiragmehta900/auto-rollback-on-failure-github-actions-aws-ecs-health-checks-4d60004e06b1
- canonical_url
- https://medium.com/@chiragmehta900/auto-rollback-on-failure-github-actions-aws-ecs-health-checks-4d60004e06b1
- author_url
- https://medium.com/@chiragmehta900
- status
- ok
- fetched_at
- 2026-07-11 16:08:17