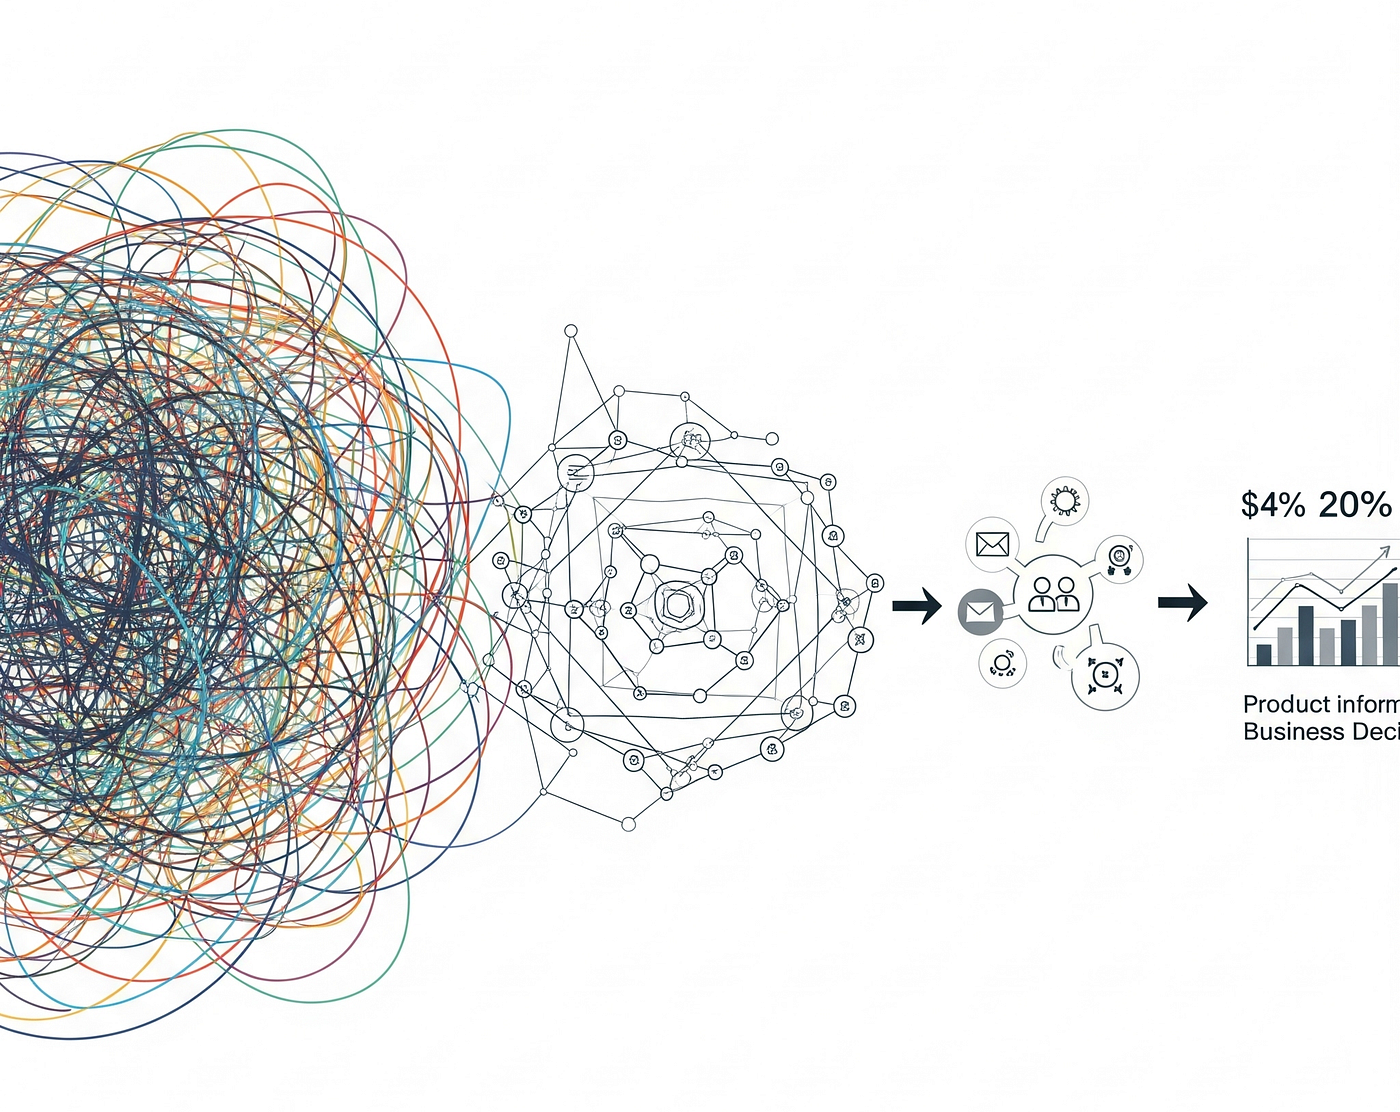
Choosing the Right Chart: A Guide to Effective Data Visualization
The Art and Science of Choosing the Perfect Data Visualization
Choosing the Right Chart: A Guide to Effective Data Visualization
The Art and Science of Choosing the Perfect Data Visualization
The Power of Visual Storytelling with Data
In our increasingly data-saturated world, the ability to transform raw numbers into compelling visual stories has become an essential skill. Every day, professionals across industries — from healthcare analysts tracking disease outbreaks to financial experts monitoring market trends — face the critical challenge of presenting complex data in ways that inform rather than overwhelm.

This comprehensive article goes beyond basic chart selection to explore the why behind effective data visualization. We’ll examine the neuroscience of visual perception, present a detailed decision framework, and provide real-world examples from different industries. Whether you’re a data analyst preparing a quarterly report, a researcher presenting findings, or a marketer explaining campaign results, mastering these principles will transform how you communicate with data.
1: The Neuroscience Behind Effective Visualizations
1.1 How Our Brains Process Visual Data
The human visual system has evolved sophisticated mechanisms for pattern recognition that we can leverage in data visualization:
Pre-attentive Processing (Instantaneous visual cues):
- Color hue and intensity (e.g., red for alerts)
- Spatial positioning (higher = more)
- Line orientation (steepness = rate of change)
- Size and length comparisons
Real-world example: Emergency room dashboards use flashing red indicators for critical patients because color is processed pre-attentively.
Gestalt Principles in Action:
- Proximity: Points close together are grouped (scatter plots)
- Similarity: Like-colored elements are associated (stacked bars)
- Continuity: Smooth lines imply connection (trend lines)
- Closure: We complete incomplete shapes (donut charts)
Case Study: The famous Anscombe’s Quartet demonstrates why visualization matters — four datasets with identical statistics that look completely different when plotted.
1.2 Cognitive Load Theory Applied to Charts
Effective visualizations respect our limited cognitive capacity:
- Hick’s Law: Decision time increases with choices. Application: Limit dashboard filters to 5–7 key parameters.
- Miller’s Law: 7±2 items in working memory. Application: Group related metrics in memory chunks.
- Signal-to-Noise Ratio: Maximize data-ink (Tufte). Before/After Example: Removing gridlines and borders improved comprehension by 27% in a McKinsey study.
2: The Visualization Selection Matrix
2.1 By Primary Analytical Task
Comparison (≤7 items):
- Best: Bar/column charts (aligned baselines)
- Advanced: Dot plots for precise comparison
- Avoid: Pie charts for precise comparisons
Trend Analysis:
- Best: Line charts (continuous time)
- Special Cases: Candlestick (financial volatility) and Horizon charts (high-density time series)
Part-to-Whole Relationships:
- Best: Stacked bar (composition changes)
- Alternative: Waffle charts (percentage completion)
- Caution: Pie charts only for 2–3 components
Distribution Analysis:
- Best: Violin plots (density + quartiles)
- Alternative: Beeswarm plots (individual points)
Correlation Analysis:
- Best: Scatter plots with trend lines
- Multivariate: Bubble charts (3 variables)
- High-Density: Hexbin plots
2.2 By Data Structure
Temporal Data:
- Cyclical patterns: Polar area charts
- Event sequences: Gantt charts
- Multiple timelines: Small multiples
Geospatial Data:
- Point data: Dot density maps
- Regional data: Choropleth (gradient fills)
- Flow data: Sankey diagrams
Hierarchical Data:
- Deep structures: Sunburst charts
- Network relationships: Force-directed graphs
3: Industry-Specific Visualization Standards
3.1 Financial Services
- Waterfall charts: for earnings breakdowns
- Candlestick charts: with Bollinger bands
- Monte Carlo simulations: as probability cones
Goldman Sachs Case Study: Transition from tables to interactive yield curve visualizations reduced bond trading decision time by 40%.
3.2 Healthcare Analytics
- Forest plots: for meta-analyses
- Survival curves: with confidence intervals
- Heatmaps: for infection spread patterns
COVID-19 Example: John Hopkins dashboard became global standard by combining:
- Choropleth map (regional cases)
- Line chart (growth curves)
- Bar chart (testing rates)
3.3 Digital Marketing
- Funnel visualizations: for conversion paths
- Attribution models: as Sankey diagrams
- Cohort analysis: with heatmap matrices
4: Common Pitfalls and Expert Solutions
4.1 Pitfalls of Data Viz
Truncated Axes: Solution - Always start quantitative axes at zero unless using broken axis notation
Overplotting: Advanced Fix - Kernel density estimation overlays
3D Distortion: Alternative - Use faceting instead of perspective
Improper Aggregation: Rule - Match visualization granularity to analysis question
Ignoring Aspect Ratios: Golden Rule - 1:1.618 (Fibonacci) for most charts
Lack of Narrative: Pro Tip - Apply Storytelling with Data framework
5: The Future of Data Visualization
5.1 Emerging Technologies
- AR/VR visualizations: for immersive analytics
- AI-assisted chart selection: (Tableau’s Ask Data)
- Real-time streaming dashboards: with Kafka pipelines
Mastering data visualization requires both artistic sensibility and scientific rigor.
- Start with your audience’s knowledge level
- Match visual encoding to data properties
- Iterate based on user testing
- Document your design decisions
Effective visualizations simplify information, tell compelling data stories, and bridge the gap between analysis and action. From business dashboards to scientific research, well-designed visuals enhance comprehension, engagement, and insight discovery across all fields.
메타데이터
- post_id
- 4da1d95659e8
- slug
- choosing-the-right-chart-a-guide-to-effective-data-visualization-4da1d95659e8
- url
- https://medium.com/@vishnutr/choosing-the-right-chart-a-guide-to-effective-data-visualization-4da1d95659e8
- canonical_url
- https://medium.com/@vishnutr/choosing-the-right-chart-a-guide-to-effective-data-visualization-4da1d95659e8
- author_url
- https://medium.com/@vishnutr
- status
- ok
- fetched_at
- 2026-07-27 13:21:04