[Fintokei Complete Strategy Bible] Everything about next-generation trading strategies built around…
Disclaimer based on the Premiums and Representations Act: Links on this blog may contain advertisements.
[Fintokei Complete Strategy Bible] Everything about next-generation trading strategies built around VWAP
Disclaimer based on the Premiums and Representations Act: Links on this blog may contain advertisements.
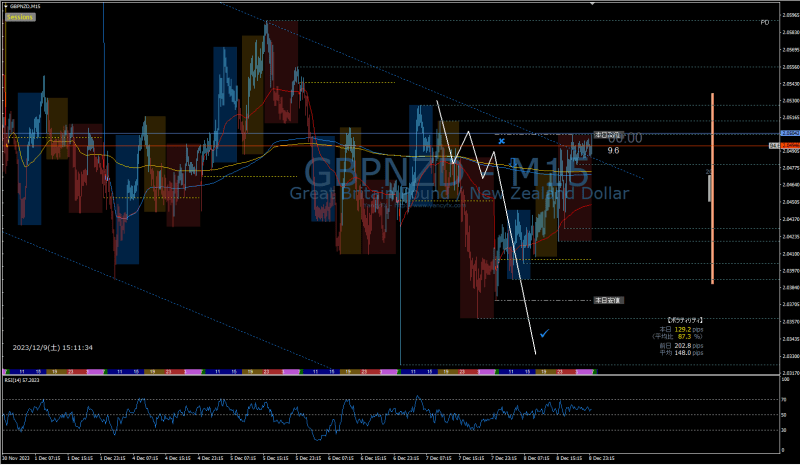
[Fintokei Strategy Research] VWAP + RSI + BB + Patterns + Scenario Construction + Stop Loss + Lucky Take-Profit + Entry Price Settlement
“The Fintokei challenge is too difficult… How can I pass it?”
“I want to know the specific methods and trading strategies of those who have passed!”
“I’m using VWAP and RSI, but how can I use them to conquer Fintokei?”
“I was disqualified because I was late in cutting my losses… I took profits too early and couldn’t reach my target…”
Fintokei is an attractive prop trading firm that offers the potential to receive up to 500 million yen in funding . However, the pass rate for its challenge (exam) is not high, and many traders struggle to balance profit targets and drawdown rules. Are you struggling to see results even after trying common methods?
This article is your “Fintokei Complete Strategy Bible.” Daito, the site administrator, will generously share all the specific strategies and thought processes he has tested and continuously refined in actual Fintokei (demo and competitions)!
You can also read articles about their achievements, such as how they increased their tournaments and funding tenfold, so please check them out.
- [Proof of Achievement] My Complete Strategy for Achieving 61st Place (Top 2.3%) Out of 2587 Participants in the Fintokei Contest
- [Highly Reproducible] Latest Method: Master Ranges and Trends with Price Action + Chart Patterns + Bollinger Bands! [Images of turning 1 million yen into 10 million yen revealed]
This article addresses keywords such as “ Fintokei strategy ,” “ Fintokei method ,” and “ prop trader method ,” thoroughly explaining my personal market analysis and entry strategy combining “VWAP x RSI x BB x pattern analysis,” as well as my unique practical methods for maximizing profits and minimizing losses , including “scenario building,” “second stop-loss,” “lucky profit-taking,” and “break-even settlement,” all illustrated with numerous real-world chart examples (images) . Furthermore, it covers everything you need to succeed in mastering Fintokei, from the importance of analyzing on 15-minute charts or longer, to concrete improvement measures learned from past failures .
This article will give you the “Fintokei breakthrough power”

You can find more information about Fintokei here.
- This will help you understand the specific strategies and mindset needed to pass the Fintokei Challenge.
- You can learn a highly reproducible environmental recognition and entry method that combines VWAP (including Anchored VWAP) with RSI & BB.
- This book explains specific methods for minimizing losses with “second-by-second stop-loss” and maximizing profits with “lucky-based profit-taking” and “exchange-price settlement.”
- This will clarify why analyzing charts of 15 minutes or longer is essential for mastering Fintokei.
- You can gain practical lessons from the operator’s real trading record (wins and losses) and stories of failures.
- You’ll get tips on how to build and improve your rules to suit your trading style.
Disclaimer: The methods described here are based on the personal research and practice of operator daito and do not guarantee profits. Fintokei’s rules are subject to change, and trading always involves risk. Always make your own decisions and take action at your own risk.
Start your journey to becoming a prop trader with Fintokei!

Up to 500 million yen in funding is available, and you can earn 80% of the profits as rewards!
There are also opportunities to test your skills risk-free in regular free trading competitions.
>> Check details and register for free on the Fintokei official website
(Reference: Click here for Fintokei reviews and testimonials / Fintokei Getting Started Guide )
Why are “unique rules” essential for conquering Fintokei? [The Barrier to Passing]

Fintokei’s challenge requires more than just good trading skills. It demands consistent performance under specific constraints, such as achieving profit targets while adhering to strict drawdown rules (daily loss rate, maximum loss rate) . The rumored single-digit pass rate speaks volumes about its difficulty.
Using conventional textbook methods or trading based on intuition makes it extremely difficult to achieve profit targets while adhering to these rules. That’s why understanding Fintokei’s rules and market characteristics, building your own “reproducible, unique rules,” and strictly adhering to them is the only way to pass.
(Reference: Detailed explanation of Fintokei rules / Consideration of methods for passing the Prop Trader exam )
[Daito’s Fintokei Strategy] Core Technology: VWAP x RSI x BB x Pattern Analysis

My approach to Fintokei (and daily trading) revolves around an analysis that combines the following four elements:
[Fintokei Strategy Study] Strategy: VWAP + RSI + Pattern
It is effective in trending markets, but you can also trade in range-bound markets.
In the case of a range-bound market, draw a trend line on the RSI, and enter a trade when the price breaks through the trend line and then through the 70 or 30 line.
*This assumes that the VWAP is either flat or does not continue its trend.
If a trend develops or a pattern is broken, be prepared for it to change to a trend. If it’s in the direction of the trend, don’t take profits at the upper limit of the range, let it run. If it’s in the opposite direction of the trend, cut your losses and reverse your position.
This process was based on the principles of the Iglock method.

created by Rinker
¥4,180 (As of 2026/05/06 10:48:36, according to Rakuten Market — details)
**I was basically thinking that a blog would suffice, but I personally found this book useful, so I recommend it . **I’ve bought two copies.***
① Axis for environmental analysis: Determining trends/ranges using Anchored VWAP (fixed VWAP).
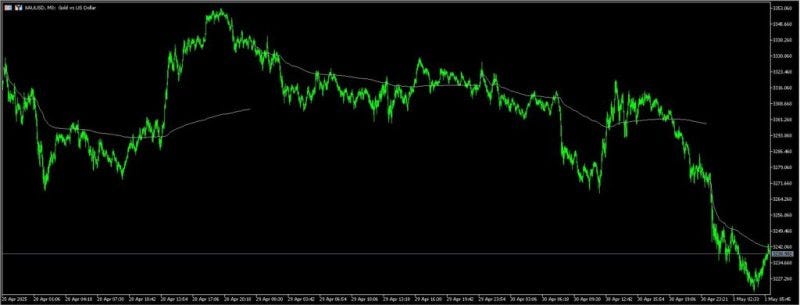
Volume-weighted average price (VWAP) suggests the average cost of market participants and functions as an indicator of trend direction, strength, and support/resistance levels. In particular, anchored VWAP (fixed VWAP) , calculated from a specific starting point (e.g., significant highs/lows, market opening time), is very effective in capturing market sentiment over a given period.
- If the VWAP is trending upwards, it indicates an upward trend; if it’s trending downwards, it indicates a downward trend; and if it’s flat, it indicates a range-bound market.
- Display the VWAP for multiple time periods to see the short-term and medium-term trends.
- Check where the price is relative to the VWAP (above indicates a buying advantage, below indicates a selling advantage).

Personally recommended
② Supporting entry rationale: Channel line and major pattern analysis
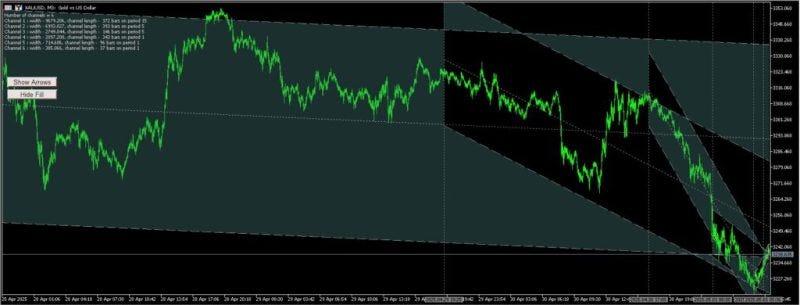
After grasping the overall trend using VWAP, we combine it with chart patterns such as channel lines , harmonic patterns , head and shoulders, and double tops/bottoms , as well as important horizontal lines (support and resistance) to narrow down specific entry candidate areas. Areas where these lines and patterns overlap with VWAP have the potential to be particularly strong resistance zones.
Recently, I developed my own channel line and an indicator that uses a unique logic to find resistors.

[MT5 Indicator] ArcaneChannels: The ultimate channel drawing tool for visualizing market structure
This line works well with round numbers. It can be difficult at first, but once you get used to it, it’s quite useful. Combining it with round numbers makes it easier to visually confirm resistance from the masses, making it very valuable.
It should be very useful for advanced players because it can detect subtle resistance and neckline resistance that you might otherwise miss.
For beginners, this very first line can be difficult to determine or prone to errors, so practice is necessary. Therefore, using only the round number is a more reliable and recommended approach.
Furthermore, we developed an indicator that automatically detects chart patterns.

This indicator implements the functionality to draw chart patterns, trend lines, and parallel lines for each timeframe. It also identifies breakouts and range touches. You can check breakouts, chart patterns, and price action for each timeframe all with this indicator.
As various patterns are hidden within the market, it is necessary to constantly analyze carefully to avoid overlooking anything.
I’ve added a feature that automatically draws Fibonacci retracements and also displays the time axis automatically, making current strong resistance levels immediately clear. *I created this myself because no one else had developed anything like this.
Since scalping and similar trading strategies rely on split-second decisions that can be fatal, I created this tool to streamline my analysis process.
Furthermore, since chart patterns alone cannot visualize the overall trend or the probability of entry, I use VWAP (Volume Weighted Average Price) to cover that aspect. I also created this myself. (Using a VWAP publicly available online is also fine.)

Homemade indicators for VWAP and Bollinger Bands
The areas highlighted in red indicate that many people entered trades during a downtrend.
I’ve made it so that the color changes based on the VWAP value and this is reflected in the Bollinger Bands.
This makes it immediately clear that downward (selling, short) entries have a high probability of success, and even in a range-bound market, it’s possible to profit by using Bollinger Bands lines and the chart patterns mentioned earlier for counter-trend trading.

I created an indicator that visualizes time-based anomalies.
Thus, changing your strategy depending on the time of day can significantly increase your advantage. However, this advantage isn’t always guaranteed, as breakouts can occur during range-bound periods, and range-bound periods can occur during breakout periods.
These principles involve a combination of factors, such as the range duration at the breakout phase of a chart pattern, the possibility that the breakout has already been exhausted somewhere, or that the chart pattern (market condition) lacks sufficient justification for a breakout.
While economic indicators and other factors can be contributing, the best approach is to analyze market sentiment using chart patterns.
This method is reproducible and avoids being swayed by uncertain factors, so I recommend it.

For more information on developing indicators and EAs like these, please see this article: [EA Development: Extremely Difficult] Real-World Strategy Notes for Range Trading [Latest Trading Methods and Examples Published] 1 Million Yen → 10 Million Yen [EA Development Diary Vol. 1]
③ Precision timing instrument: How to utilize RSI

The RSI is an oscillator that indicates overbought and oversold conditions, but by using it strategically, you can improve the accuracy of your entry timing.
- Range-bound market: RSI above 70 indicates oversold conditions, and below 30 indicates overbought conditions, serving as a counter-trend trading signal. You can also add a trend line to the RSI and use its breakout as an entry criterion.
- Trend Market: Use the 50 line as a guideline for trend continuation or reversal. In an uptrend, look for pullbacks around the 50 line; in a downtrend, look for retracements around the 50 line. Also pay attention to divergences.
We analyze these factors in combination and consider entering a trade only at “highly advantageous points where multiple pieces of evidence overlap.”
④ Precision Timing Instruments: How to Use Bollinger Bands
Let me introduce some real-world examples.

The superiority of chart patterns

How to use Bollinger Bands
I also made these Bollinger Bands myself.
[Daito’s Fintokei Practical Method] Techniques for Maximizing Profits and Minimizing Risk

Even the best analysis is meaningless if it cannot be put into practice. These are the practical methods and ways of thinking that I particularly emphasize in the Fintokei Challenge and actual trading.
1. Scenario Construction: Creating a “Map” Before Entry
Before entering a trade, always consider multiple price movement scenarios (at least two, such as a rebound and a breakout), and plan specifically how to respond to each scenario (profit-taking points, stop-loss points, reversal decisions, etc.) . This will eliminate hesitation and serve as a “map” for making calm decisions.
Please consider this as one idea.
[MT5 Indicator] ArcaneChannels: The ultimate channel drawing tool for visualizing market structure
2. Stop-loss in seconds: Immediately cut off any “unexpected” situations (from tens of seconds to a few minutes, according to the prop brokerage or regulations).
Personally, I believe the most important skill in trading is the speed of cutting losses . The moment I determine that the scenario or pattern I used as the basis for my entry has broken down, I execute a stop-loss within seconds . Hoping that it might recover only increases losses. Minimizing losses is the secret to consistently winning in the long run.
Reluctantly, but assuming the analysis is correct, there is a desperate measure that might save you, so I’m posting this just in case.
3. Take profits (leave profits to market fluctuations): Let profits grow by letting the market decide.
While I can control my stop-loss orders, no one can predict how far profits will go. Therefore, I accept that profit-taking is largely a matter of luck . Until a clear reversal signal appears, or until a predetermined target (risk-reward ratio or important resistance level) is reached, I try to maximize profits by using strategies such as closing at the entry price . I don’t take profits too early.
This article explains in detail how to decide when to take profits. The choice between an Assassin and a Revolutionary Swordsman is when you decide to take profits. **The profit-taking crossroads — 90% ‘Reality’ and 10% ‘Revolution’.**
4. Settle at entry price: Pursue profit with zero risk
After entering a trade, once the unrealized profit reaches a certain level (e.g., roughly the same as the stop-loss level), move the stop-loss to the entry price (break-even point) . This ensures that the trade will at least break even, meaning it’s a “no-loss trade.” From there, you can focus on letting your profits run freely. Even if the trade is closed at the break-even point and your profit is zero, you haven’t incurred a loss, so you can try again risk-free as many times as you like.
In addition to risk-reward strategies, you can also mitigate risks by adjusting lot size management, so please refer to this article.
Practical Chart Example (Explanation corresponding to the screenshot image)

[Example of a winning trade: 15-minute channel breakout]
(Explanation: The price broke above the 15-minute channel line. The VWAP was also trending upwards, suggesting a trend was developing. The RSI remained above 50. This is an example of entering a trade on a small pullback after the breakout and extending the profit to the next resistance level.)
While repeating this method will lower your win rate, it’s a way to make a substantial profit.
The win rate is about 40%, but it’s a method that allows profits to accumulate.
This is the analysis method I’ve been using the most recently.
Win: 30 + 10 pips = 40 pips

Entered trade on a 15-minute channel line breakout; the breakout continued.
[Example of a losing trade: False breakout on the 4-hour chart]
(Explanation: I entered a buy position because the price appeared to have broken the downtrend line on the 4-hour chart. However, this was a false breakout, and there was no clear price action indicating an upward reversal on the 15-minute chart. I immediately exited the position at -4 pips based on my stop-loss rule.)
Loss: 4 pips

4-hour trendline breakout (the faint yellow dotted trendline is the line on the 4-hour chart) 4-hour breakout false signal + 15-minute breakout genuine signal
- Environmental Awareness: VWAP (Confirm whether the current advantage is in a trend or range)
- Entry rationale: Channel lines (emphasizing resistance that is most likely to be confirmed by public psychology)
- *Entry timing: RSI (check for 70 and 30 in range-bound conditions, and around 50 in trending conditions) This can be further reinforced with Bollinger Bands (BB) as a basis.**
*Other entry criteria include triangle patterns, head and shoulders patterns, and diamond patterns, and we also confirm entry criteria in the form of trendline and support/resistance breakouts.

It’s the second day.
Actually, on that day I thought I could win if I used the same analysis for both 1-minute and 5-minute trades, but I lost almost everything.
So, all my profits were zero, but then I suddenly broke through a big wave, and by following the trend, I turned a profit.
As a bonus, I’ll explain a way to gain a small profit with a quick, large movement.

I gained a small profit using a trailing stop.

The same thing happened with the trailing stop. The breakout happened earlier than I had anticipated, so I jumped in hastily.

Since the cross-shaped circles mentioned above looked similar, I jumped on all of them.
Thus, when a clear trend is broken, and a trend break occurs at a major pullback or resistance level, the price tends to rise significantly when various supporting factors align.
See the reference video here.
However, the market isn’t always as simple as the situation described above, so I’ll elaborate a bit below.
It’s quite common for a short-term breakout to simply be a pullback on higher timeframes, so following the subsequent direction might be a bit of a lack of analysis.
If you draw Fibonacci retracements from a broader perspective, some are simply retracements, so it’s best to wait until the outcome of that retracement is determined before following the subsequent retracements.


Trading on the 3rd day
The pass rate is probably around 8%, so it seems you need to reach 100% from 22% to pass.
Since it seems they are not participating in the tournament, I feel there is no point in continuing, so I will end it here.
There are also articles about my experience participating in the competition, so please refer to them.
[Most Important] Time Zone Strategy and MTF Analysis for Conquering Fintokei

When it comes to trading on Fintokei, knowing which timeframe to look at and when to trade is extremely important.
Why is analysis using 15-minute charts or longer essential? [The pitfalls of 1-minute and 5-minute charts]

Based on my own past failures, I can confidently say that trading based solely on 1-minute or 5-minute charts will almost certainly lead to failure in the Fintokei Challenge. This is because,
- Short-term charts are prone to a lot of noise (false signals), making them unreliable for determining trend direction and identifying support/resistance lines.
- It is heavily affected by spreads and fees, making it difficult to profit from even small price fluctuations.
- They are easily swayed by short-term fluctuations and prone to emotional trading.
As the screenshot example shows, what looks like a bearish signal on a 5-minute chart might actually be just a pullback within an uptrend when viewed on a 15-minute chart — this happens all the time. Always analyze the market environment using a 15-minute chart or longer, and base your trading strategy on that ; this is the first step to consistent results.
Time zones to trade and time zones to avoid (Daito’s routine)
Markets have periods of high activity and periods of low activity. Be mindful of these times to avoid unnecessary entries and efficiently aim for profits.
- Time slots when trends are likely to emerge (ideal times to target): Tokyo morning (9–11 am), London opening (3–6 pm), New York morning (9 pm-12 am), etc.
- Time periods when range-bound trading is likely (counter-trend trading or waiting): Time periods other than those mentioned above.
I primarily focus on London time, and dedicate the rest of my time to scenario building, analysis, and rest.
Evidence reinforcement through multi-timeframe analysis (MTF)
Even if an entry signal appears on the 15-minute chart, always check the situation on higher timeframes (1-hour, 4-hour, and daily charts). Does it align with the trend direction on the higher timeframe? Is it approaching a significant resistance level on the higher timeframe? The more evidence that aligns across multiple timeframes, the higher the probability of a successful trade.

This is a scenario I constructed assuming there was no price movement from the point where the white line begins.

You can either create two scenarios like this, or create a new scenario when one scenario becomes invalid.
It’s a hassle, but ever since I started doing this, I’ve really been able to win.
Furthermore, I believe that the key to consistently winning is the speed at which you cut your losses.
Personally, I think a few seconds is ideal for cutting losses.
Profit-taking is basically unpredictable; you follow the trend if the price rises, and take profits if the market doesn’t.
Taking profits is a matter of luck.
However, you can control your stop-loss orders yourself.
The key is to minimize that loss as much as possible.
While this rule is difficult to follow, applying it to the market limits the number of entry points to just one.
That’s a pullback following a trend reversal according to Dow Theory.
In other words, you enter a trade when the expected pullback occurs, and cut your losses the moment the expected pullback pattern breaks down.
This is my answer, and it’s the secret to winning.
In the case of the winning trades I explained in the first half, if the price reaches the “X” section, I can no longer judge it as a pullback, so I personally cut my losses.

From a broader perspective, I judged that this kind of resistance could be overcome.
If this judgment is wrong, wait for a pullback after breaking above the green resistance. Then, enter a higher position after confirming that a large candlestick has formed, indicating that many traders have entered the market.
In short, if you’re going to use limit orders without minimizing your losses, I recommend the Iglock Method book.
In practice, using only limit orders, as shown by the blue line in the Grok method, requires taking many stop-loss lines. However, if you can confirm the price yourself, as shown by the green line, you can minimize stop-losses and enable safe retracement selling rather than breakouts. (In this case, we are considering Fibonacci resistance as the stop-loss position.)

However, if you want to further reduce your losses, I think the best approach is to check the situation yourself and cut your losses.

Then, after making a profit, at the point where the small pullback reversal ends and the price starts to rise again, we place the entry price at the 0 line.
Personally, I think it’s okay to make 10 entry points at this stage, and once an entry point is reached, I start thinking about the next entry; once an entry point is reached, I’m no longer interested.
Because if the price reverses afterward, you’ll regret not taking profits at a loss, and if it keeps rising like this time, you’ll feel like you missed out on profits.
In other words, the idea is to leave unpredictable profit-taking to market fluctuations and simply be good at cutting losses.
As a result, even if you close your position at the entry price multiple times, you will have neither profit nor loss of 0, so you can enter a trade an unlimited number of times. Occasionally, if the market moves as you expect, you can either take profits within the expected range, or you can try a trade with two options: either it moves even further, or you end up with 0 profit.
Whether you win or lose, your profits will increase, but you won’t incur any losses.
Therefore, if you place a stop-loss order near the entry price (0 line) when the price gains momentum after a pullback, you can consider it a win.
With this method, you won’t be satisfied unless your profits increase to a certain extent, so it’s absolutely necessary to focus on analyses lasting 15 minutes or more.
Below that level, it’s difficult to even cover the spread, and you’re more likely to end up with a loss.
With around three trades per day, stop-loss orders are scalping, and holding positions is like day trading. If there’s a possibility of further gains, as in this case, it’s recommended to switch to a swing trade instead of taking profits.
These are the only things I personally pay attention to.
This link provides helpful information on the importance of stop-loss orders.
If you’re someone who can only trade in range-bound markets, I recommend Bollinger Bands.

With this in mind, we’ll use the RSI and Bollinger Bands’ 1-sigma, 2-sigma, and 3-sigma levels as references for counter-trend trading.
This is the most famous and simplest contrarian trading strategy.
Furthermore, I know someone who is having trouble studying FX, so after much thought, I’ve come up with an indicator setting that automates my method for them. Please take a look if you’re interested.
Chart patterns are fundamental, but this is for people who don’t know where to draw the lines for those chart patterns.
It’s also recommended for people like me who can analyze but still find themselves looking at 1-minute charts! *This is because it’s customized to allow you to gather a certain amount of evidence even with 1-minute charts.
Let’s compare the images and discuss it.

For example, there are multiple chart patterns, such as the inverse triangle, and the trading method changes depending on the pattern, but this is difficult for beginners.

Therefore, by adding indicators like this, you can enter trades at the appropriate positions even if you don’t understand the patterns.
- Trend AD
- Range 15 Bolliban
- A special indicator that can display Bollinger Bands for higher timeframes in 1 minute.
- All VWAP
- Entry RSI
The important indicators are listed here.
This method allows you to mimic MTF analysis and the rationale behind certain chart patterns, naturally leading to better entry points.
This example is a version of the inverted triangle.
For other patterns, please check chart patterns and formations in resources such as “ Practical FX Trading: How to Identify Profitable Market Patterns” and blogs.
For those who have become accustomed to it, erasing all the Bollinger Bands makes the chart much easier to read and understand.

As a tip, it’s a good idea to carefully check for divergence between AD and RSI.
However, it involves more discretionary judgment, so it can be a little difficult for beginners.
Reference article: [In-depth Research] Research on Channel Lines and Center Lines in MT4
**The Textbook of FX Line Trading [Nobuo Takeda]**
created by Rinker
¥1,980 (As of 2026/05/06 10:48:36, according to Rakuten Market — details)
Below is my schedule.
- Sleep between 6 and 9 a.m.
- *9:00 AM — 12:00 PM (Before noon) 9:00 AM — 10:00 AM: Pattern analysis + position adjustment (Recommended trading time)**
- From 12:00 to 15:00 (afternoon): Confirm whether stop-loss and reversal positions are correct, verify scenario construction, and analyze whether to take profits or hold.
- *3 PM — 6 PM “Evening” 3 PM — 4 PM Asian market analysis (Recommended trading hours)**
- Between 6 PM and 9 PM (early evening), check if stop-loss and reversal positions are correct, and analyze whether to take profits or hold the position.
- *9 PM to 12 AM (late at night): European market analysis from 10 PM to 11 PM. Settlement + profit-taking analysis. (Recommended trading time)**
- “Unknown” sleep between 0:00 and 3:00
- Sleep from 3 AM to 6 AM (early morning)
I will perform the above routine.
However, most people place limit orders between 3 PM and 6 PM (the “evening” period) for Asian market analysis (recommended trading time), and then close their positions at midnight or switch to swing trading, deciding what to do with those positions in the morning.
That’s the main thing, but I can’t wake up early in the morning, and I’m too sleepy to concentrate late at night, so that’s how it is.
Important advice
- Scenario development should take 15 minutes or more (1 minute and 5 minutes tend to result in losses).
- Time zone trading (trading during periods when the market is stagnant will inevitably lead to a series of losses)
Please refer to this for information regarding time slots.

I’ve actually circled it in red.

[What do millionaire traders have in common?] Takeyama Kanningu’s FX Talk Season 2 #3 ~Trading Time~
Here’s a rough summary of the information:
- 9am-11am: Trend target
- 3 PM — 6 PM: Targeting trends
- 9 PM — 12 AM: Targeting trends
- At other times, target ranges.
Whether a trend or a range-bound market is dominant depends on the time period mentioned above.
Regarding priorities
Trend lines, channel lines, and support/resistance lines < Chart pattern analysis < Market time < Meaningful large bullish and bearish candlesticks
Prioritizing analysis (in order of strongest evidence)
- Significant large bullish and bearish candlesticks (there is a reason behind the candlesticks that precede breakouts or clearly indicate a determined direction)
- Market time (because the number of participants increases)
- Chart pattern analysis (H1 or D1) (Reason: because it indicates a trend in the direction of entry)
- Trend lines, channel lines, and support/resistance lines (with varying rationale, further rationale needed)
Identifying Trends and Ranges
- Market times: Trends are more likely between 9am-10am, 3pm-4pm, and 10pm-11pm. Outside of these times, the market tends to be range-bound.
- VWAP: When the VWAP is flat, it indicates a range-bound market. If it continues to slope, it indicates a trending market.
I’ve repeatedly entered trades during periods of price movement, made profits, and then entered trades during periods of stagnation, losing profits. So, I really want to emphasize the importance of being careful during these times.
Because I admired Mr. Testa, I have a habit of engaging in short-term trading.
I really wanted to try trading using a scalping approach, so I came up with this as well. Please use it as a reference. This is a slightly more difficult version.
[Learning from Failures] Pitfalls and Improvement Strategies for Conquering Fintokei
I will share the lessons I learned from my own mistakes (especially consecutive losses in 1-minute and 5-minute chart trading in the early stages) and the improvements I made from them.
- Factors contributing to failure: Being misled by false signals on short timeframes and suffering from frequent stop-losses. Losing sight of the trend on higher timeframes.
- Improvement Measure ①: A mechanism to force users to view charts of 15 minutes or longer: Remove 1-minute and 5-minute charts from MT4/MT5 charts to physically prevent them from being viewed. (See image)
- Improvement Measure ②: Assistance with Indicators (for Beginners): If you find yourself constantly looking at short-term charts, try combining indicators such as VWAP (overall), ADX (trend), Bollinger Bands (range), and RSI (timing) to create a setup that supplements the concept of multi-timeframe analysis. (However, discretionary judgment will still be a factor.)
- Improvement measure ③: Stricter decision-making regarding reversal: Instead of immediately entering a trade in the opposite direction after a stop-loss, always confirm a clear reversal signal or breakout on a higher timeframe (15 minutes or longer) before doing so.
Failure is inevitable, but analyzing it and using that analysis to develop concrete improvement measures is key to growth.
[Fintokei Strategy Study] Failure: Examples of Losses in Scenario Construction Using 1-Minute and 5-Minute Charts
I’ve compiled a summary of those failures. (※Explanation of the two consecutive losing trades on the above day with a 34% actual return)
I myself have a strange routine where I trade for 1 minute and 5 minutes and lose, trade for 15 minutes and make a profit, lose outside of trading hours, and then make a profit during trading hours.
Many losses can be offset by reversing your position when the price breaks through its highs and lows.
However, if they couldn’t break even, there’s a high probability they were watching the market for 5 minutes.
Switching to a 15-minute chart to confirm the highs and lows can help you avoid losses and allow for appropriate reversals of positions.

This is a perfect example of a losing trade. I lost twice, with the red arrows indicating the losses and the green arrows indicating the direction I had anticipated.
This loss was based on an analysis using the 5-minute chart and Dow Theory. In other words, the evidence was weak.

I saw a small wave in the 5-minute window, so I thought it might go down and entered the water, then reversed and entered the water again.
The analysis wasn’t wrong, and there was enough profit to offset the loss if the reversal had worked out, but the stop-loss was cut too early.
However, please check the 15-minute chart.

There are no signs of a decline; it’s simply a gradual upward trend.
This is why the analysis takes more than 15 minutes.
It’s difficult to determine whether a trend is being pulled back or at a turning point without looking at the price movement over a 15-minute period or longer, so it’s recommended to check the price movement over a 15-minute period or longer.
Fundamentally, unless there’s a breakout on a 15-minute chart or longer, it’s difficult to capture any price movement, which tends to increase the cost of trading.
I know it myself, but I still find myself looking at the 1-minute and 5-minute marks.
Therefore, the best approach is to either delete the 1-minute and 5-minute charts in MT4, or spend the time outside of trading hours meticulously building and organizing trading scenarios, and then enter trades during market hours.

I made it physically impossible to verify by removing the 1-minute and 5-minute charts.
Even with 1-minute or 5-minute charts, trading is possible if the price aligns with the resistance and trend of the 15-minute chart.
As long as you don’t go against the 15-minute chart analysis and take profits early, trading is OK.
If you want to check something but prefer to monitor on timeframes of 15 minutes or longer, try rearranging the order like this; you’ll surprisingly end up looking at the 15-minute chart more often, so I recommend it.

[Additional] Anchored VWAP
Anchored VWAP: The Only Trading Tool You Need — YouTube
Actually, there are different types of VWAP, which can be divided into VWAP (Volume-Weighted Average Price) and Anchored VWAP (Fixed VWAP).
This time, we considered a fixed Anchored VWAP as an additional element.
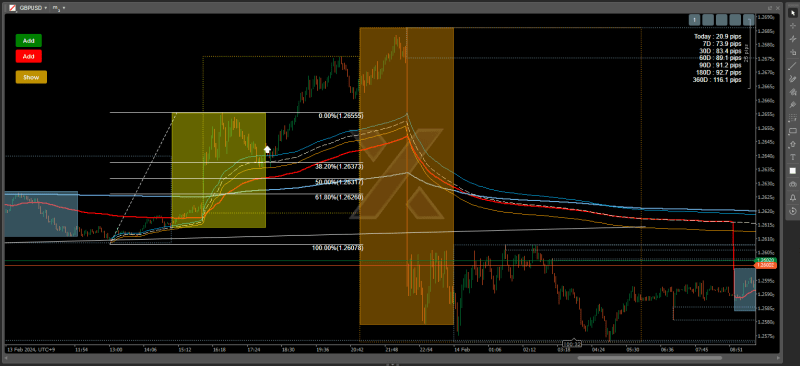
Here’s a way to further improve your analysis.
This image was created using CTrader.
I’ve created a personal indicator where the blue, yellow, and red colors change only during the first three hours of market activity, indicating that trading is more likely during this time.
The rest consists of three regular VWAPs and one fixed VWAP, which is drawn at an arbitrary value.
The left column shows the lot size management indicator, and the right column shows the average pips indicator.
The five qualification icons above indicate the number of fixed VWAPs that can be displayed.
Also, while I was displaying connected VWAPs in MT4, I recommend using these disconnected VWAPs because they are lighter and allow for quicker chart switching.
Previously, repeating the process took a long time and was very difficult.

In this way, I’ve made it possible to display other fixed VWAPs as well.
This seems like the best option, so please use it as a reference.

Additional information: More detailed methods are also available [for beginners and advanced users].
Beginner-friendly
Advanced
Summary: Conquering Fintokei can be achieved through “unique rules x discipline x improvement”!

Passing the Fintokei Challenge and achieving success as a prop trader is by no means an easy path. However, with the right knowledge and strategy, and above all, by building your own “reproducible rules,” adhering to them with iron discipline , and continuously improving them, that path will surely open up for you.
I hope that the strategies and methods I’ve explained in this article, such as “VWAP x RSI x BB x Pattern Analysis,” “Scenario Construction,” “Stop-Loss in Seconds,” “Lucky-Style Profit Taking,” “Entry-Level Settlement,” and “Analysis on 15-Minute Charts or Longer,” will be helpful in your Fintokei trading endeavors.
The final step to mastering Fintokei:
Using the information in this article as a reference, write down your own specific Fintokei strategy rules .
Thoroughly practice and test those rules using a demo account or the Fintokei free trial .
Once you’ve gained confidence, make up your mind and apply for the challenge .
During the challenge, adherence to the rules takes top priority over achieving profit targets .
Even if we fail, we analyze the cause, make improvements, and try again .
I wholeheartedly support your endeavor!
Test your skills now with Fintokei and open the door to becoming a professional!
>> Check the challenge details on the Fintokei official website
메타데이터
- post_id
- 4e38394371d7
- slug
- fintokei-complete-strategy-bible-everything-about-next-generation-trading-strategies-built-around-4e38394371d7
- url
- https://medium.com/@daito_daison/fintokei-complete-strategy-bible-everything-about-next-generation-trading-strategies-built-around-4e38394371d7
- canonical_url
- https://medium.com/@daito_daison/fintokei-complete-strategy-bible-everything-about-next-generation-trading-strategies-built-around-4e38394371d7
- author_url
- https://medium.com/@daito_daison
- status
- ok
- fetched_at
- 2026-06-21 23:24:37