Metrics at Scale: Powering 500 Billion+ Metrics a Day with OpenTSDB @ PhonePe
In this article, we walk through the high-level architecture behind how PhonePe ingests, routes, and stores over trillions of metrics using…
Metrics at Scale: Powering 500 Billion+ Metrics a Day with OpenTSDB @ PhonePe
In this article, we walk through the high-level architecture behind how PhonePe ingests, routes, and stores over trillions of metrics using OpenTSDB and HBase. This is the first of a multi-part series; upcoming articles will deep dive into configuration tuning, high cardinality handling, and real-time alerting infrastructure.
At PhonePe, observability is not an afterthought — it’s a foundational capability. Our infrastructure generates billions of metrics a day, which help us monitor everything from application health to system performance across our massive fleet of services and servers. Here’s a deep dive into our metrics ingestion architecture built on OpenTSDB + HBase, scaled for reliability, performance, and real-time insights.
Why OpenTSDB?
We needed a system that could:
- Handle extremely high ingestion throughput
- Store and retrieve time series efficiently
- Be horizontally scalable
OpenTSDB built on top of HBase provided the perfect foundation — robust, proven, and battle-tested at scale.
Architectural Overview
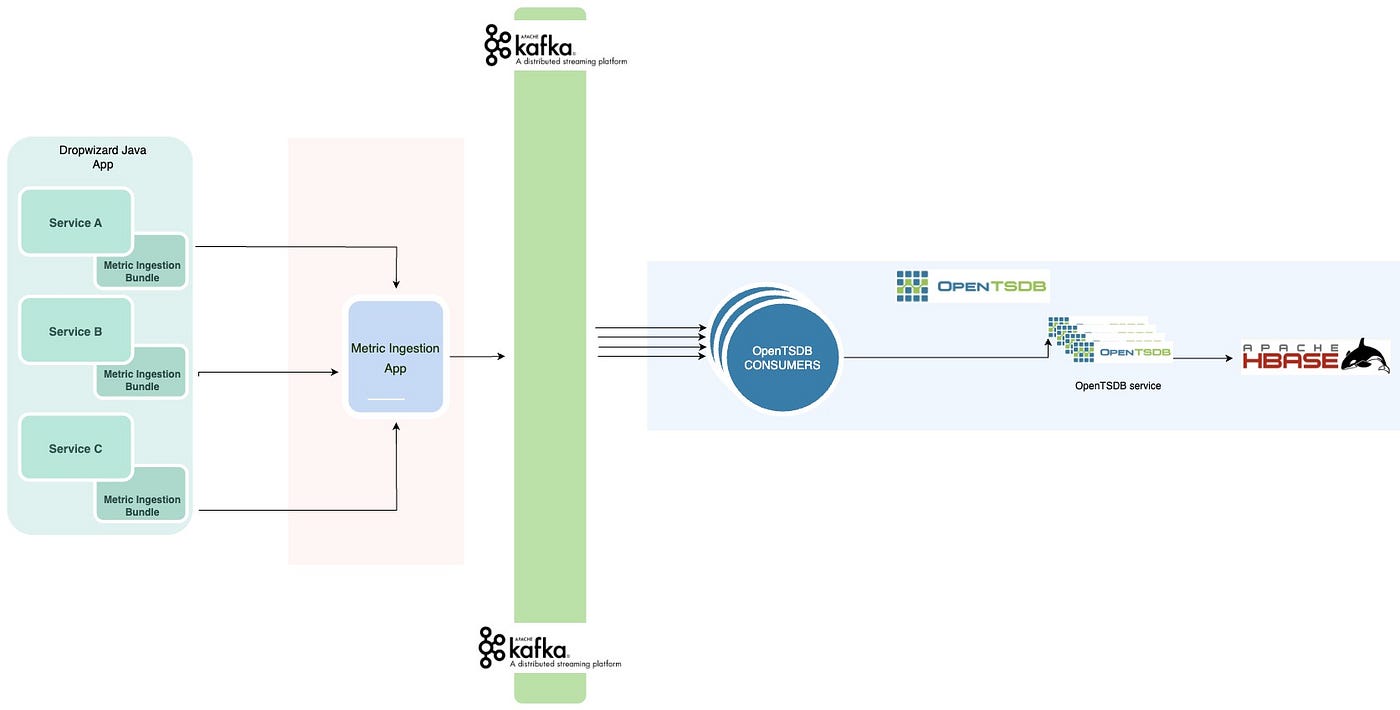
Our architecture is designed to handle two major sources of metrics:
- Service Metrics — Emitted by 100s of internal services (500+)
- Infrastructure Metrics — Emitted by 1000s of Telegraf agents running on each server
These metrics follow the same core ingestion pattern:
Flow Diagram 1: Overall Metrics Ingestion
┌────────────┐     ┌────────────────────────────┐     ┌──────────────┐
│  Services  ├────▶ Metrics Ingestion Bundle ├────▶   Kafka (Service)│
└────────────┘     └────────────────────────────┘     └──────────────┘
Kafka as the Central Pipeline
- 400 Kafka partitions for service metrics (Handles around close to 6 million metrics per sec)
- 100 Kafka partitions for telegraf metrics (Handles around close to 1 million metrics per sec)
This decouples the ingestion logic from processing logic, allowing independent scaling, buffering, and backpressure management.
Dual Processing Pipelines
From Kafka, we operate two independent pipelines: We do different transformations and addition of different system tags in each of the pipelines. These metrics get written to the same Opentsdb write deployment and hence into the same HBase cluster.
Flow Diagram 2: Kafka to OpenTSDB
Kafka (Service) ──▶ Service Metrics Pipeline ──▶ OpenTSDB (Write-only) ─▶ HBase
Kafka (Telegraf) ─▶ Infra Metrics Pipeline ───▶ OpenTSDB (Write-only) ─▶ HBase
Write vs Read
Issue : Heavy reads were slowing down Opentsdb instances which were impacting the write throughput and hence causing lag in the ingestion pipeline
Solution : Separate write and read deployments
To ensure optimal write and read performance and isolation between writes and reads, we run two separate OpenTSDB deployments on top of the same HBase cluster
- Write Deployment — Handles all real-time ingestion
- Read Deployment — Serves user queries, dashboards, and alerting
These read clusters are fronted by a smart routing proxy service we built called Armor.
Active-Active Across Data Centers
We run all services including HBase, OpenTSDB, Armor, and Kafka in two active-active data centers:
- Redundancy ensures high availability and disaster resilience
- Armor intelligently handles failover without impacting the clients
Flow Diagram 3: Armor Proxy for Routing and Caching
                  ┌──────────┐
                  │  Client  │
                  └────┬─────┘
                       │
                  ┌────▼────┐
                  │  Armor  │
                  └────┬────┘
                       │
       ┌───────────────┴────────────────┐
       ▼                                ▼
OpenTSDB - DC1 (Read)           OpenTSDB - DC2 (Read)
Armor Features:
- Caches hot queries to reduce load on Opentsdb & HBase
- Routes traffic intelligently between clusters based on availability and cluster health
- Query blocking
HBase at the Core
Our OpenTSDB instances store all time series data in HBase, configured for massive scale:
- 200 Region Servers across 50 Bare Metal Servers (4 VMs per BM)
- Each region server -
- 2x 6.4 TB Disks
- 20 CPU Cores
- 120 GB RAM
This architecture ensures high throughput writes and consistent read latencies.
Summary
Our journey with OpenTSDB has been an exercise in extreme scale and engineering finesse. By building intelligent ingestion paths, leveraging Kafka as the data backbone, decoupling write and read flows, and deploying in active-active mode — we ensure that PhonePe’s observability stack remains resilient, responsive, and ready for the future.
Stay tuned for future articles where we’ll dive into:
- How we compress and optimize metric storage
- Our strategy for reducing high cardinality metric explosion
- Real-time alerting on a trillion-metric scale
Coming Up Next
In the next article, we’ll cover the config tuning strategies we’ve adopted over the years to scale OpenTSDB to this level of throughput — covering tuning done at the level of HBase, OpenTSDB, and JVMs to sustain our ingestion rates, reduce GC pauses, and balance compaction load.
메타데이터
- post_id
- 4e42d0a963fe
- slug
- metrics-at-scale-powering-500-billion-metrics-a-day-with-opentsdb-phonepe-4e42d0a963fe
- url
- https://medium.com/@nitishgoyal13/metrics-at-scale-powering-500-billion-metrics-a-day-with-opentsdb-phonepe-4e42d0a963fe
- canonical_url
- https://medium.com/@nitishgoyal13/metrics-at-scale-powering-500-billion-metrics-a-day-with-opentsdb-phonepe-4e42d0a963fe
- author_url
- https://medium.com/@nitishgoyal13
- status
- ok
- fetched_at
- 2026-06-25 12:15:08