From Coordinates to Hexagons: The Design Behind Rapido’s Dispatch
I used the Rapido Captain app for a day. And something bugged me the whole time. Every time I came online, notifications were already…
From Coordinates to Hexagons: The Design Behind Rapido’s Dispatch
I used the Rapido Captain app for a day. And something bugged me the whole time. Every time I came online, notifications were already waiting, customers lined up before I even moved. And when I was heading home after a ride, the app would suggest pickups that were almost exactly on my way back. Not near me. On my route. That’s an algorithm that knows where you’re going, not just where you are.
Let’s understand how Rapido’s dispatch system actually works.
First, the obvious approach and why it fails?
Imagine you’re building Rapido’s backend. A user books a ride, and you compute the straight-line distance to every active Captain, sort them, and ping the nearest. Sound Simple, ain’t? But it does not scale.
With 100k Captains, this becomes compute-heavy, increases latency, and drives up infrastructure costs. You’re essentially brute-forcing every request, which is both expensive and inefficient.
Example: Captain A is just 600 meters away. Captain B is 1.1 km away. You’d obviously ping A first. A is stuck on the other side of a railway crossing. In cities with busy junctions, that 600 meters can easily turn into a 3–4 km detour. So while A looks closer on paper, B is the one who actually gets to you faster.
The Smarter Approach: Why Hexagons Beat Coordinates
Rapido rebuilt their dispatch system around Uber’s open-source H3 grid — a way of dividing the entire Earth into hexagonal cells, each with a unique 64-bit integer ID.
But why hexagons, not squares? In a square grid, diagonal neighbors are farther than side neighbors, which makes the idea of “nearby” inconsistent. Hexagons fix this, every neighboring cell is equidistant from the center. That symmetry makes distance calculations cleaner, more predictable, and more reliable at scale.
How a Captain’s location is stored internally:
Before -> lat: 17.3850, lng: 78.4867 After-> cell_id: 8828308280fffff
One integer. No trigonometry. No floating point. A key-value update and the fastest write operation possible. When a Captain moves, they don’t update two floats. They update one integer, their cell ID. The whole system becomes a hashmap problem, not a geometry problem
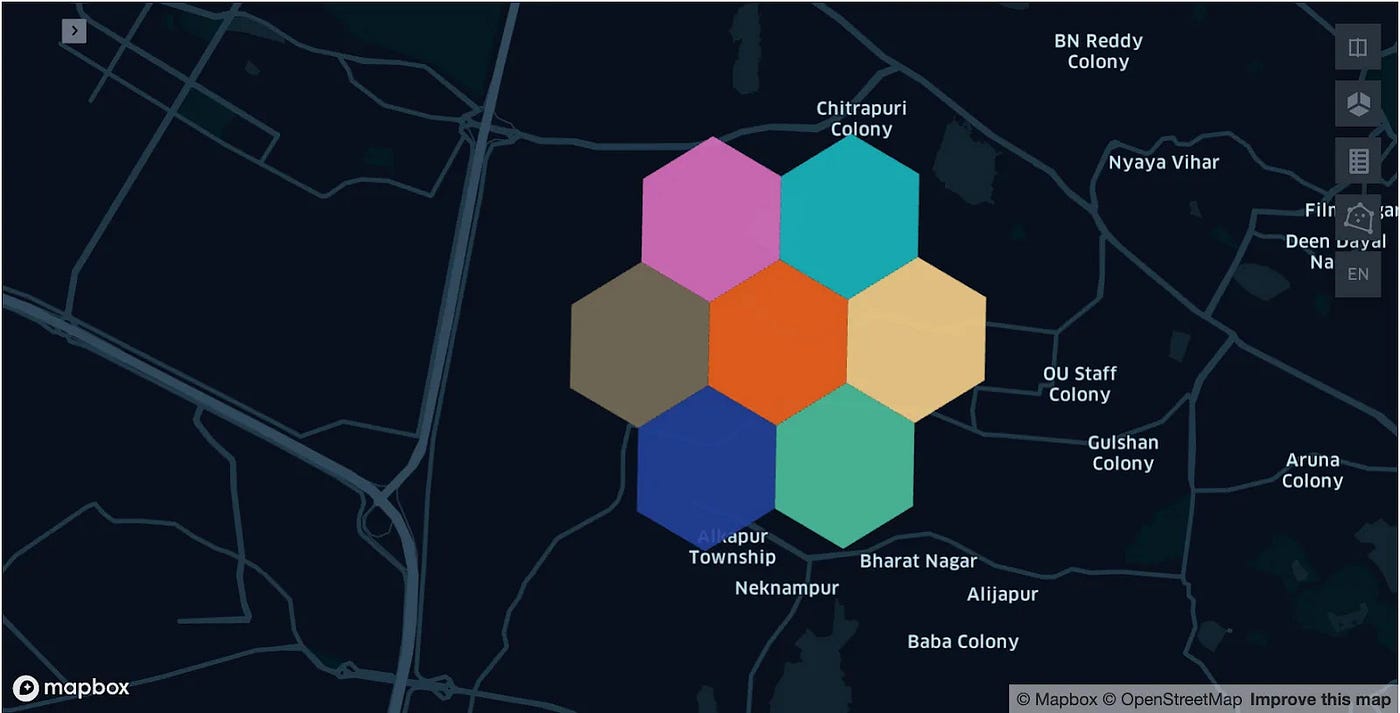
The three hexes that run every dispatch:
source_hex: the hex where the ride starts. good_hex: farther on paper, but faster in real life. bad_hex: close on paper, but slowed by barriers like railways, flyovers, ring roads etc.
And these relationships are pre-computed, not calculated live. The system already knows from historical pattern that on Monday 9am in Hyderabad which hexes are bad neighbours of which source hexes. At runtime, no computations, just a lookup.
The next obvious question comes…
Where does the driving-time data come from?
Rapido doesn’t use Google Maps to compute drive times per request, it would be too expensive at scale with so many API hits plus financials matters for any growing startups. Instead, they mine their own historical rides. The system knows that crossing from hex A to hex B takes 4 minutes on Sunday evening but 11 minutes on a Monday morning. Not because GoogleMaps said so but because a million Rapido Captains already drove that route and the timestamps were logged.
Great engineering is usually about transforming the hard problem into a different, easier problem. Rapido turned a geometry problem into a hashmap problem. They didn’t make the solution complex. The question got simpler.
Bonus:
How the zones are actually identified for driver’s better incentives
The system works on the ratio of ride requests to available Captains inside a hex cluster, tracked over time.
The app’s algorithm continuously monitors drivers supply versus demand ride requests. When demand spikes during rush hour or sudden downpours, it multiplies the base fare by a surge multiplier to incentivise more drivers to head toward high-demand zones. The zones are pre-identified from historical hex-level data, the same H3 grid running dispatch. The system looks at:
Demand density: how many ride requests originate from a hex cluster per hour, segmented by day-of-week and time-of-day. Supply thinness: how many active Captains are in that cluster at those same windows. Completion rate: what percentage of requests in that zone actually get matched. A zone with lots of requests but lots of cancellations is a broken zone, not a good zone.
When a hex cluster consistently shows high demand, low supply, and poor completion rate, it gets flagged as a Work Zone.
메타데이터
- post_id
- 4e7f699e955e
- slug
- from-coordinates-to-hexagons-the-design-behind-rapidos-dispatch-4e7f699e955e
- url
- https://medium.com/@iwasifirshad/from-coordinates-to-hexagons-the-design-behind-rapidos-dispatch-4e7f699e955e
- canonical_url
- https://medium.com/@iwasifirshad/from-coordinates-to-hexagons-the-design-behind-rapidos-dispatch-4e7f699e955e
- author_url
- https://medium.com/@iwasifirshad
- status
- ok
- fetched_at
- 2026-07-13 10:11:35