Graph Neural Networks and Explainable AI in Electrocardiography (ECG)
“I’m sorry, I can’t tell you why.”
Graph Neural Networks and Explainable AI in Electrocardiography (ECG)
“I’m sorry, I can’t tell you why.”
Imagine a doctor saying that after giving you a life-altering diagnosis. You’d be horrified. Yet, for years, that’s exactly how most Medical AI has worked as a brilliant but silent “black box”.
In medical AI, automating diagnosis is only half the battle, as clinicians need to understand the “why” behind predictions to improve trust. The study
Longo, L., Brcic, M., Cabitza, F., Choi, J., Confalonieri, R., Del Ser, J., Guidotti, R., Hayashi, Y., Herrera, F., Holzinger, A., Jiang, R., Khosravi, H., Lecue, F., Malgieri, G., Páez, A., Samek, W., Schneider, J., Speith, T., & Stumpf, S. (2024). Explainable Artificial Intelligence (XAI) 2.0: A manifesto of open challenges and interdisciplinary research directions. Information Fusion, 106, 102301. https://doi.org/10.1016/j.inffus.2024.102301
provides a look into making AI-driven heart health analysis more transparent using GNN and GNNExplainer. Read the full study at Nature Portfolio.
The Problem: When Accuracy Isn’t Enough
Cardiovascular diseases (CVDs) remain a primary global health challenge, contributing significantly to worldwide morbidity and mortality. Myocardial Infarction (MI) alone is responsible for over 15.2 million fatalities annually, making timely and accurate detection a matter of life and death.
While modern deep learning models can achieve high accuracy in detecting these events, they often function as “black boxes.” This lack of transparency makes it difficult for clinicians to understand the reasoning behind a prediction or to trust the AI in a high-stakes medical environment.
Standard AI often misses the “big picture” of how different cardiac signals relate to one another. For a doctor, an ECG isn’t just a collection of independent numbers; it is a spatial map of the heart. As shown in the diagram below, a cardiologist knows that changes in leads V1–V4 indicate an Anteroseptal MI, while leads II, III, and aVF point to an Inferior MI.
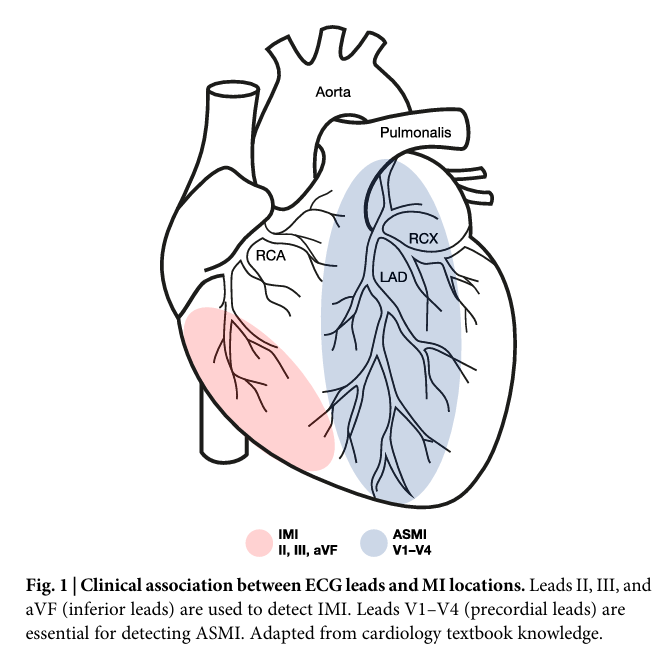
Figure 1: Clinical association between ECG leads and MI locations
Graph Neural Networks (GNNs) are a “natural fit” for this data because they are designed to model these exact types of deep, complex connections. By treating the ECG as a system rather than isolated data points, GNNs allow us to bridge the gap between high-performance AI and clinical reality.
Graph Construction: Modeling the “Living Web”
The xGNN4MI framework transforms the standard 10-second 12-lead ECG into a complex graph structure G = (V, E) that captures both anatomy and time.
- Temporal Patches: To capture the dynamics of the signal, the 10-second ECG is divided into 25 non-overlapping patches, each lasting 400ms.
- Nodes (V): The graph doesn’t just have 12 nodes; it consists of 12 leads x 25 temporal patches, resulting in a total of 300 nodes. Each node v(i,t) represents a specific lead i at a specific time window t.
- Node Representation: Every node contains a feature vector x representing the raw signal data for that specific lead and time window. At a 250Hz sampling rate, each 400ms patch translates to a 100-value feature vector.
- Edges (E): Connections are represented by a binary adjacency matrix A. These edges aren’t random; they follow three clinical rules:
- Limb leads (I, II, III, aVR, aVL, aVF) are fully connected to each other.
- Chest leads (V1-V6) are fully connected to each other.
- Bridging links (using leads I, aVF, V4, and V5) connect the two systems based on spatial proximity.
This figure represents an “example of the graph representation” and not the actual graph used in the study:

Figure 2: An example of different elements of Constructed Graph.
The Mathematics of Connection
Unlike traditional models that treat leads as independent channels, GNNs use message passing. This allows each node to update its representation by aggregating “knowledge” from its neighbors. The xGNN4MI framework utilizes a Graph Convolutional Network (GCN) with a normalized propagation rule to ensure stable learning:

In this equation, (A) is the adjacency matrix (the “web” of lead connections), while H represents the learned features of the leads. This math is what allows the AI to finally see the “big picture” that a cardiologist sees.
The “xGNN4MI” Architecture: From Signals to Insights
To turn raw ECG leads into a transparent diagnosis, the framework uses a three-stage neural architecture:
- Step 1: Feature Enhancement (FFN) Before the graph convolution begins, node features are processed through a 2-layer Feed-Forward Network (FFN). By incorporating Batch Normalization and Dropout, this stage ensures robust feature extraction and boosts the representational capacity of each lead. Crucially, this initial transformation helps mitigate “over-smoothing” which is a common challenge in deep networks where nodes can become too similar and lose their distinct diagnostic value.
- Step 2: Structural Learning (GCN) The core of the model consists of 5 Graph Convolutional Network (GCN) blocks. Here, the model performs “message passing,” where each lead node refines its internal representation by aggregating information from its spatial and temporal neighbors. Each block uses Dropout and ReLU activations to maintain generalizability and prevent the model from overfitting to specific datasets.
- Step 3: The Classification Head Once the leads have “shared” their information across the graph, the final node embeddings are flattened into a unified feature vector. This vector is passed to a Fully Connected (FC) layer, which acts as the final classification head to determine the diagnostic outcome such as identifying a specific subtype of Myocardial Infarction.

Figure 3: An end-to-end Architectural Overview of the Framework.
Architectural Efficiency: The Case for a “Plain” GCN
In the development of the xGNN4MI framework, the authors explored whether modern deep learning techniques like skip connections standard in architectures such as ResNet would boost diagnostic performance. Interestingly, they found that skip connections did not improve results in this specific setting. A “plain” Graph Convolutional Network (GCN) without these connections achieved comparable accuracy while maintaining a significantly lower parameter count than more complex DenseNet or ResNet variants. This suggests that because the spatial lead positions and temporal dynamics are already explicitly encoded into the graph’s structure, a leaner model can effectively learn the necessary diagnostic features without the need for the added structural complexity often required by non-graph models.
GNNExplainer for Explanations: Opening the Black Box:
The framework utilizes GNNExplainer, a perturbation-based, model-agnostic method that identifies the most influential substructures nodes, edges, and features within a graph that contribute to a specific classification. Because it is a post-hoc technique, it functions independently of the GNN architecture, allowing for the generation of explanations without requiring model retraining.
To make the AI’s reasoning more reliable, the framework groups importance scores by disease type rather than just looking at one patient at a time. This “cohort-level” approach creates a steady, consistent pattern of lead importance that doctors can easily compare to medical textbooks. While the system is optimized for these group insights, it can also be adapted for an individual patient by summarizing how each lead contributed throughout the entire recording.

Figure 4: Node and edge importance computed by GNNExplainer for PTB-XL dataset predictions
Clinical Findings:
The results demonstrate a high agreement between the GNN’s “reasoning” and physiological reality specifically for PTB-XL dataset:
- Anteroseptal MI (ASMI): The model correctly concentrated its attention on the anterior precordial leads, specifically V1, V2, and V3. The strongest connections were found between V1–V2 followed by V2–V3, which aligns perfectly with where septal damage is traditionally detected.
- Inferior MI (IMI): The importance shifted dramatically toward the inferior leads — III, II, and aVR. Dense connections between leads like III and aVR reinforce that the model is relying on clinically sound criteria.
- The “aVR” Nuance: One of the most fascinating outcomes was the prominence of lead aVR in IMI cases. While often overlooked in routine diagnostics, recent clinical research identifies aVR as an independent predictor of cardiogenic shock. The model’s sensitivity to this lead suggests it may be picking up on subtle, high-risk patterns that human experts are only beginning to emphasize.
Perhaps the most telling sign of the model’s reliability is how it handles healthy hearts. In Normal (NORM) cases, the model maintains a diffuse, even distribution of importance across multiple leads, reflecting an absence of pathology. When a disease is present, the AI “tunnels” its focus into specific diagnostic regions, mimicking the selective attention of an experienced cardiologist.
The Future of Trustworthy AI
The xGNN4MI framework proves that AI can move beyond “black box” predictions to become a transparent clinical partner. By aligning machine logic with cardiology textbook knowledge, it provides a blueprint for models clinicians can truly trust.
To reach full clinical autonomy, the next steps are clear:
- Real-World Complexity: A single ECG segment can have more than one label. Shifting from single-label to multi-label classification to identify overlapping conditions in a single patient is important.
- Enhanced Connectivity: Refining graph structures to capture electrical relationships between distant leads, not just spatial neighbors.
- Temporal Precision: Integrating advanced attribution techniques like PGMExplainer which is both faster, precise and avoids heavy post-hoc training.
By offering an open-source pipeline, xGNN4MI gives the research community a foundation to build upon. We are moving closer to a future where AI doesn’t just give a diagnosis it provides a life-saving explanation.
All Images adapted from the original xGNN4MI paper.
메타데이터
- post_id
- 4e85d6dc39a8
- slug
- graph-neural-networks-and-explainable-ai-in-electrocardiography-ecg-4e85d6dc39a8
- url
- https://medium.com/@paymodeharshad00/graph-neural-networks-and-explainable-ai-in-electrocardiography-ecg-4e85d6dc39a8
- canonical_url
- https://medium.com/@paymodeharshad00/graph-neural-networks-and-explainable-ai-in-electrocardiography-ecg-4e85d6dc39a8
- author_url
- https://medium.com/@paymodeharshad00
- status
- ok
- fetched_at
- 2026-06-11 06:59:45



