From Pub/Sub to Dashboard-Ready Data: Stream Processing with Apache Flink and BigQuery (Part 2)
Part 2 of 2: Apache Flink on Dataproc for stream processing, BigQuery append-only writes, and making the data usable for dashboards
From Pub/Sub to Dashboard-Ready Data: Stream Processing with Apache Flink and BigQuery (Part 2)
Part 2 of 2: Apache Flink on Dataproc for stream processing, BigQuery append-only writes, and making the data usable for dashboards
In Part 1, we built the capture layer — PostgreSQL changes flow through Debezium into Google Cloud Pub/Sub. We now have a reliable stream of ~3,000 CDC events per second during peak hours.
But raw CDC events are not dashboard-ready. They need to be parsed, validated, deduplicated, transformed, and written to an analytics store where dashboards can query them efficiently. That is what this article covers.
Table of Contents
- Architecture Overview
- Choice of Technologies
- Apache Flink on Dataproc
- Flink Job: From Pub/Sub to BigQuery
- BigQuery Schema and Write Strategy
- Making BigQuery Data Usable for Dashboards
- Airflow Orchestration
- Monitoring the Streaming Layer
1. Architecture Overview
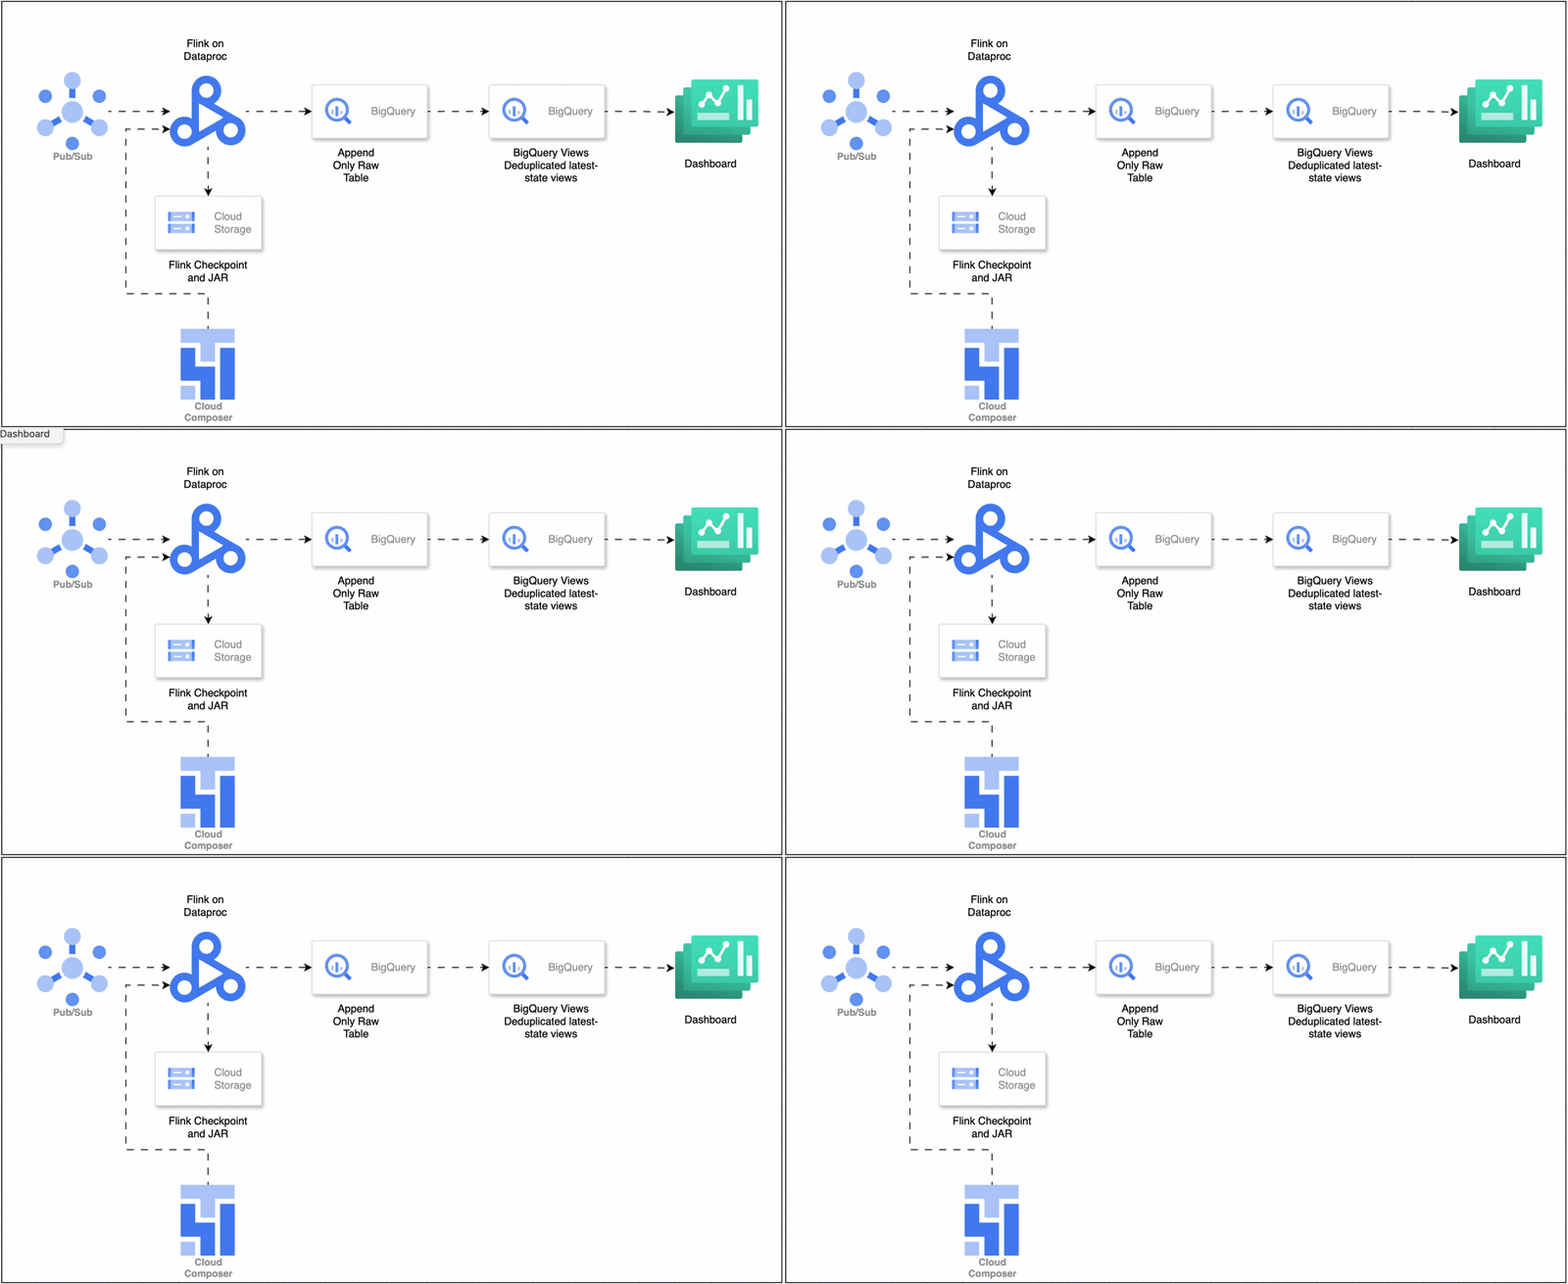
Here is the data flow for Part 2:
- Pub/Sub holds CDC events published by Debezium (from Part 1).
- Flink (running on Dataproc) pulls messages from the Pub/Sub subscription.
- Flink parses the JSON CDC events, validates their structure, deduplicates based on primary key and event timestamp, and transforms them into the target BigQuery schema.
- Flink writes transformed events to BigQuery using the Storage Write API in append-only mode. Every INSERT, UPDATE, and DELETE from the source database becomes a new row in BigQuery — nothing is overwritten.
- BigQuery views sit on top of the raw append-only tables and provide the “latest state” of each record by deduplicating on primary key and selecting the most recent event. Dashboards query these views, not the raw tables.
- Airflow manages the Flink job lifecycle — submitting jobs to Dataproc, monitoring health, and restarting on failure.
- Cloud Monitoring tracks Flink processing metrics, BigQuery write rates, and consumer lag.
2. Choice of Technologies
Stream Processor: Apache Flink on Dataproc
Apache Flink on Dataproc gave us true event-at-a-time streaming with exactly-once guarantees, powerful keyed state for deduplication, and native connectors for both Pub/Sub and BigQuery. Flink’s backpressure mechanism propagates all the way back to the Pub/Sub source, meaning the pipeline self-regulates without dropping events. Running on Dataproc meant we got managed infrastructure (cluster provisioning, monitoring, YARN) without the rigidity of a fully managed service like Dataflow.
What we considered and passed on:
- Spark Structured Streaming — Micro-batch model introduces latency we did not want. Adequate for many use cases, but Flink’s true streaming model was a better fit for sub-second CDC processing.
- Google Dataflow (Beam) — Lowest operational burden, but Beam’s abstraction layer limited our control over deduplication state management. Flink’s native APIs gave us more precision.
- Kafka Streams — Excellent for Kafka-native pipelines, but we are on Pub/Sub. Would have required bridging Pub/Sub to Kafka, adding an unnecessary dependency.
- Custom Pub/Sub consumer — Maximum flexibility, zero framework support. We did not want to build checkpointing, state management, and exactly-once semantics from scratch.
Analytics Store: BigQuery (Append-Only)
BigQuery was the clear winner for analytics at our scale. It is columnar, massively parallel, and integrates natively with every BI tool on GCP (Looker, Data Studio, Tableau). The append-only write pattern — where every CDC event becomes a new row regardless of operation type — plays to BigQuery’s greatest strength: the Storage Write API is blazingly fast in append mode because there is no row-level locking, no upsert logic, and no merge overhead. We reconstruct “current state” using SQL views that deduplicate on primary key.
What we considered and passed on:
- Cloud SQL (PostgreSQL) — OLTP-optimized, degrades past ~100 million rows. Our tables exceed that within months.
- Cloud Spanner — Globally distributed and powerful, but overkill for analytics workloads. The cost model (per-node) is expensive for read-heavy dashboards.
- Apache Druid / ClickHouse — Strong analytics engines, but self-managed on GCP. We wanted fully managed infrastructure with native BI integration.
Orchestration: Apache Airflow (Cloud Composer)
Cloud Composer (Airflow) was already running in our environment for batch ETL. Adding a DAG for Flink job lifecycle management was incremental — no new infrastructure, no new operational knowledge. Airflow’s retry policies, SLA monitoring, and DAG visualization made it easy to manage the streaming job.
What we considered and passed on:
- Cloud Scheduler + Cloud Functions — Good for simple triggers, but lacks DAG-based workflow orchestration and the observability Airflow provides.
- Manual (systemd/cron) — No visibility, no retry logic, no alerting. Unacceptable for a 24/7 streaming pipeline.
3. Apache Flink on Dataproc
3.1 Dataproc Cluster Configuration
The Flink job runs on a Dataproc cluster configured for streaming workloads. Unlike batch clusters that spin up and down, this one runs continuously.
Cluster type:           Standard (1 master + N workers)
Image version:          2.1-debian11 (with Flink optional component pre-installed)
Optional components:    FLINK
Master node:            n2-standard-2 (2 vCPU, 8 GB)
Worker nodes:           n2-standard-2 (2 vCPU, 8 GB) × 2
Worker disk:            100 GB SSD per worker
Autoscaling:            Disabled
Network:                Same VPC as Pub/Sub and BigQuery
Initialization action:  Custom script that copies Pub/Sub and BigQuery connector JARs from GCS to Flink lib directory
The base Dataproc Flink image does not include Pub/Sub or BigQuery connectors. The init script downloads flink-connector-pubsub and flink-connector-bigquery JARs from a GCS bucket during cluster creation.
3.2 Flink Configuration (flink-conf.yaml)
Task and parallelism:
taskmanager.numberOfTaskSlots: 4        # 4 slots per TaskManager; 3 workers = 12 total slots
parallelism.default: 8                  # 8 parallel instances; leaves 4 slots as headroom for restarts
taskmanager.memory.process.size: 24576m # 24 GB per TaskManager; leaves 8 GB of the 32 GB worker for OS/YARN
taskmanager.memory.managed.fraction: 0.4 # 40% for RocksDB state cache and sorting
State and checkpointing:
state.backend: rocksdb                                  # Handles state larger than memory by spilling to local SSD
state.checkpoints.dir: gs://<bucket>/flink-checkpoints/ # Checkpoints persisted to GCS for cross-cluster recovery
state.savepoints.dir: gs://<bucket>/flink-savepoints/   # Manual savepoints for upgrades stored in GCS
execution.checkpointing.interval: 60000                 # Checkpoint every 60 seconds — balances recovery time vs overhead
execution.checkpointing.mode: EXACTLY_ONCE              # End-to-end exactly-once when combined with Pub/Sub dedup
execution.checkpointing.timeout: 600000                 # 10 min timeout; prevents checkpoint storms from blocking processing
Restart strategy:
restart-strategy: fixed-delay              # On failure, restart after a fixed delay
restart-strategy.fixed-delay.attempts: 5   # Max 5 restarts before the job is marked failed
restart-strategy.fixed-delay.delay: 30s    # 30s delay between restarts; gives transient issues time to resolve
For the full Flink configuration reference: Apache Flink Configuration Docs
4. Flink Job: From Pub/Sub to BigQuery
The Flink job is a single Java application that runs continuously on the Dataproc cluster. It performs four operations in a streaming pipeline.
4.1 Pipeline Overview
Source (Pub/Sub) → Parse & Validate → Deduplicate → Sink (BigQuery)
Step 1 — Read from Pub/Sub: The Flink Pub/Sub source connector pulls messages from the cdc-events-flink-subscription subscription. It acknowledges messages only after they have been checkpointed, ensuring no data loss. The source runs with the same parallelism as the rest of the pipeline (8 parallel readers).
Step 2 — Parse and Validate: Each raw Pub/Sub message (a JSON string) is parsed into a structured CDC event object. The parser extracts the operation type (c for create, u for update, d for delete, r for snapshot read), the before and after row states, the source table name, and the event timestamp. Malformed messages (unparseable JSON, missing required fields) are routed to a side output that writes them to a dedicated cdc-parse-errors Pub/Sub topic for investigation. A single bad message never stalls the entire pipeline.
Step 3 — Deduplicate: Events are keyed by their composite key (table name + primary key). Flink maintains a keyed state for each unique key, storing the timestamp of the last processed event. If an incoming event has a timestamp less than or equal to the stored timestamp, it is a duplicate (from Pub/Sub redelivery or Debezium replay after restart) and is dropped. This is where Flink’s RocksDB state backend earns its keep — deduplication state for millions of unique keys is managed efficiently with automatic spill to disk.
Step 4 — Write to BigQuery: Deduplicated events are written to BigQuery using the Storage Write API in append mode. Events are routed to their target BigQuery table based on the source table name in the CDC event. Each event becomes a new row, regardless of whether the source operation was INSERT, UPDATE, or DELETE. Metadata columns are added to every row (see Section 5).
4.2 Key Implementation Details
Error handling: The pipeline uses Flink’s side output mechanism. Parse errors, validation failures, and write errors are all routed to separate side outputs rather than failing the job. One corrupt event never blocks thousands of valid events behind it.
Watermarks: The job uses event-time processing with watermarks derived from the CDC event’s source timestamp (the time the change occurred in PostgreSQL). We use a bounded-out-of-orderness strategy with a 30-second tolerance — events arriving more than 30 seconds late are still processed but do not advance the watermark.
Backpressure: If BigQuery writes slow down (throttling, temporary errors), Flink’s backpressure mechanism automatically slows the Pub/Sub reader. This prevents internal buffer overflow and propagates back to Pub/Sub, which simply holds messages until the consumer catches up.
5. BigQuery Schema and Write Strategy
5.1 Why Append-Only
BigQuery’s Storage Write API is fastest in append mode — no locking, no row-level lookups, no merge operations. For CDC pipelines, append-only also gives us a complete history of every change: we can see not just the current state of a record, but every state it has ever been in.
Every CDC event becomes a new row. An UPDATE in PostgreSQL does not update a row in BigQuery — it appends a new row with the updated values and the operation type u. A DELETE appends a row with operation type d. BigQuery tables grow continuously, but BigQuery is designed for exactly this pattern — petabyte-scale, append-heavy analytics.
5.2 Table Schema
Every BigQuery table follows the same pattern: the original table columns, plus metadata columns added by the pipeline. Here is the orders table as an example:
Source columns (preserved exactly from PostgreSQL, all nullable to handle DELETE events where after-state is null):
order_id          INT64       — primary key from PostgreSQL
customer_id       INT64       — foreign key to customers
order_date        TIMESTAMP   — when the order was placed
status            STRING      — order status (pending, shipped, delivered, etc.)
total_amount      NUMERIC     — order total
shipping_address  STRING      — delivery address
Metadata columns (added by the pipeline, prefixed with __ to distinguish from source columns):
__op              STRING      — operation type: c (create), u (update), d (delete), r (snapshot read)
__source_ts_ms    INT64       — epoch ms when the change occurred in PostgreSQL
__ingested_at     TIMESTAMP   — when the row was written to BigQuery by Flink
__source_table    STRING      — fully qualified source table (e.g., public.orders)
__transaction_id  STRING      — PostgreSQL transaction ID that produced this change
__lsn             INT64       — PostgreSQL Log Sequence Number — exact WAL position
5.3 Schema Conventions
These conventions apply to every table in the CDC dataset:
Metadata prefix — all pipeline-added columns use __ (double underscore). Source column names are preserved exactly; no renaming, no case changes.
Partitioning — every table is partitioned by __ingested_at (DAY). This limits scan volume for time-range queries and is critical for cost control since dashboards typically query recent data only.
Clustering — every table is clustered by the primary key column(s) and __op. This accelerates the deduplication views that filter WHERE __op != 'd' and group by primary key.
Partition expiration — set to 90 days (configurable per table). Partitions older than 90 days are automatically deleted, keeping storage costs bounded. Adjust per table based on retention needs.
Nullable columns — all source columns are nullable in BigQuery to handle DELETE events, where the after-state columns are null.
6. Making BigQuery Data Usable for Dashboards
The raw append-only tables contain every change event — but dashboards need the current state of each record, not the full history. This is where BigQuery views come in.
6.1 Latest-State Views
For each raw table, we create a SQL view that deduplicates to the latest state of each record. The view uses a ROW_NUMBER() window function to select the most recent event per primary key, excluding deletes.
CREATE OR REPLACE VIEW `project.dataset.orders_latest` AS
SELECT * EXCEPT(rn)
FROM (
    SELECT *,
        ROW_NUMBER() OVER (
            PARTITION BY order_id
            ORDER BY __source_ts_ms DESC
        ) AS rn
    FROM `project.dataset.orders_raw`
    WHERE __op != 'd'
)
WHERE rn = 1;
This view always reflects the latest non-deleted state of every order. Dashboards query orders_latest, not orders_raw.
When a record is deleted in PostgreSQL, Debezium emits a __op = 'd' event. The view's WHERE __op != 'd' clause excludes it. If a deleted record is later re-inserted (same primary key), the new c event has a newer __source_ts_ms and appears in the view.
6.2 How Dashboards and Downstream Systems Use This Data
The BigQuery data — both raw tables and latest-state views — can be consumed in several ways depending on the use case:
Direct dashboard connections. BI tools like Looker, Tableau, or Google Data Studio connect directly to the latest-state views. Since the views always reflect current data, dashboards show near-real-time information without any custom refresh logic. The view query runs on each dashboard load, which is acceptable for our data volume given BigQuery’s sub-second performance on clustered tables.
Scheduled aggregations. For dashboards that need pre-computed metrics (daily order counts, revenue by region, customer segmentation), scheduled queries in BigQuery or Airflow DAGs materialize aggregated tables. These read from the latest-state views and write to summary tables — trading real-time freshness for faster load times on complex aggregations.
Data science and ad-hoc analysis. The raw append-only tables provide a complete audit trail. Data scientists can query the full history of any record — when it was created, every update it received, when it was deleted. This is valuable for churn analysis, funnel tracking, and anomaly detection.
Cross-system data sharing. BigQuery’s authorized views and dataset-level IAM allow other teams to access CDC data without direct database access. Marketing, finance, and operations teams build their own queries against the latest-state views without any pipeline work.
Materialized views for high-frequency queries. For metrics queried hundreds of times per day (e.g., a live order count widget), BigQuery materialized views pre-compute and cache the result. They auto-refresh as underlying data changes, and BigQuery handles the incremental computation.
7. Airflow Orchestration
7.1 What the DAG Does
The Airflow DAG manages the lifecycle of the Flink streaming job on Dataproc. It does not orchestrate the data processing itself — that is Flink’s job. Airflow’s role is purely operational: ensure the cluster exists, submit the job, and verify it is running.
All configuration — cluster specs, Flink JAR paths, Pub/Sub subscription names, BigQuery dataset, parallelism settings — is stored in Google Secret Manager. The DAG reads these secrets at runtime, meaning no sensitive values or environment-specific config lives in the DAG code. This makes promotion across environments (dev → staging → prod) a matter of updating secrets, not rewriting the DAG.

7.2 DAG Tasks
**start** — Entry point. No-op trigger that marks the beginning of the DAG run.
**fetch_config** — Reads all pipeline configuration from Google Secret Manager: Dataproc cluster name, machine types, worker count, Flink JAR GCS path, checkpoint directory, Pub/Sub subscription, BigQuery dataset and project, parallelism settings, and any other environment-specific values. Everything downstream uses these fetched values.
**generate_flink_job_name** — Generates a unique job name for the Flink submission (typically a combination of a base name and a timestamp or run ID). This ensures each submission is independently trackable in Dataproc's job history and avoids naming collisions on retries.
**check_cluster_exists** — Checks whether the target Dataproc cluster is already running. This is a branching point — if the cluster exists, the DAG skips creation. If it does not, the next task handles provisioning.
**create_cluster_if_needed** — Provisions the Dataproc cluster using the configuration fetched from Secret Manager (machine types, disk sizes, Flink optional component, init actions for connector JARs, network settings). This task is skipped if the cluster already exists. Having this in the DAG means a cluster that was accidentally deleted or torn down during maintenance gets recreated automatically on the next DAG run.
**kill_delete_submit_and_verify_flink_job** — The core task. It performs four actions in sequence: (1) kills any existing Flink job on the cluster to avoid duplicate consumers, (2) deletes the old job entry from Dataproc, (3) submits the new Flink JAR with the fetched configuration (parallelism, checkpoint path, Pub/Sub subscription, BigQuery sink settings), and (4) verifies the job transitions to RUNNING state. If verification fails, the task fails and Airflow's retry policy kicks in.
**end** — Exit point. Marks successful completion of the DAG run.
7.3 DAG Configuration
schedule_interval = "@once"          # Triggered manually or by external event; not on a cron schedule
max_active_runs = 1                  # Prevents duplicate DAG instances from overlapping
retries = 3                          # Each task retries up to 3 times on failure
retry_delay = timedelta(minutes=5)   # 5 min cooldown between retries
catchup = False                      # No backfill of missed runs; streaming job should be running continuously
on_failure_callback = slack_and_pagerduty_alert  # Alerts the team on any task failure
8. Monitoring the Streaming Layer
8.1 Flink Job Metrics
Records processed/sec            — alert if < 100 for > 5 min (business hours). Processing has stalled or slowed dramatically.
Consumer lag (Pub/Sub)           — alert if oldest_unacked_message_age > 10 min. Flink is not keeping up with incoming events.
Checkpoint duration              — alert if > 5 min. Large state or slow GCS writes are causing checkpoint bottlenecks.
Checkpoint failure count         — alert if > 0 in last hour. Failed checkpoints = no consistent recovery point if the job crashes.
Task restart count               — alert if > 3 in last hour. Frequent restarts indicate a recurring failure (OOM, connectivity, bad data).
Backpressure ratio               — alert if > 500 ms/s sustained. The BigQuery sink cannot keep up, slowing the entire pipeline.
Parse error rate                 — alert if > 1% of total events. Suggests a schema change or data corruption upstream.
Source: Flink metrics exposed via Prometheus metric reporter (configured in flink-conf.yaml, port 9249). Prometheus scrapes all TaskManagers.
8.2 BigQuery Write Metrics
Rows written/sec                 — alert if < 100 for > 5 min. Writes stalled; could be API throttling, schema mismatch, or Flink failure.
Write errors/sec                 — alert if > 0 sustained. Any write error needs investigation — schema drift or permission issues.
Table size growth rate           — alert on unexpected plateau or spike. Plateau = data stopped. Spike = duplicates or backfill.
Slot utilization                 — alert if > 90% sustained (reserved slots). Dashboard queries may slow if slots are saturated by writes.
Source: BigQuery Storage Write API metrics and BigQuery admin metrics in Cloud Monitoring.
8.3 End-to-End Latency
Source-to-BigQuery latency       — measure as __ingested_at minus __source_ts_ms on recent rows. Alert if p95 > 60 seconds.
                                   This is the number dashboards care about: total time from database change to BigQuery availability.
Source-to-Pub/Sub latency        - Debezium metric: MilliSecondsBehindSource (from Part 1). Alert if > 30 seconds.
                                   First half of the pipeline falling behind.
Pub/Sub-to-BigQuery latency      - __ingested_at minus Pub/Sub publish timestamp. Alert if > 30 seconds.
                                   Second half of the pipeline falling behind.
8.4 Monitoring Infrastructure
Flink metrics:        Prometheus metric reporter → Prometheus instance scraping all TaskManagers on port 9249
Dataproc metrics:     Cloud Monitoring agent (pre-installed) → CPU, memory, disk exported automatically
BigQuery metrics:     Cloud Monitoring (enabled by default) → alert policies on write errors and slot utilization
Pub/Sub metrics:      Cloud Monitoring → oldest unacked age and DLQ count (configured in Part 1)
Alerting:             Cloud Monitoring alert policies → PagerDuty (critical) + Slack (warnings)
Dashboard:            Single Cloud Monitoring dashboard → Flink throughput, consumer lag, BQ write rate, e2e latency
Conclusion
The complete pipeline — from PostgreSQL WAL to BigQuery views — processes ~3,000 events per second at peak with sub-5-second end-to-end latency. In six months of production, we have seen zero data loss and 99.9% uptime.
The decisions that made this work:
Append-only writes to BigQuery eliminated write conflicts and made the Storage Write API blazingly fast. Views for deduplication kept the pipeline simple (just append) while giving dashboards clean, current-state data. Redis-backed offsets (Part 1) and Flink checkpoints to GCS ensured recovery from any failure without data loss. Flink’s keyed state made deduplication memory-efficient and scalable to millions of unique keys.
The pipeline has become the foundation for our analytics platform — every dashboard, report, and data product now runs on near-real-time CDC data instead of overnight batch loads.
Resources
메타데이터
- post_id
- 4efbca475089
- slug
- from-pub-sub-to-dashboard-ready-data-stream-processing-with-apache-flink-and-bigquery-part-2-4efbca475089
- url
- https://medium.com/meghgen/from-pub-sub-to-dashboard-ready-data-stream-processing-with-apache-flink-and-bigquery-part-2-4efbca475089
- canonical_url
- https://medium.com/meghgen/from-pub-sub-to-dashboard-ready-data-stream-processing-with-apache-flink-and-bigquery-part-2-4efbca475089
- author_url
- https://medium.com/@rishav-sarkar
- status
- ok
- fetched_at
- 2026-06-09 15:37:30