What is Dataplex? — Chapter 2
Introducing the Data Profiling
What is Dataplex? — Chapter 2
Introducing the Data Profiling
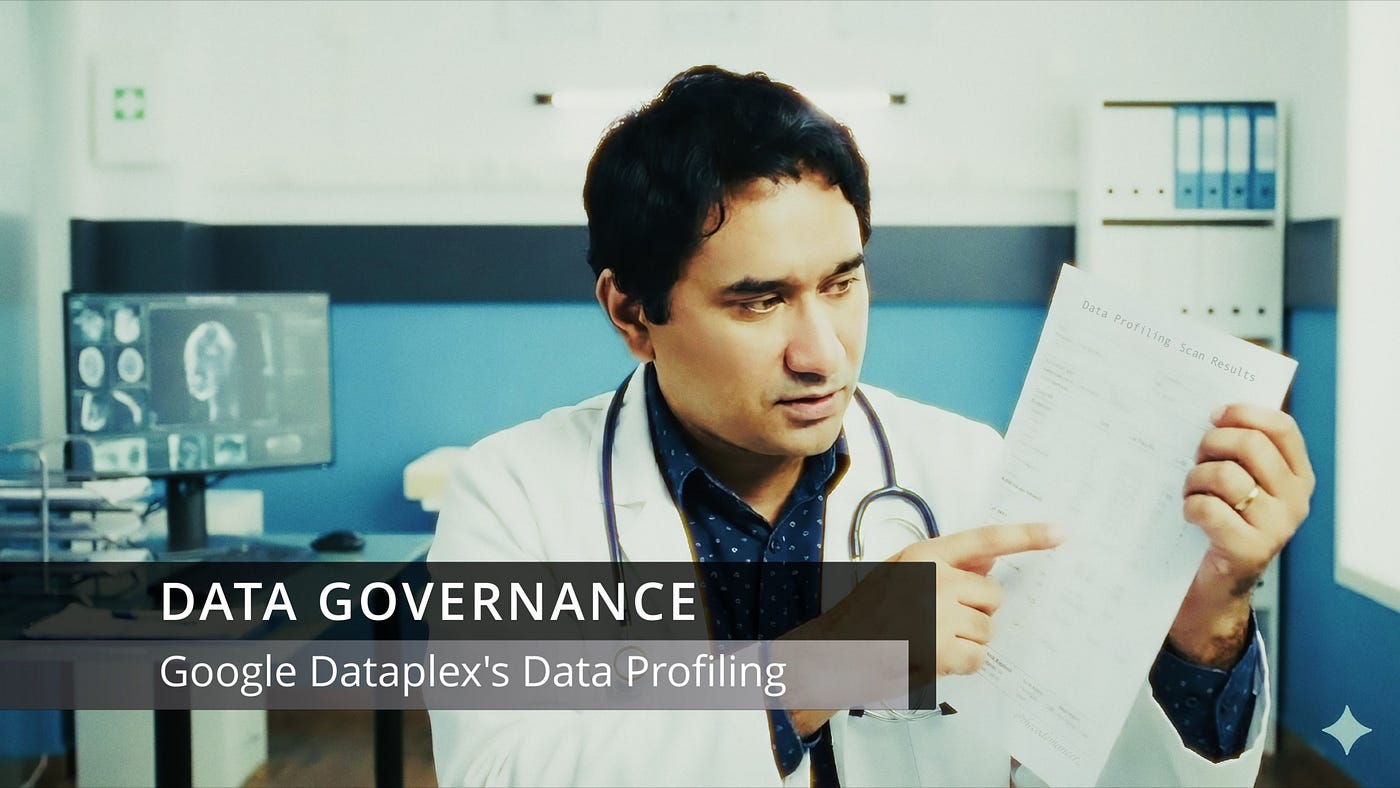
Image co-created by yours truly using Google’s Nano Banana Pro and other editing tools
Ever had that uneasy feeling your data might be lying to you? Imagine your data is a patient. Before you can diagnose an illness, you first need to see the charts. That is exactly what Google Dataplex’s Data Profiling feature does for your BigQuery tables.
In a nutshell, it automatically scans your datasets and reports back the raw statistics, such as distributions, null counts, and top values. This helps you understand the true shape of your data so you can build analytics on top of it.
By the end of this article, you’ll know what Dataplex Data Profiling is, why it’s a game-changer for data quality, how to run a profile scan (even with a code snippet!), and when it makes sense to use it (and its limitations).
Ready? Here we go.

The Joker uses Dataplex in his projects. That is a fact.
What is Dataplex Data Profiling (and why should I care)?
So, what exactly is this thing? In human terms, Dataplex’s data profiling is a feature of Google Cloud’s Dataplex Universal Catalog that helps you understand your data by automatically analyzing your BigQuery tables.
It tells you facts like:
- Completeness: How many values are null?
- Distribution: What is the average, median, and standard deviation of your numbers?
- Cardinality: What are the most common (top-N) values in this column?
The “Vital Signs” of your data
I like to think of Data Profiling as taking your data’s Vital Signs.
When you walk into a hospital, a nurse measures your heart rate and temperature before the doctor sees you. The nurse isn’t diagnosing you yet. They are just gathering the facts.
- Data Profiling (The Nurse): Observes the data. It says, “This column is 90% distinct. The average value is 500.”
- Data Quality (The Doctor): Judges the data. It says, “This column fails because it should be 100% distinct.”
Dataplex Profiling gives you that chart of vital signs. It allows analysts, engineers, and managers to click a button and instantly see a snapshot of the data’s current state without writing a single line of SQL.
Wait, isn’t this Data Quality? Not quite! It is a common confusion.
- Data Profiling is Descriptive. It tells you what the data looks like (e.g., “10% of rows are null”).
- Data Quality is Prescriptive. It enforces rules on what the data should be (e.g., “Fail the pipeline if nulls > 0%”).
Why does this matter?
Because in the age of AI and analytics, you cannot trust what you have not measured. Instead of eyeballing spreadsheets or writing tons of SQL to compute means, counts, and find outliers manually, Dataplex automates the discovery.
It is a serverless, BigQuery-powered scan. There is no infrastructure to set up —no Hadoop or Spark clusters to deploy and manage — and it runs at petabyte scale using managed Google compute resources. This means you get a complete picture of your data with zero impact on your existing BigQuery slot reservations.
I’m not making this up, check out this post after finishing reading this one.
In practice, that means analysts, data engineers, or even savvy managers can click a button (or call an API) and instantly get a snapshot of data health. Kind of like seeing all your vital signs on a monitor.
How Dataplex works under the hood
Allow me to get a bit technical. I’ll keep it in plain English.
Under the hood, Dataplex Data Profiling works by creating a Data Profile Scan, which is a type of Dataplex Data Scan. Basically, you tell Dataplex: “Here’s my BigQuery table — or view, or BigLake table, or external table — go analyze it.” Dataplex then spins up a job that reads the table and computes all those statistics.
Crucially, this is fully managed. You don’t provision clusters or compute; Google handles the heavy lifting behind the scenes. It even integrates with BigQuery’s UI and ecosystem. In fact, you can set it up from the Dataplex console or directly in the BigQuery console and results will show up next to your table in BigQuery once the scan is done. The results can also be exported to a BigQuery table, making it easy to build dashboards in Looker or Looker Studio.
You also get significant flexibility.
- Scheduling: You can run scans on demand or set a recurring schedule.
- Scope: You can profile the full table or just a sample, such as 1%.
- Filters: You can apply row filters. For example, you might only want to profile data where
transaction_date >= '2024-01-01'. - Output: You can export results to a separate BigQuery table. This makes it easy to build historical dashboards in Looker or Looker Studio.
Dataplex uses a special service agent to run these scans. You must grant it specific BigQuery permissions, such as BigQuery Job User and BigQuery Data Viewer. Once set up, it works seamlessly.
Dataplex hands-on examples
Creating a profile scan using the BigQuery UI

Data Profiling example using the BigQuery UI. Pretty neat, right?
Creating a profile scan using Python
Let’s see it in action with a (simplified) code example. Imagine I have a BigQuery table myproject.spotify_data.tracks. I want to profile it.
Here is how the Dataplex client library handles it:
from google.cloud import dataplex_v1

# Import the types submodule for access to nested messages
from google.cloud.dataplex_v1 import types

client = dataplex_v1.DataScanServiceClient()
project = "[PROJECT]"
location = "us-central1"
table_path = f"//bigquery.googleapis.com/projects/{project}/datasets/spotify_data/tables/tracks"

# Define the DataScan object with profiling spec
data_scan_body = types.DataScan(
    display_name="tracks-profile",
    data_profile_spec=types.DataProfileSpec(
        sampling_percent=90.0
    ),
    data=types.DataSource(
        resource=table_path
    )
)

parent = f"projects/{project}/locations/{location}"

# Create the data profile scan
print("Creating DataScan...")
create_operation = client.create_data_scan(parent=parent, data_scan_id="tracks-profile", data_scan=data_scan_body)
data_scan_resource = create_operation.result()
print(f"Created DataScan: {data_scan_resource.name}")

# Run the scan
scan_name = data_scan_resource.name
print(f"Starting scan job for: {scan_name}...")

# client.run_data_scan returns an Operation object (run_operation)
run_operation = client.run_data_scan(name=scan_name)

# retrieving the name of the job. Something like projects/[PROJECT]/locations/us-central1/dataScans/tracks-profile/jobs/746ce5ed-2aeb-4890-9399-72013e1aefde
job_name = run_operation.job.name

print(f"Scan job completed. Job name: {job_name}")
What’s happening here? First, I import the Dataplex client. Then I specify my BigQuery table via its full resource path (projects/…/tables/tracks). I create a DataScan object with a DataProfileSpec, telling it I want to scan 90% of the data (you could set this lower to save cost). The data field points to my BigQuery table. Then I call create_data_scan to register this scan with Dataplex (the .create_data_scan(...).result() would wait until creation is done). Finally, I run the scan with run_data_scan, which kicks off the actual job.

Screenshot of the Dataplex data scan execution. It works!
Once this runs, Dataplex will process the tracks table. In a few minutes (depending on size), it’ll finish and publish stats. I could then fetch the results via API or just look in the Dataplex/BigQuery console to see the report (did I mention that you can also export the results to a BigQuery table and even connect it to a Looker dashboard?).
If we go check the BigQuery UI after a moment, under the table’s Data Profile tab we’ll see a dashboard: null rates, histograms, top values, etc. All generated for us.
How much does Dataplex Data Profiling costs?
The cost has two components: metadata storage and processing.
- For metadata storage, the cost is as low as $2.00 per 1 GiB per month.
- For processing, it’s $0.089 per hour if you choose Iowa (us-central1) as your region.
Dataplex Data Profiling Cost Exercise
Q: Let’s say you have 100 tables you want to scan using the Iowa region. If you ran Data Profiling scans daily for each table during the month, and each scan took 1 minute, and the total accumulated metadata is 0.5 GiB, how much the cost will be?
Let’s think…
First, let’s calculate storage:
- $2.00 per 1 GiB per month *** 0.5 GiB = $1.00
Next, let’s calculate processing time:
- 1 scan per table 100 tables 1 minute duration * 30 days = 3000 minutes = 50 hours
Now, the processing cost:
- $0.089 per hour * 50 hours = $4.45
Total Monthly Bill:
- Total = $4.45 + $1.00 = $5.45
A: The billing associated with these Data Profiling scans will be $5.45. For roughly the price of a fancy latte, you can automatically profile 100 tables every day for a month.
Dataplex Profiling vs. The Alternatives
You might wonder: don’t other tools or queries do this? Sure, you could manually write a bunch of SELECT COUNT(DISTINCT col), AVG(col), etc. or use Python and Pandas. There are also open-source tools like Great Expectations or commercial data observability platforms. But Dataplex’s offering is tailored for BigQuery on GCP. Its big pluses:
- Integration: It plugs right into BigQuery and Dataplex. No need to export data or set up clusters. After running, results appear in the same console you already use.
- Scalability and Zero Setup: Unlike spinning up an Spark job yourself, Dataplex profiling is serverless. Google handles scaling to petabytes without charging you for overhead. It’s ready out of the box (you just enable the APIs and grant a service account) and then click-run. No servers, no clusters, no waiting.
- Flexibility: It’s not just one static tool. Besides the UI, you can script it or use DevOps tools. Google provides a Terraform operator, Python/Java client libraries, a CLI, and even YAML config support. So if your workflow is IaC or custom code, Dataplex profiling fits right in. (There’s also Airflow/DAG support if you want scanning in your ETL pipelines.)
- Advanced features: You get built-in sampling, filters, and the ability to rerun only new data. You can profile views or tables. It even supports BigLake and external tables, so if your data sits in BigLake or as an external table in Cloud Storage, Dataplex can profile it too. These extras mean you can profile your data wherever it lives in GCP, without manually copying it around.
My take: Pros, cons, and a verdict
So, what do I think? Well, I’m pretty impressed. Dataplex Data Profiling ticks a lot of boxes:
- Pros: It’s easy to start (zero setup), fully managed, and deeply integrated with BigQuery. I love that I can run scans right from the BigQuery UI or console and see results alongside my tables. The stats it produces are genuinely useful. For example, spotting that “weird” 5% of values are null or that 80% of our users are from just 2 countries. These insights let me catch anomalies or decide where to focus cleaning efforts. I can throw the results into Looker for a dashboard or even feed them into a model (say, for drift detection).
- Cons: It’s somewhat of a newcomer, so some wrinkles exist. For example, you do need to know that special “Dataplex service account” dance (grant it BigQuery JobUser/DataViewer roles) the first time. Also, while Dataplex now handles BigQuery, BigLake, and external tables, it doesn’t (yet) profile things like Bigtable, Cloud SQL, or non-BigQuery sources. And the one unsupported type is BIGNUMERIC, so if you have those high-precision fields, you’ll need a workaround or cast them. Lastly, like any automated tool, it’s not context-aware. If your data has business rules (e.g. a salary column should never be negative), profiling won’t know to flag that — it’ll just give you the stats.
On balance, I love that Google Cloud added this. For anyone moving big data fast, having automated profiling is a timesaver. It’s not “ergo you can skip all data quality work,” but it does make the first pass so much easier.
My Recommendation
Give it a try. See what surprises it finds. I bet you’ll discover things you didn’t know about your data.
If this is not exciting enough for you, then let me tell you that this output can be taken as input for two additional services that provides value at a different higher level:
- BigQuery Data Insights
- Dataplex Data Quality
But we’ll cover those in another article.

So, what do you think? Have you tried Dataplex Data Profiling? Does your organization need a “nurse” to check the vital signs of your BigQuery tables? Let me know your thoughts! 👇
🎁 Resources for You

- About data profiling
- Create and use data profile scans
- Deliver trusted insights with Dataplex data profiling and automatic data quality
- Google Dataplex Operators for Apache Airflow
👋 If this was helpful, give it a few claps and a follow. More posts are on the way about data management, governance, and the real-world stuff that keeps modern data platforms running smoothly.
- It costs nothing to support a creator. Just hold down that 👏 button until you see 50 pop up.
- Follow David Regalado for more educational content and stuff!
- For more things that I do, visit https://bento.me/thecodemancer-davidregalado.
Thank You For Reading. How About Another Article?
[embed]What is Dataplex? — Chapter 1 Introducing the Business Glossarymedium.com
메타데이터
- post_id
- 4efea982e433
- slug
- what-is-dataplex-chapter-2-4efea982e433
- url
- https://medium.com/google-cloud/what-is-dataplex-chapter-2-4efea982e433
- canonical_url
- https://medium.com/google-cloud/what-is-dataplex-chapter-2-4efea982e433
- author_url
- https://medium.com/@davidregalado255
- status
- ok
- fetched_at
- 2026-07-07 09:05:48