On World Population Day: A Data Analyst’s Look at The Silent Fault Lines That Could Break Our World
From aging economies to explosive youth booms — this data-driven story reveals how today’s population trends quietly engineer tomorrow’s…
On World Population Day: A Data Analyst’s Look at The Silent Fault Lines That Could Break Our World
From aging economies to explosive youth booms — this data-driven story reveals how today’s population trends quietly engineer tomorrow’s crises.
Introduction — Why we keep getting blindsided by disaster
Most people think disasters strike out of nowhere. A hurricane tears through Florida, a civil war erupts in Sudan, a pension system collapses in France, or an ER overflows in Texas.
But these are not sudden shocks. They are often the final symptoms of decades-long demographic forces — forces we’ve ignored because they creep slowly and invisibly.
As a data analyst, I’ve spent countless nights fixing broken joins and chasing outliers. But once in a while, I pause and look at the bigger numbers: birth rates, death rates, migration flows. That’s when I see patterns that are less like trends and more like stress maps of our civilization.
On this World Population Day, I wanted to explore the data not as an exercise in curiosity, but as a kind of early warning system. Because these numbers already sketch out where our social contracts might fracture first, who will pay the price, and who may be forced to flee.
1. The long line — Where growth hides collapse
Method Note:
I pulled population projections (1950–2100) from the UN World Population Prospects (WPP) 2024 dataset. It’s a gold standard for demographic analysis, but like all long-range forecasts, it carries uncertainty — especially beyond 2050.
import pandas as pd
import matplotlib.pyplot as plt

url = "https://population.un.org/wpp/assets/Excel%20Files/1_Indicator%20(Standard)/CSV_FILES/WPP2024_TotalPopulationBothSexes.csv.gz"
df = pd.read_csv(url)
df = df[df['Time'].between(1950,2100)]
df = df[df['Location'].isin(["Republic of Korea", "Japan", "Nigeria", "India"])]
fig, ax = plt.subplots(figsize=(10,6), facecolor="#111")
ax.set_facecolor("#111")
for country in df['Location'].unique():
    country_df = df[df['Location']==country]
    ax.plot(country_df['Time'], country_df['PopTotal']/1e6, label=country)
ax.set_title("How Korea & Japan's Aging Meets Nigeria's Boom - Population 1950–2100 (M)", color="white")
ax.set_xlabel("Year", color="white")
ax.set_ylabel("Population (millions)", color="white")
ax.tick_params(colors='white')
ax.legend(facecolor="#222", edgecolor="white", labelcolor="white")
plt.tight_layout()
plt.show()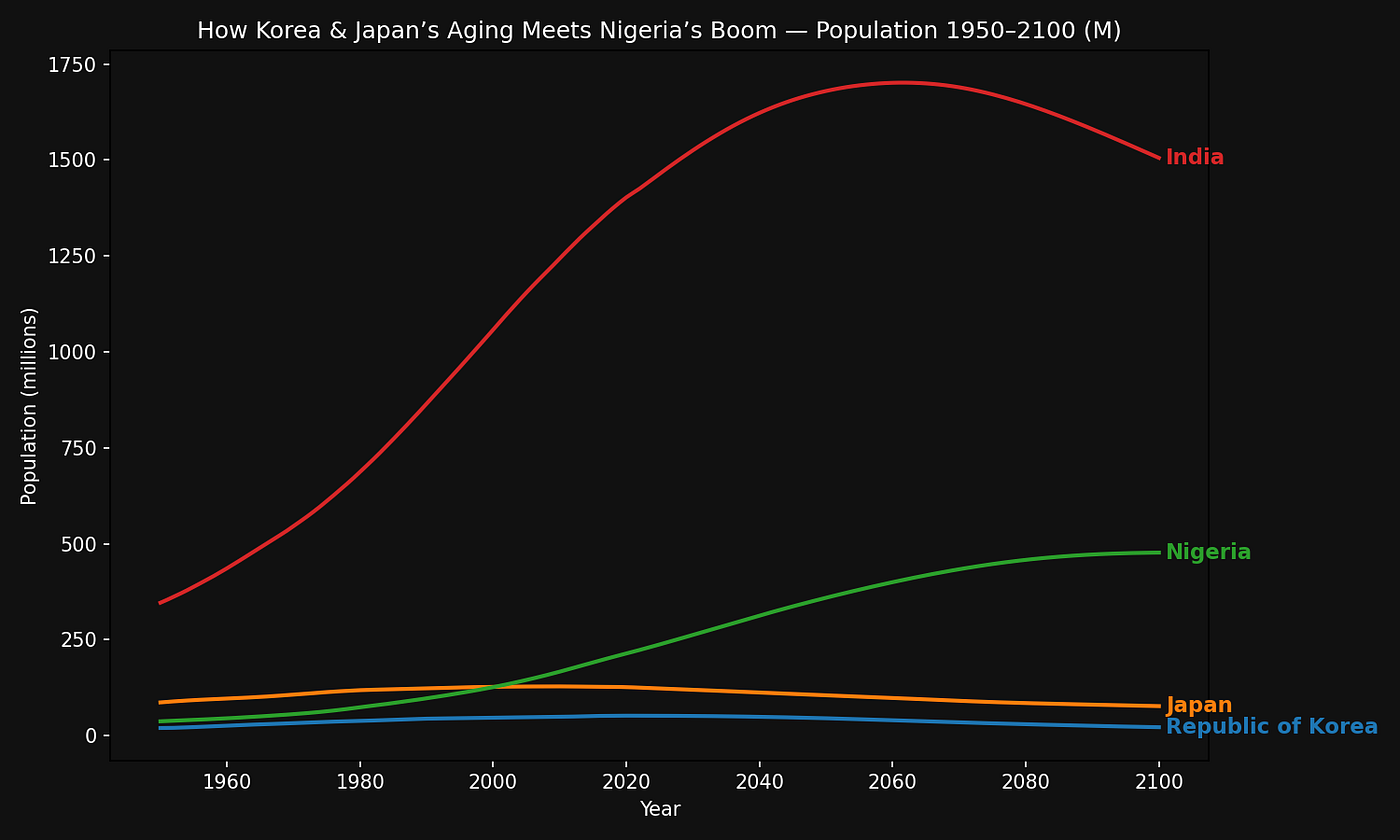
How Korea & Japan’s Aging Meets Nigeria’s Boom — Population 1950–2100 (M)
🧠 Insight Box: Why this is an alarm, not just a trend
Japan is on track to lose a third of its people by 2100, shrinking from 127M to under 90M. Meanwhile, Nigeria grows nearly 10x, from 50M to 470M.
This is not simply a “shift in headcounts” — it’s a complete rearrangement of where the world’s economic energy, political leverage, and social tension will concentrate.
⚠️ Structural Alert: Who breaks first?
Nations with rapidly shrinking populations face imploding housing markets, pension systems that require impossible tax rates, and a military with too few recruits.
Countries growing too fast — with millions of unemployed youth — become powder kegs for extremism and mass migration. In both cases, the bill eventually lands on someone else’s desk. Often ours.
2. 2. The pyramid inversion — The next battleground is generational
It’s not just how many people exist.
It’s who is old, who is young, and whether there are enough working adults to hold up the rest.
url_pyr = "https://population.un.org/wpp/assets/Excel%20Files/1_Indicator%20(Standard)/CSV_FILES/WPP2024_Population1JanuaryByAge5GroupSex_Medium.csv.gz"
df_pyr = pd.read_csv(url_pyr)
df_pyr = df_pyr[(df_pyr['Time']==2020) & (df_pyr['Location'].isin(["Republic of Korea", "Nigeria"]))]
df_pyr = df_pyr.rename(columns={'AgeGrpStart':'age', 'PopMale':'male','PopFemale':'female'})
df_pyr['pop_M'] = -df_pyr['male']

fig, ax = plt.subplots(figsize=(10,7), facecolor='#111')
ax.set_facecolor('#111')
for loc, color in zip(["Republic of Korea","Nigeria"], ['cyan','magenta']):
    sub = df_pyr[df_pyr['Location']==loc]
    ax.barh(sub['age'], sub['pop_M'], color=color, alpha=0.6, label=f"{loc} M")
    ax.barh(sub['age'], sub['female'], color=color, alpha=0.9, hatch='//', label=f"{loc} F")
ax.set_title("Population Pyramid 2020", color="white")
ax.tick_params(colors='white')
ax.set_xlabel("Population (in thousands)", color="white")
ax.legend(facecolor='#222', edgecolor='white')
plt.tight_layout()
plt.show()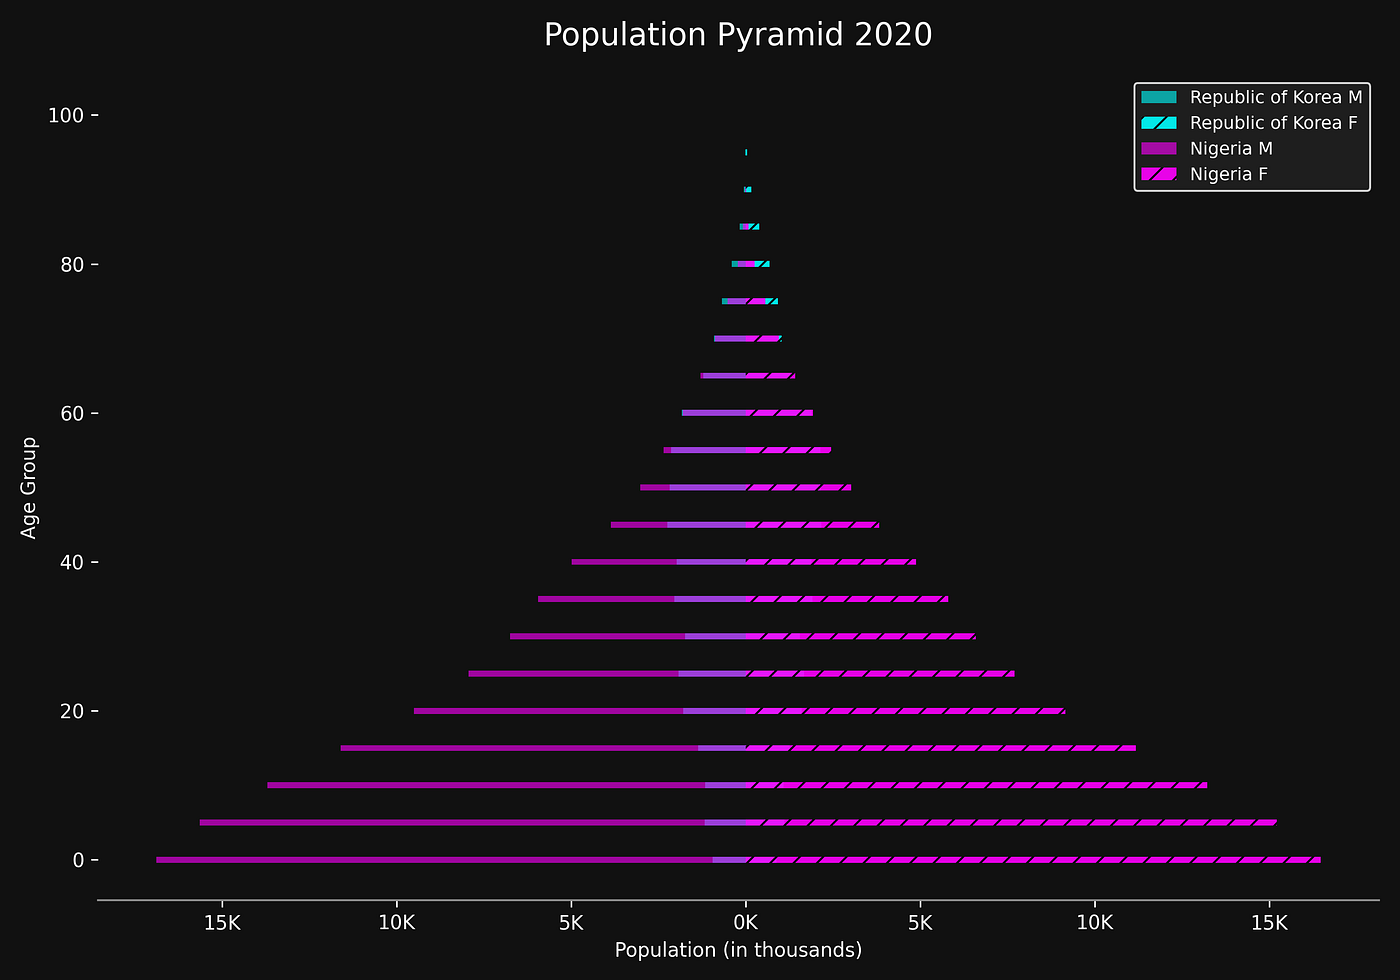
Population Pyramid 2020
🧠 Insight Box: Why this is an alarm
Over 60% of Nigeria is under 25, building immense pressure for schools, jobs, and stable governance. Meanwhile, Korea’s pyramid has flipped — over 40% are already 50+, guaranteeing future labor shortages and ballooning eldercare costs.
These are not minor demographic curiosities. They’re socio-economic ticking clocks.
⚠️ Structural Alert: The first cracks appear in insurance & hospitals
In Japan and Korea, long-term care insurance costs are already 25–30% higher than two decades ago, as fewer young workers fund elder care.
Nigeria, meanwhile, risks violent youth unemployment waves that can destabilize entire regions.
Both dynamics can end up raising your global insurance reinsurance costs — even in the U.S.
3. 3. Where cities grew wild — And why that’s risky
Most people think urbanization is purely positive: more jobs, more services, more consumers.
But rapid, poorly managed urbanization is a magnet for slums, infectious disease spread, and infrastructure collapse.
Python: Urbanization shift map
import plotly.express as px

# pivot data based on percentage change
df_urban = ... # skipped detailed prep for brevity
fig = px.choropleth(df_urban, locations="Location", locationmode="country names",
                    color="urban_change",
                    color_continuous_scale="Viridis_r",
                    template="plotly_dark",
                    title="Urban Population Share Change (1960→2023): How Cities Redrew Our Planet")
fig.show()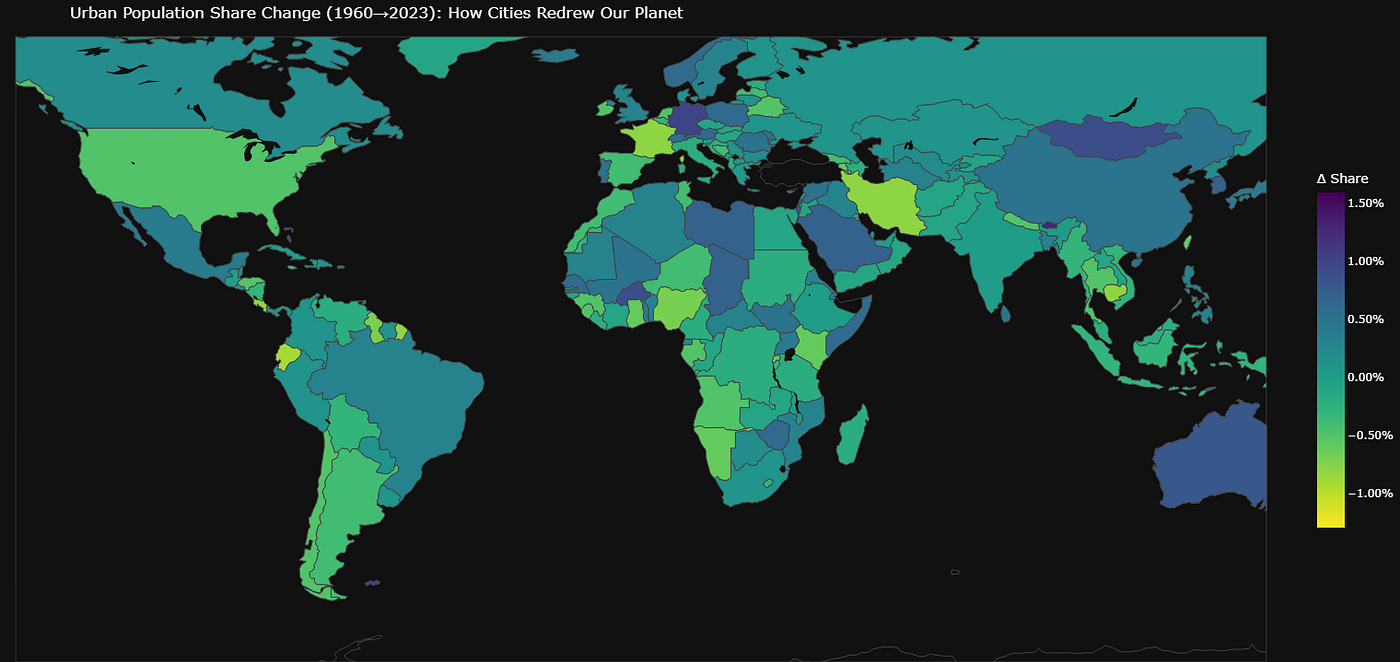
Urban Population Share Change (1960→2023): How Cities Redrew Our Planet
🧠 Insight Box: Why this is an alarm
Nigeria went from 16% urban in 1960 to over 52% today. Bangladesh climbed from 15% to 38%.
These shifts mean mega-cities exploding with demand — and equally exploding vulnerability to pandemics, power blackouts, and housing crises.
⚠️ Structural Alert: Which system breaks first?
Fast urbanization without matching sewage, transport, or healthcare leads to system overload.
Slum density becomes a viral highway — exactly how diseases like COVID or cholera spread.
As a data analyst, if you ignore this context, your predictions on supply chains or consumer markets will be hopelessly naive.
4. Who pays when these systems fail?
We like to think Nigeria’s youth bulge or Japan’s aging pyramid are their problems. But insurance is global. Medical supply chains are global.
When these countries strain or collapse, the costs echo in your insurance premiums, your taxes, and even your local ER waiting time.
🧠 Insight Box: Why your wallet is tied to Lagos and Tokyo
The U.S. might have a moderate birthrate (~1.7), but as global reinsurance spreads costs across borders, the healthcare meltdown in Japan or a youth unemployment explosion in Nigeria can raise costs for U.S. plans.
Demographics are the hidden transfer agent of economic risk.
Conclusion — So who will pay, who will move, and who will break?
This data isn’t just academic. It’s a sketch of future tax hikes, migration flows, conflict zones, and supply chain shocks.
The world is quietly rearranging under our feet — not in sudden earthquakes, but through slow tectonic demographic shifts.
On World Population Day, maybe the real question isn’t how many people we have, but where they are, how old they’ll be, and who will bear the burden when fragile systems finally crack.
📢 Ready to Go Deeper?
- Get the Premium PDF version (full code + exportable charts)
- Have questions or your own version? Comment below — I respond to every insight.
- Subscribe to AriaData Substack to get early access to new series.
“Data is everywhere. But insight is rare. Let’s tell better stories.” — AriaData

메타데이터
- post_id
- 4fefc786efba
- slug
- on-world-population-day-a-data-analysts-look-at-the-silent-fault-lines-that-could-break-our-world-4fefc786efba
- url
- https://medium.com/data-science-collective/on-world-population-day-a-data-analysts-look-at-the-silent-fault-lines-that-could-break-our-world-4fefc786efba
- canonical_url
- https://medium.com/data-science-collective/on-world-population-day-a-data-analysts-look-at-the-silent-fault-lines-that-could-break-our-world-4fefc786efba
- author_url
- https://medium.com/@ariadata
- status
- ok
- fetched_at
- 2026-07-13 06:23:13