Walking An Application — TryHackMe Walkthrough
16.05.2026
Walking An Application — TryHackMe Walkthrough
16.05.2026
Web application security starts with understanding how an application behaves, how users interact with it, and where vulnerabilities may exist beneath the surface.
In this walkthrough, I’ll be solving the TryHackMe room Walking An Application, a room designed to introduce the fundamentals of web application enumeration and analysis.
Rather than rushing directly into exploitation, this room focuses on developing the mindset needed to properly inspect and understand a web application before attacking it.
Throughout this walkthrough, I’ll cover:
- Mapping the application structure
- Inspecting pages and functionality
- Understanding how information is exposed
- Using browser-based reconnaissance techniques
- Key observations made during the assessment
Disclaimer
This walkthrough is intended for educational purposes only. All actions demonstrated were performed within the legal TryHackMe lab environment.
Task 1: Walking An Application
In this room you will learn how to manually review a web application for security issues using only the in-built tools in your browser. More often than not, automated security tools and scripts will miss many potential vulnerabilities and useful information.
Here is a short breakdown of the in-built browser tools you will use throughout this room:
- View Source — Use your browser to view the human-readable source code of a website.
- Inspector — Learn how to inspect page elements and make changes to view usually blocked content.
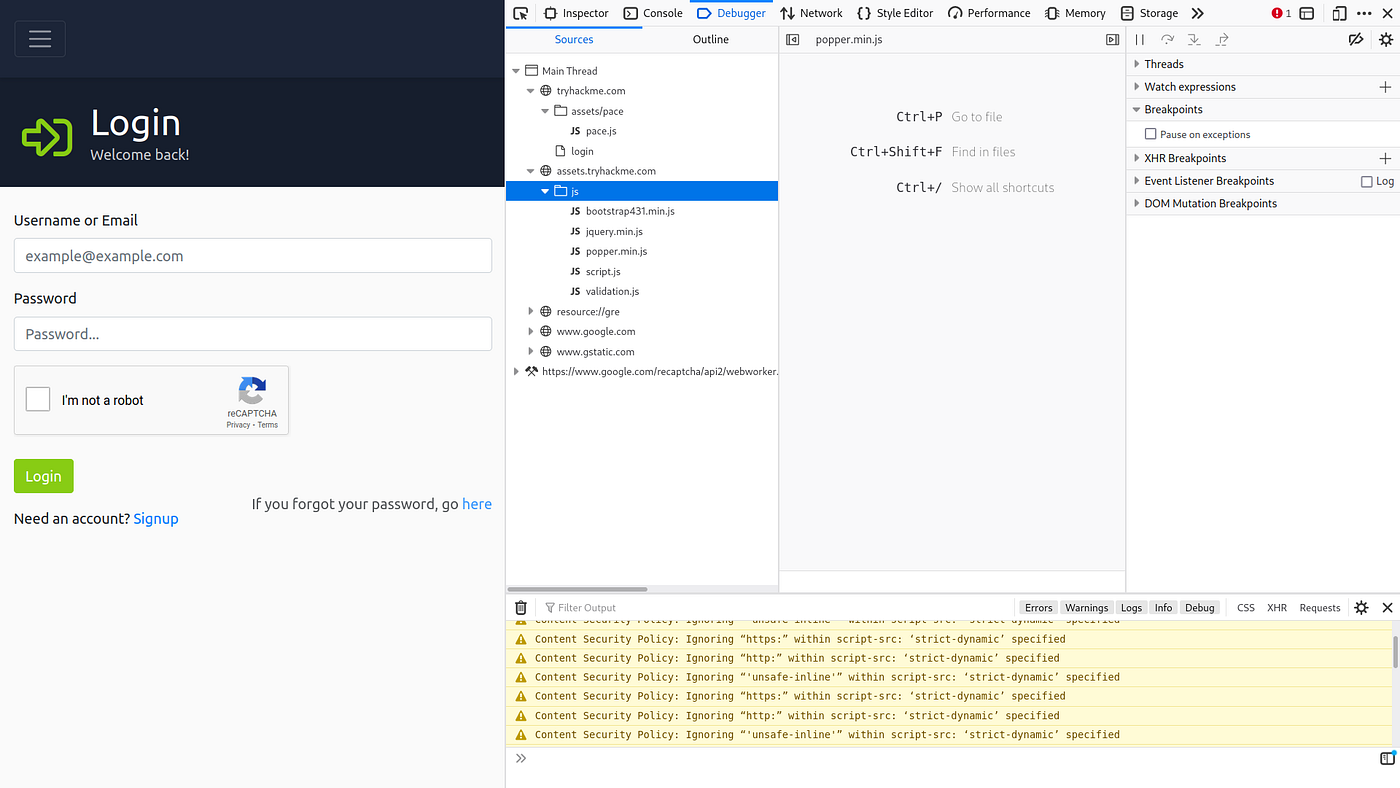
- Debugger — Inspect and control the flow of a page’s JavaScript
- Network — See all the network requests a page makes.
Press the “Start Machine” button to start the virtual machine on this task, then wait 2 minutes, and visit the following URL: https://LAB_WEB_URL.p.thmlabs.com (opens in new tab) (opens in new tab) (this URL will update 2 minutes from when you start the machine)
Answer the questions below
I confirm that I have deployed the virtual machine and opened the website.
Answer : No answer needed. Press Complete.
Task 2: Exploring The Website
As a penetration tester, your role when reviewing a website or web application is to discover features that could potentially be vulnerable and attempt to exploit them to assess whether or not they are. These features are usually parts of the website that require some interactivity with the user.
Finding interactive portions of the website can be as easy as spotting a login form to manually reviewing the website’s JavaScript. An excellent place to start is just with your browser exploring the website and noting down the individual pages/areas/features with a summary for each one.
An example site review for the Acme IT Support website would look something like this:

Answer the questions below
Answer — No answer needed. Read all that and press Complete.
Task 3: Viewing The Page Source
The page source is the human-readable code returned to our browser/client from the web server each time we make a request.
The returned code is made up of HTML ( HyperText Markup Language), CSS ( Cascading Style Sheets ) and JavaScript, and it’s what tells our browser what content to display, how to show it and adds an element of interactivity with JavaScript.
For our purposes, viewing the page source can help us discover more information about the web application.
How do I view the Page Source?
- While viewing a website, you can right-click on the page, and you’ll see an option on the menu that says View Page Source.
- Most browsers support putting view-source: in front of the URL for example, view-source:https://www.google.com/
- In your browser menu, you’ll find an option to view the page source. This option can sometimes be in submenus such as developer tools or more tools.
Let’s view some Page Source!
Right-click on the page and click on “view source page” or use “ctrl + u”.


Answer the questions below
Q1: What is the flag from the HTML comment?
At the top of the page, you’ll notice some code starting with <!-- and ending with --> these are comments. Comments are messages left by the website developer, usually to explain something in the code to other programmers or even notes/reminders for themselves. These comments don't get displayed on the actual webpage. This comment describes how the homepage is temporary while a new one is in development. View the webpage in the comment to get your first flag
Viewing the TOP of the source code we have a comment which gives us a name of a directory: “/new-home-beta”.
Now lets try using this directory on the website.


Answer: THM{HTML_COMMENTS_ARE_DANGEROUS}
Q2: What is the flag from the secret link?
Reading the question, it looks like the flag is in the secret-page. Let’s check it out.

Click on the “/secret-page”

Answer: THM{NOT_A_SECRET_ANYMORE}
Q3: What is the directory listing flag?
To answer this question, we have go through the directories to get the flag.


Click on the flag.txt

Answer: THM{INVALID_DIRECTORY_PERMISSIONS}
Q4: What is the framework flag?
Reading through the source code at the last line of the code there is a link in the comment. URL: https://static-labs.tryhackme.cloud/sites/thm-web-framework

Copy the directory “/tmp.zip” and go through the website which automatically downloaded named as “tmp.zip”. In the folder there is a .txt file named as flag.txt by open the file we got our 4th flag.

Answer: THM{KEEP_YOUR_SOFTWARE_UPDATED}
Task 4: Developers Tools — Inspector
Inspector
The page source doesn’t always represent what’s shown on a webpage; this is because CSS, JavaScript and user interaction can change the content and style of the page, which means we need a way to view what’s been displayed in the browser window at this exact time. Element inspector assists us with this by providing us with a live representation of what is currently on the website.
As well as viewing this live view, we can also edit and interact with the page elements, which is helpful for web developers to debug issues.
On the Acme IT Support website, click into the news section, where you’ll see three news articles.
The first two articles are readable, but the third has been blocked with a floating notice above the content stating you have to be a premium customer to view the article. These floating boxes blocking the page contents are often referred to as paywalls as they put up a metaphorical wall in front of the content you wish to see until you pay.

Answer the questions below
What is the flag behind the paywall?
Inspect the website:

Change the display to none:

Answer: THM{NOT_SO_HIDDEN}
Task 5: Developer Tools — Debugger
This panel in the developer tools is intended for debugging JavaScript, and again is an excellent feature for web developers wanting to work out why something might not be working. But as penetration testers, it gives us the option of digging deep into the JavaScript code. In Firefox and Safari, this feature is called Debugger, but in Google Chrome, it’s called Sources.
On the Acme IT Support website, click on the contact page, each time the page is loaded, you might notice a rapid flash of red on the screen. We’re going to use the Debugger to work out what this red flash is and if it contains anything interesting. Debugging a red dot wouldn’t be something you’d do in the real world as a penetration tester, but it does allow us to use this feature and get used to the Debugger.
Qn: What is the flag in the red box?
Let’s inspect the page and click the debugger button. In the source section there are many files under /assets folder one of them known as flash.min.js in the bottom of the JS file “flash[‘remove’]” is written thats why the red box is pop up and removed.

If you click the line number that contains the above code, you’ll notice it turns blue; you’ve now inserted a breakpoint on this line. Now try refreshing the page, and you’ll notice the red box stays on the page instead of disappearing, and it contains a flag.

Answer: THM{CATCH_ME_IF_YOU_CAN}
Task 6: Developer Tools — Network
The network tab on the developer tools can be used to keep track of every external request a webpage makes. If you click on the Network tab and then refresh the page, you’ll see all the files the page is requesting.
Try doing this on the contact page; you can press the trash can icon to delete the list if it gets a bit overpopulated.
With the network tab open, try filling in the contact form and pressing the Send Message button. You’ll notice an event in the network tab, and this is the form being submitted in the background using a method called AJAX. AJAX is a method for sending and receiving network data in a web application background without interfering by changing the current web page.
Answer the questions below
What is the flag shown on the contact-msg network request?

Answer: THM{GOT_AJAX_FLAG}
Conclusion
Walking An Application was a solid introduction to the importance of reconnaissance in web application security.
One of the biggest lessons from this room is that understanding how an application works is often more valuable than immediately searching for exploits. Careful observation, directory exploration, and analyzing exposed information can reveal a surprising amount about a target.
This room reinforces a key cybersecurity principle:
Good enumeration creates good opportunities.
Overall, this was a great beginner-friendly room for practicing web application analysis and building a structured testing methodology.
Thanks for reading, and I hope this walkthrough helped you better understand the fundamentals of web application reconnaissance.
메타데이터
- post_id
- 5354797e45f3
- slug
- walking-an-application-tryhackme-walkthrough-5354797e45f3
- url
- https://medium.com/@timiphil9/walking-an-application-tryhackme-walkthrough-5354797e45f3
- canonical_url
- https://medium.com/@timiphil9/walking-an-application-tryhackme-walkthrough-5354797e45f3
- author_url
- https://medium.com/@timiphil9
- status
- ok
- fetched_at
- 2026-06-09 15:37:30