From Prometheus to a Kafka-Native Metrics Pipeline with Grafana Mimir and OpenTelemetry
Modern platforms outgrow single-node monitoring faster than most teams expect. At first, a local Prometheus server is enough: scrape a few…
From Prometheus to a Kafka-Native Metrics Pipeline with Grafana Mimir and OpenTelemetry
Modern platforms outgrow single-node monitoring faster than most teams expect. At first, a local Prometheus server is enough: scrape a few exporters, keep metrics on disk, build dashboards in Grafana, and move on. But as environments expand across Kubernetes, virtual machines, infrastructure exporters, and application telemetry, the old model starts to crack. Storage becomes fragile, scaling becomes awkward, and the monitoring stack itself turns into something that needs monitoring.

This is where a distributed architecture built on OpenTelemetry, Kafka, and Grafana Mimir becomes compelling.
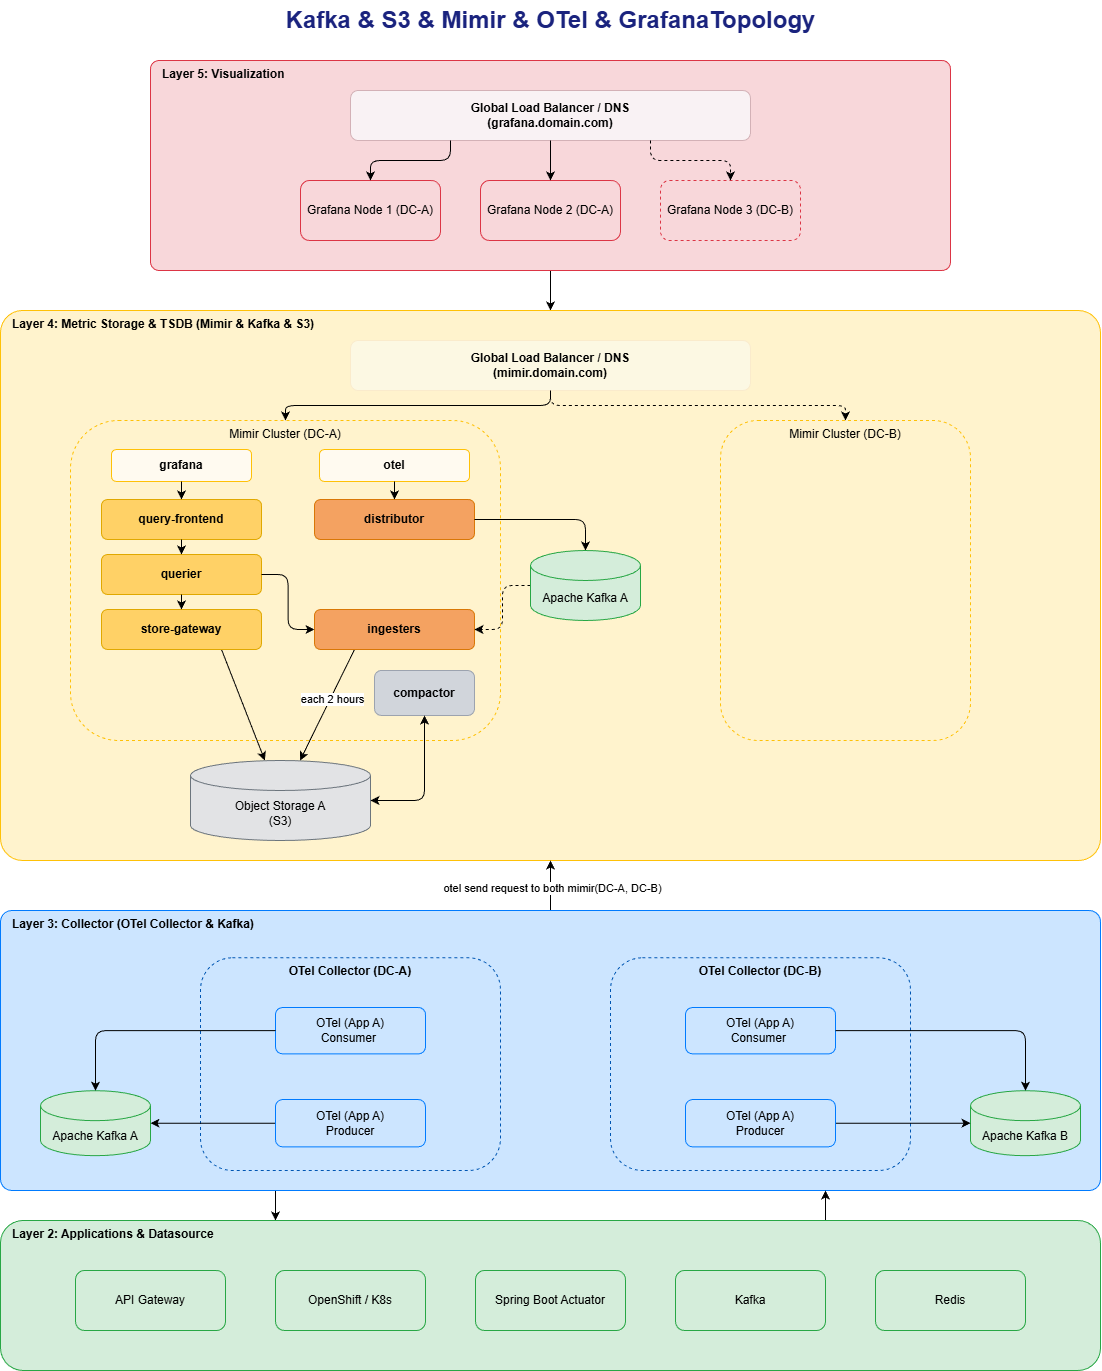
In our case, the goal was simple: replace a standalone Prometheus server with a more scalable pipeline. Instead of relying on Prometheus as both scraper and long-term storage engine, we moved metric collection to OpenTelemetry, used Kafka as the transport layer, and stored/query metrics in Grafana Mimir. Grafana stayed as the visualization layer, but the backend became far more resilient and easier to scale.
Why This Architecture Matters
The main value of this design is separation of concerns.
In a traditional setup, Prometheus does too much at once:
- it scrapes targets
- stores time series locally
- serves queries
- handles retention with local disk constraints
- becomes a single operational bottleneck
That model is fine for small environments, but it gets harder to maintain when metric volume grows.
With OpenTelemetry, Kafka, and Mimir, responsibilities are split cleanly:
- OpenTelemetry Collectors scrape and process metrics
- Kafka buffers and decouples producers from consumers
- Mimir handles horizontally scalable long-term metrics storage and querying
- Grafana provides dashboards and alerting
This gives three immediate benefits.
First, it improves reliability. If storage is under pressure or a backend component restarts, metrics do not disappear instantly because Kafka acts as a buffer between collection and storage.
Second, it improves scalability. You can scale collectors, Kafka, and Mimir independently instead of scaling one monolithic Prometheus instance.
Third, it improves operational flexibility. You can add filtering, enrichment, routing, and fan-out in the OpenTelemetry pipeline without redesigning the entire monitoring platform.

The High-Level Data Flow
The architecture looks like this:
- OpenTelemetry Collector scrapes Prometheus-compatible endpoints.
- The collector publishes metrics into Kafka.
- Another OpenTelemetry Collector consumes those metrics from Kafka.
- The consumer writes metrics to Grafana Mimir using Prometheus remote write.
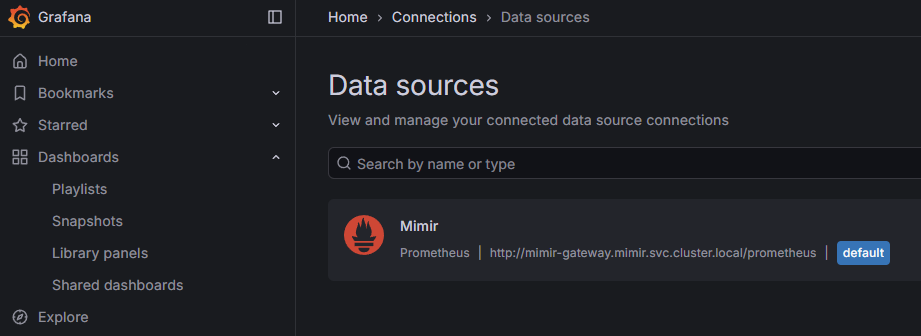
- Grafana queries Mimir as a Prometheus-compatible datasource.
This model is especially useful when you want a durable transport layer between collection and storage.
Why OpenTelemetry Instead of Prometheus for Scraping
Prometheus is still excellent at scraping metrics, but OpenTelemetry Collector gives more pipeline control.
With OpenTelemetry you can:
- scrape Prometheus endpoints
- batch data
- drop noisy labels
- reshape payloads
- route metrics through Kafka
- send the same telemetry to multiple backends if needed later
That makes OpenTelemetry more than a scraper. It becomes a programmable observability pipeline.
In our implementation, OpenTelemetry replaced Prometheus as the active collector. Existing exporters stayed where they were, but the collection logic moved to OTel. That allowed us to preserve the current monitoring targets while modernizing the backend.
Why Kafka in the Middle
Kafka is the decoupling layer.
Without Kafka, collectors and storage backends are tightly connected. If the backend is slow or temporarily unavailable, ingestion becomes fragile. Kafka changes that by introducing durable buffering.
Kafka adds clear advantages:
- backpressure handling
- retry tolerance
- loose coupling between collection and storage
- easier future fan-out to other systems
- replay potential for downstream consumers
In practical terms, Kafka protects the pipeline. Metrics are collected continuously even if the storage layer briefly struggles.

Why Grafana Mimir
Grafana Mimir is designed for scalable, multi-tenant, Prometheus-compatible metrics storage.
It solves the biggest limitations of single-node Prometheus storage:
- local disk dependency
- limited horizontal scaling
- poor separation between ingestion, storage, and querying
- operational pain as cardinality and retention grow
Mimir keeps Prometheus query compatibility while distributing the backend into specialized services.
That means you do not lose the PromQL ecosystem, dashboards, or operational familiarity. You simply gain a backend that is built to scale.
Mimir Architecture Explained
Grafana Mimir is not a single binary in the way many small monitoring stacks are. It is a distributed system with multiple components, each responsible for a narrow part of the lifecycle of metrics.
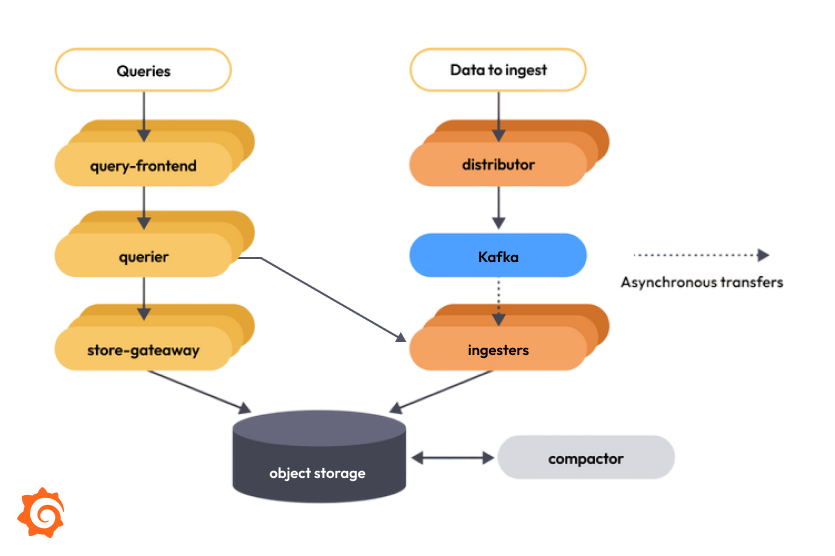
Distributor
The Distributor is the ingestion entry point.
It receives incoming writes and validates them before forwarding data to ingesters. It is stateless and can be scaled horizontally. In a remote-write flow, this is the front door for incoming time series.
In short:
- receives writes
- validates labels and samples
- load-balances traffic to ingesters
Ingester
The Ingester is responsible for holding recent time series in memory and writing them into durable block storage.
It is optimized for fresh data and active ingestion. Once data is compacted into blocks, it can later be queried from long-term storage through other components.
In short:
- stores recent samples
- manages active series
- writes data into blocks for long-term retention
Querier
The Querier executes PromQL queries.
When Grafana sends a query, the Querier retrieves recent data from ingesters and historical data from storage-backed components, then merges the results into one response.
In short:
- runs PromQL queries
- fetches recent and historical data
- merges distributed results
Query Frontend
The Query Frontend sits in front of the queriers and optimizes query handling.
It can split large queries, queue requests, cache results, and improve overall query efficiency. This becomes more valuable as dashboard traffic and query complexity increase.
In short:
- query acceleration
- caching
- request splitting and scheduling
Query Scheduler
The Query Scheduler helps coordinate query workloads between the frontend and queriers.
It prevents queriers from being overwhelmed and improves fairness and parallelism in busy environments.
In short:
- balances query work
- protects queriers from overload
- improves concurrency control
Store Gateway
The Store Gateway serves historical metric blocks from object storage.
Instead of every querier directly scanning storage, the Store Gateway provides an optimized path for reading long-term block data.
In short:
- exposes historical blocks
- accelerates long-range queries
- reduces direct storage pressure
Compactor
The Compactor manages block lifecycle in object storage.
It merges smaller blocks into larger ones, applies retention rules, and keeps storage organized and efficient.
In short:
- compacts blocks
- enforces retention
- improves storage efficiency
Gateway
The Gateway provides a unified HTTP entry point.
It is often the endpoint used by Grafana and remote-write clients. Rather than exposing every internal Mimir component directly, the Gateway gives one stable access layer.
In short:
- central access endpoint
- simpler integration
- cleaner external exposure
Memberlist / Ring Coordination
Mimir components need a way to discover each other and coordinate ownership of data and workload. This is handled through ring-based coordination.
The ring is critical because it decides which ingesters own which data and how distributed components cooperate.
In short:
- service discovery between components
- consistent sharding
- cluster coordination
The Benefit of This Layered Design
The real strength of Mimir is not just that it stores metrics. It is that it stores metrics as a distributed system where each component can scale independently.
If ingestion grows, you scale distributors and ingesters. If query load grows, you scale queriers and query frontends. If historical query pressure grows, you scale store gateways. If storage volume grows, you scale object storage and compaction strategy.
That is a much healthier operational model than asking one Prometheus server to do everything.
Operational Lessons from This Migration
Moving from Prometheus to OpenTelemetry and Mimir is not just a component swap. It changes the operating model.
A few lessons stand out.
1. Label hygiene matters
Once metrics hit a distributed backend, bad label discipline becomes more expensive. High-cardinality labels and verbose container labels can create ingestion pain quickly. Filtering unnecessary labels in OpenTelemetry is often the right move.
2. Message sizing matters in Kafka pipelines
Metrics are not always tiny. Large batches can trigger Kafka message-size issues. Batch tuning and producer size settings are essential in real deployments.
3. Distributed systems need clear observability of their own
You are not only monitoring applications anymore. You are also monitoring collectors, brokers, ingest paths, query paths, and storage components. The observability platform must observe itself.
4. Prometheus compatibility is a huge advantage
The migration would be much harder if dashboards and queries had to be rewritten from scratch. Because Mimir is Prometheus-compatible, the transition is mostly architectural rather than conceptual.
What We Gained
After the migration, the monitoring stack became more resilient and more modular.
We gained:
- durable decoupling with Kafka
- flexible metric processing with OpenTelemetry
- scalable long-term storage with Mimir
- continued PromQL and Grafana compatibility
- easier future growth without redesigning the platform again
Most importantly, we removed the single-node Prometheus server as the center of gravity.
That is the real shift: from a local metrics server to a distributed observability pipeline.
Mimir setup
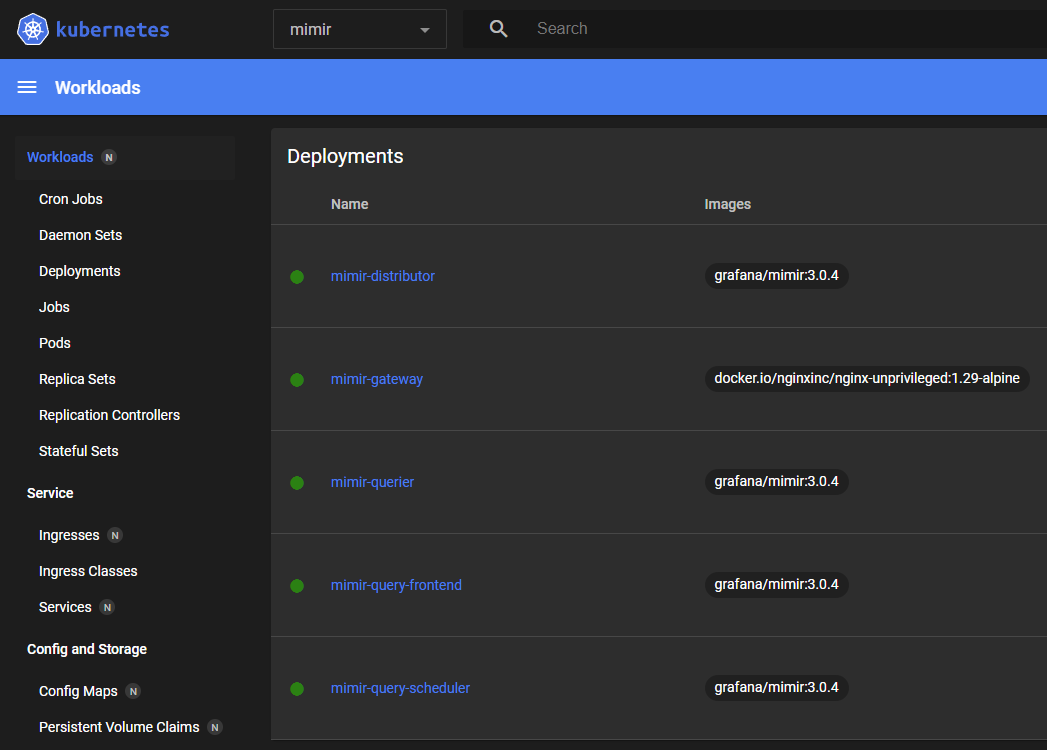
#!/usr/bin/env bash
set -euo pipefail

NAMESPACE="${NAMESPACE:-mimir}"
RELEASE="${RELEASE:-mimir}"
CHART_VERSION="${CHART_VERSION:-6.0.6}"
KAFKA_ADDRESS="${KAFKA_ADDRESS:-192.168.0.151:9092}"
KAFKA_TOPIC="${KAFKA_TOPIC:-mimir-ingest}"
MINIO_NAMESPACE="${MINIO_NAMESPACE:-minio}"
MINIO_SECRET_NAME="${MINIO_SECRET_NAME:-minio}"
MINIO_ENDPOINT="${MINIO_ENDPOINT:-minio.minio.svc.cluster.local:9000}"
BLOCKS_BUCKET="${BLOCKS_BUCKET:-mimir-blocks}"
STORAGE_CLASS="${STORAGE_CLASS:-longhorn}"
MC_IMAGE="${MC_IMAGE:-minio/mc:RELEASE.2025-08-13T08-35-41Z}"

kubectl create namespace "${NAMESPACE}" --dry-run=client -o yaml | kubectl apply -f -

MINIO_USER="$(kubectl get secret -n "${MINIO_NAMESPACE}" "${MINIO_SECRET_NAME}" -o jsonpath='{.data.rootUser}' | base64 -d)"
MINIO_PASSWORD="$(kubectl get secret -n "${MINIO_NAMESPACE}" "${MINIO_SECRET_NAME}" -o jsonpath='{.data.rootPassword}' | base64 -d)"

cat <<EOF | kubectl apply -f -
apiVersion: v1
kind: Secret
metadata:
  name: mimir-minio-env
  namespace: ${NAMESPACE}
type: Opaque
stringData:
  MINIO_USER: "${MINIO_USER}"
  MINIO_PASSWORD: "${MINIO_PASSWORD}"
EOF

kubectl -n "${NAMESPACE}" delete pod mimir-mc --ignore-not-found=true >/dev/null 2>&1 || true
kubectl run mimir-mc \
  -n "${NAMESPACE}" \
  --image="${MC_IMAGE}" \
  --restart=Never \
  --env="MC_HOST_mimir=http://${MINIO_USER}:${MINIO_PASSWORD}@${MINIO_ENDPOINT}" \
  --command -- sh -c "mc mb --ignore-existing mimir/${BLOCKS_BUCKET}"
kubectl wait --for=jsonpath='{.status.phase}'=Succeeded pod/mimir-mc -n "${NAMESPACE}" --timeout=180s
kubectl -n "${NAMESPACE}" delete pod mimir-mc --ignore-not-found=true >/dev/null 2>&1 || true

VALUES_FILE="$(mktemp)"
trap 'rm -f "${VALUES_FILE}"' EXIT

cat > "${VALUES_FILE}" <<EOF
global:
  extraEnv:
    - name: POD_IP
      valueFrom:
        fieldRef:
          fieldPath: status.podIP

minio:
  enabled: false

kafka:
  enabled: false

rollout_operator:
  enabled: false

alertmanager:
  enabled: false

ruler:
  enabled: false

overrides_exporter:
  enabled: false

gateway:
  replicas: 1

distributor:
  replicas: 1

ingester:
  replicas: 1
  zoneAwareReplication:
    enabled: false
  persistentVolume:
    enabled: true
    size: 10Gi
    storageClass: ${STORAGE_CLASS}

querier:
  replicas: 1

query_frontend:
  replicas: 1

query_scheduler:
  enabled: true
  replicas: 1

store_gateway:
  replicas: 1
  zoneAwareReplication:
    enabled: false
  persistentVolume:
    enabled: true
    size: 10Gi
    storageClass: ${STORAGE_CLASS}

compactor:
  replicas: 1
  persistentVolume:
    enabled: true
    size: 10Gi
    storageClass: ${STORAGE_CLASS}

mimir:
  structuredConfig:
    limits:
      max_label_names_per_series: 60
    memberlist:
      advertise_addr: \${POD_IP}
    blocks_storage:
      backend: s3
      s3:
        endpoint: ${MINIO_ENDPOINT}
        bucket_name: ${BLOCKS_BUCKET}
        access_key_id: ${MINIO_USER}
        secret_access_key: ${MINIO_PASSWORD}
        insecure: true
    distributor:
      remote_timeout: 10s
    ingest_storage:
      enabled: true
      kafka:
        address: ${KAFKA_ADDRESS}
        topic: ${KAFKA_TOPIC}
        auto_create_topic_enabled: true
        auto_create_topic_default_partitions: 1
EOF

helm repo add grafana https://grafana.github.io/helm-charts >/dev/null 2>&1 || true
helm repo update

helm upgrade --install "${RELEASE}" grafana/mimir-distributed \
  --namespace "${NAMESPACE}" \
  --version "${CHART_VERSION}" \
  --values "${VALUES_FILE}" \
  --wait \
  --timeout 20m

kubectl get pods -n "${NAMESPACE}" -o wide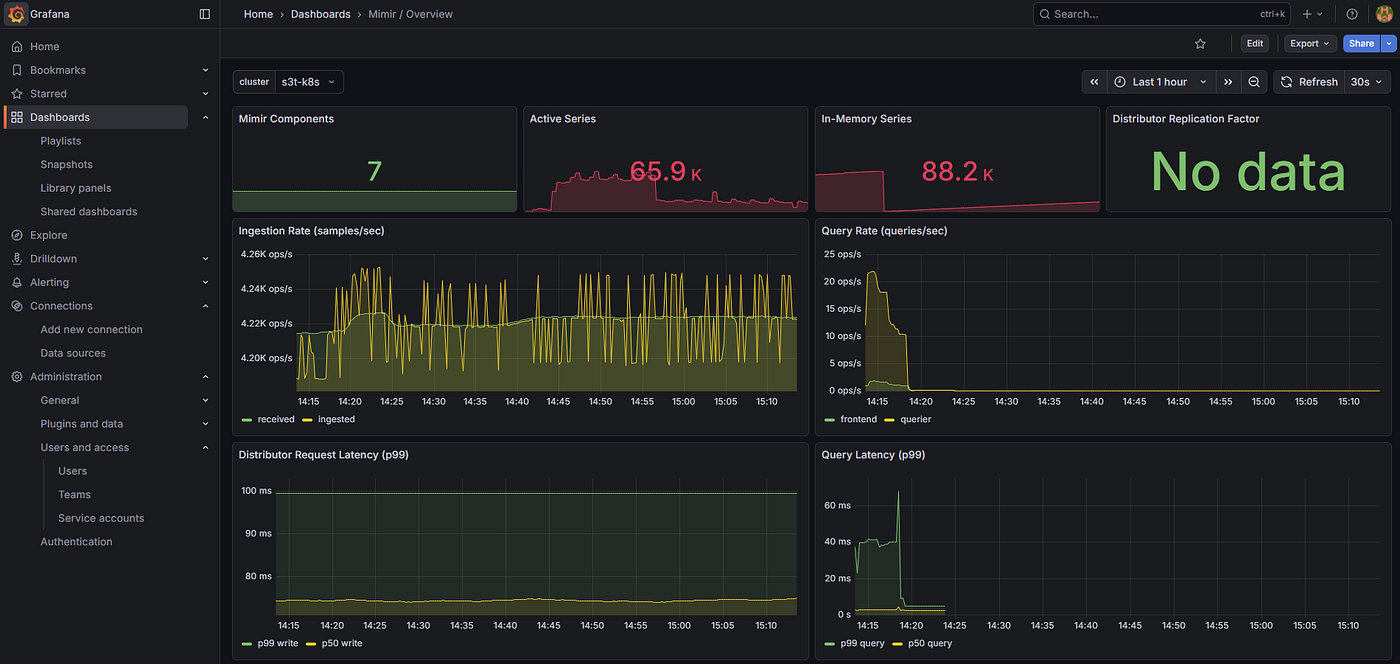
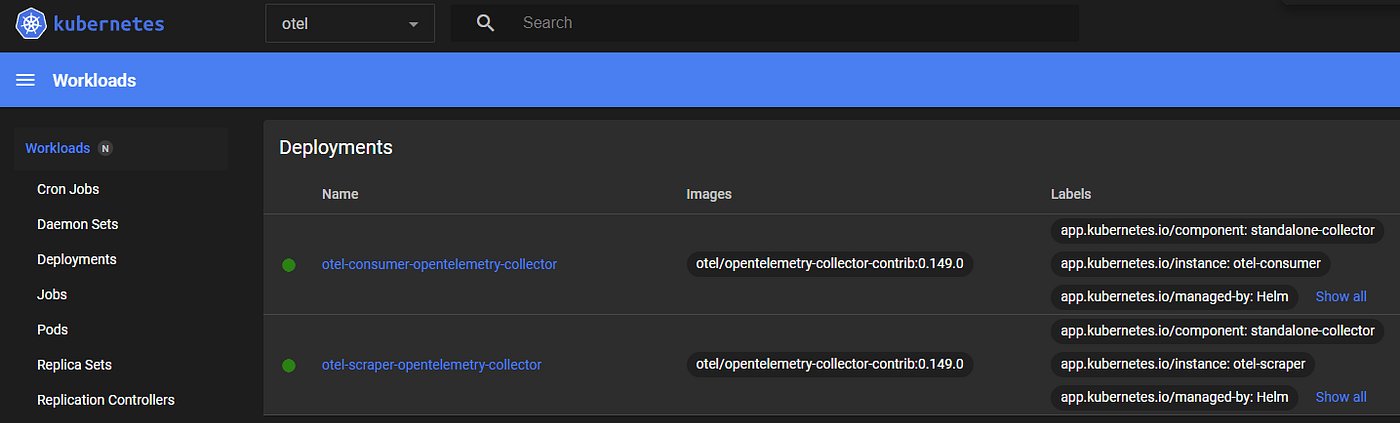
Otel Setup
#!/usr/bin/env bash
set -euo pipefail

NAMESPACE="${NAMESPACE:-otel}"
CHART_VERSION="${CHART_VERSION:-0.150.0}"
KAFKA_BROKERS="${KAFKA_BROKERS:-192.168.0.151:9092}"
KAFKA_TOPIC="${KAFKA_TOPIC:-otel-metrics}"
MIMIR_REMOTE_WRITE_ENDPOINT="${MIMIR_REMOTE_WRITE_ENDPOINT:-http://mimir-gateway.mimir.svc.cluster.local/api/v1/push}"

kubectl create namespace "${NAMESPACE}" --dry-run=client -o yaml | kubectl apply -f -

kubectl apply -f - <<EOF
apiVersion: v1
kind: Service
metadata:
  name: otel-scraper-metrics
  namespace: ${NAMESPACE}
spec:
  selector:
    app.kubernetes.io/instance: otel-scraper
    app.kubernetes.io/name: opentelemetry-collector
  ports:
    - name: metrics
      port: 8888
      targetPort: 8888
---
apiVersion: v1
kind: Service
metadata:
  name: otel-consumer-metrics
  namespace: ${NAMESPACE}
spec:
  selector:
    app.kubernetes.io/instance: otel-consumer
    app.kubernetes.io/name: opentelemetry-collector
  ports:
    - name: metrics
      port: 8888
      targetPort: 8888
EOF

SCRAPER_VALUES="$(mktemp)"
CONSUMER_VALUES="$(mktemp)"
trap 'rm -f "${SCRAPER_VALUES}" "${CONSUMER_VALUES}"' EXIT

cat > "${SCRAPER_VALUES}" <<EOF
mode: deployment

service:
  enabled: false

image:
  repository: otel/opentelemetry-collector-contrib

replicaCount: 1

ports:
  otlp:
    enabled: false
  otlp-http:
    enabled: false
  jaeger-compact:
    enabled: false
  jaeger-thrift:
    enabled: false
  jaeger-grpc:
    enabled: false
  zipkin:
    enabled: false

config:
  receivers:
    prometheus:
      config:
        global:
          scrape_interval: 15s
          scrape_timeout: 10s
        scrape_configs:
          - job_name: node
            static_configs:
              - targets: ["192.168.0.151:9100"]
          - job_name: proxmox-pve
            metrics_path: /pve
            params:
              target: ["192.168.0.114"]
              cluster: ["1"]
              node: ["1"]
              module: ["default"]
            static_configs:
              - targets: ["192.168.0.240:32221"]
          - job_name: k8s-kube-state-metrics
            static_configs:
              - targets: ["192.168.0.240:32080"]
          - job_name: k8s-cadvisor
            static_configs:
              - targets:
                  - "192.168.0.241:31180"
                  - "192.168.0.242:31180"
                  - "192.168.0.243:31180"
                  - "192.168.0.244:31180"
                  - "192.168.0.245:31180"
                  - "192.168.0.246:31180"
          - job_name: mailu-exporter
            static_configs:
              - targets: ["192.168.0.240:32305"]
          - job_name: otel-scraper
            static_configs:
              - targets: ["otel-scraper-metrics.${NAMESPACE}.svc.cluster.local:8888"]
          - job_name: otel-consumer
            static_configs:
              - targets: ["otel-consumer-metrics.${NAMESPACE}.svc.cluster.local:8888"]
          - job_name: mimir
            static_configs:
              - targets:
                  - "mimir-compactor.mimir.svc.cluster.local:8080"
                  - "mimir-distributor.mimir.svc.cluster.local:8080"
                  - "mimir-gateway.mimir.svc.cluster.local:8080"
                  - "mimir-ingester.mimir.svc.cluster.local:8080"
                  - "mimir-querier.mimir.svc.cluster.local:8080"
                  - "mimir-query-frontend.mimir.svc.cluster.local:8080"
                  - "mimir-query-scheduler.mimir.svc.cluster.local:8080"
                  - "mimir-store-gateway.mimir.svc.cluster.local:8080"
  processors:
    batch:
      send_batch_size: 200
      send_batch_max_size: 200
      timeout: 1s
  exporters:
    kafka:
      brokers: ["${KAFKA_BROKERS}"]
      protocol_version: 2.0.0
      producer:
        max_message_bytes: 10485760
      metrics:
        topic: ${KAFKA_TOPIC}
        encoding: otlp_proto
  extensions:
    health_check: {}
  service:
    extensions: [health_check]
    pipelines:
      metrics:
        receivers: [prometheus]
        processors: [batch]
        exporters: [kafka]
EOF

cat > "${CONSUMER_VALUES}" <<EOF
mode: deployment

service:
  enabled: false

image:
  repository: otel/opentelemetry-collector-contrib

replicaCount: 1

ports:
  otlp:
    enabled: false
  otlp-http:
    enabled: false
  jaeger-compact:
    enabled: false
  jaeger-thrift:
    enabled: false
  jaeger-grpc:
    enabled: false
  zipkin:
    enabled: false

config:
  receivers:
    kafka:
      brokers: ["${KAFKA_BROKERS}"]
      protocol_version: 2.0.0
      group_id: otel-mimir-consumer
      metrics:
        topics: ["${KAFKA_TOPIC}"]
        encoding: otlp_proto
  processors:
    attributes/drop_excess_metric_labels:
      actions:
        - pattern: ^container_label_.*
          action: delete
    batch: {}
  exporters:
    prometheusremotewrite:
      endpoint: ${MIMIR_REMOTE_WRITE_ENDPOINT}
      headers:
        X-Scope-OrgID: anonymous
      tls:
        insecure: true
  extensions:
    health_check: {}
  service:
    extensions: [health_check]
    pipelines:
      metrics:
        receivers: [kafka]
        processors: [attributes/drop_excess_metric_labels, batch]
        exporters: [prometheusremotewrite]
EOF

helm repo add open-telemetry https://open-telemetry.github.io/opentelemetry-helm-charts >/dev/null 2>&1 || true
helm repo update

helm upgrade --install otel-scraper open-telemetry/opentelemetry-collector \
  --namespace "${NAMESPACE}" \
  --version "${CHART_VERSION}" \
  --values "${SCRAPER_VALUES}" \
  --wait \
  --timeout 15m

helm upgrade --install otel-consumer open-telemetry/opentelemetry-collector \
  --namespace "${NAMESPACE}" \
  --version "${CHART_VERSION}" \
  --values "${CONSUMER_VALUES}" \
  --wait \
  --timeout 15m

kubectl get pods -n "${NAMESPACE}" -o wide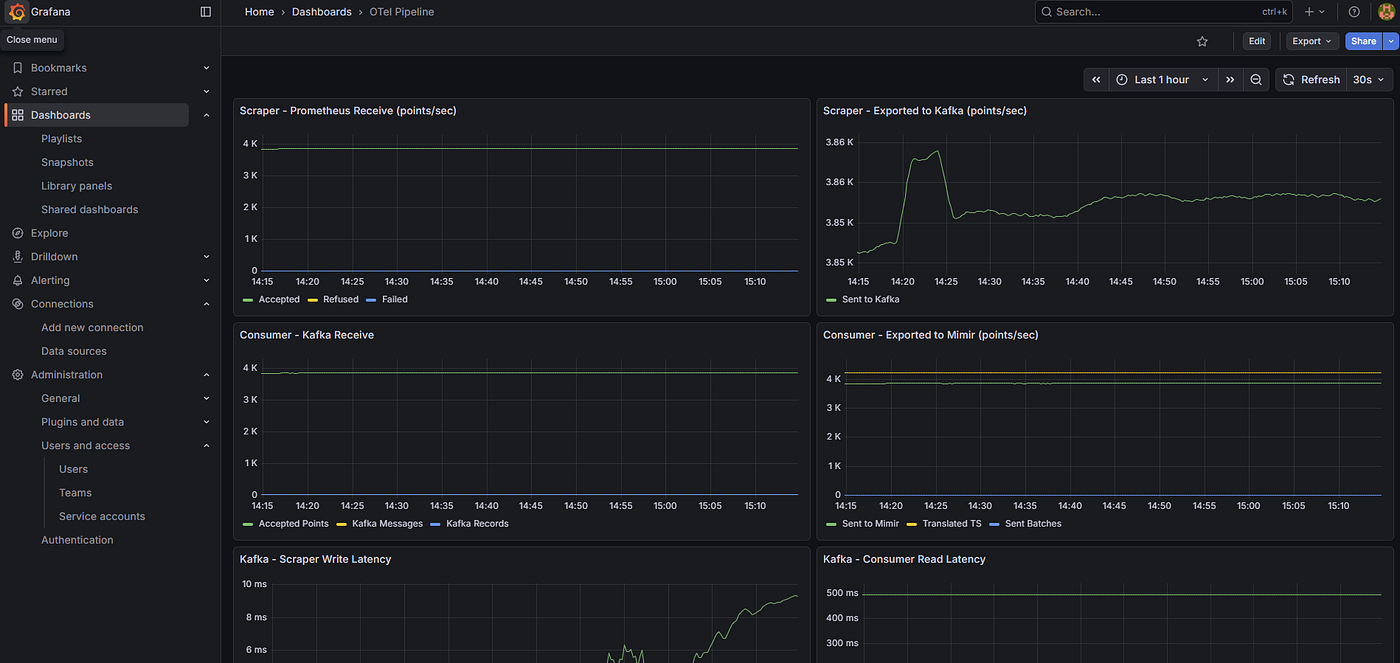
Final Thought
If your environment is still small, standalone Prometheus may remain the right tool. But if you are already dealing with Kubernetes, exporters across multiple nodes, growing metric retention needs, and the desire to build a more fault-tolerant observability platform, OpenTelemetry plus Kafka plus Grafana Mimir is a strong next step.
It is not just a scaling strategy. It is a cleaner architecture.
And once you separate collection, transport, storage, and visualization properly, the monitoring stack stops being a limitation and starts behaving like infrastructure.
메타데이터
- post_id
- 53aca6e7b480
- slug
- from-prometheus-to-a-kafka-native-metrics-pipeline-with-grafana-mimir-and-opentelemetry-53aca6e7b480
- url
- https://medium.com/@yavuzyasincelik/from-prometheus-to-a-kafka-native-metrics-pipeline-with-grafana-mimir-and-opentelemetry-53aca6e7b480
- canonical_url
- https://medium.com/@yavuzyasincelik/from-prometheus-to-a-kafka-native-metrics-pipeline-with-grafana-mimir-and-opentelemetry-53aca6e7b480
- author_url
- https://medium.com/@yavuzyasincelik
- status
- ok
- fetched_at
- 2026-07-11 15:00:27