Automating C2 Traffic Detection using Python, Zeek and Suricata
Command and Control (C2) communication remains one of the most critical indicators of compromise within modern cyber attacks. Attackers…
Automating C2 Traffic Detection using Python, Zeek and Suricata
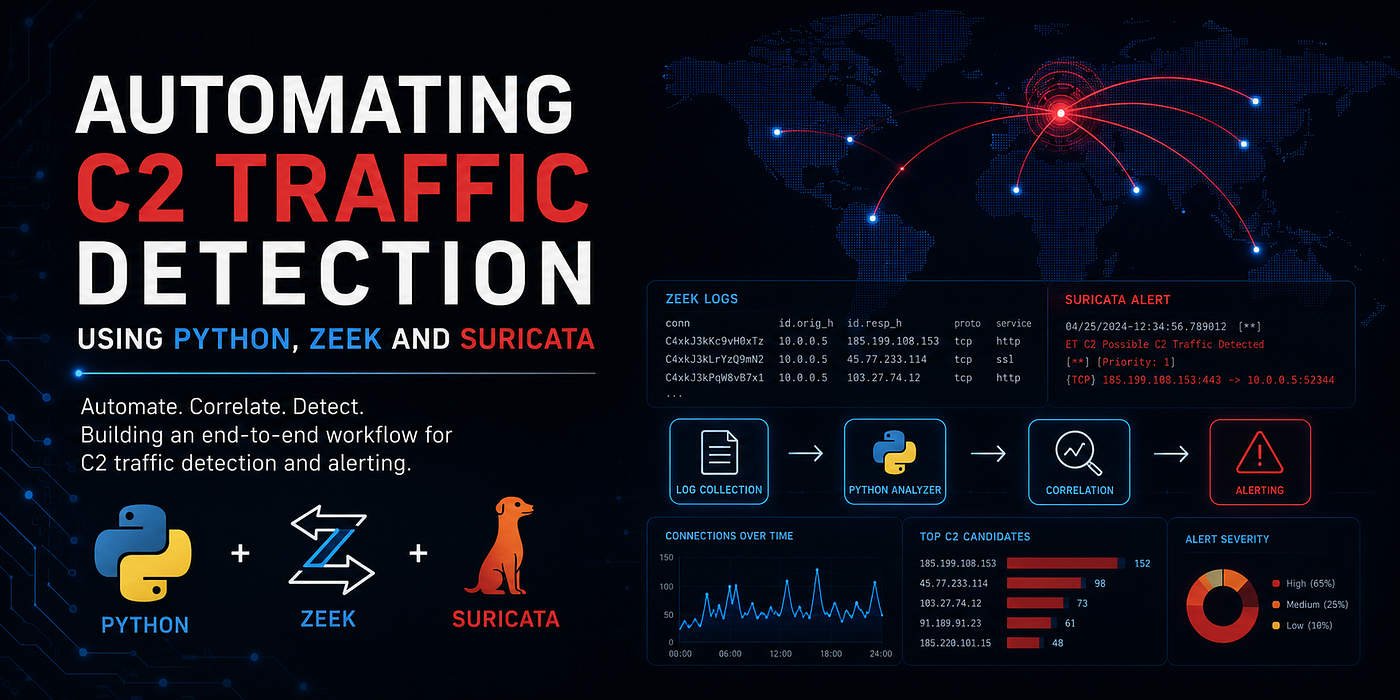
Command and Control (C2) communication remains one of the most critical indicators of compromise within modern cyber attacks. Attackers often rely on C2 channels to maintain persistence, execute remote commands, and exfiltrate sensitive data from compromised systems. In this article, we demonstrate how Zeek, Suricata, and Python can be integrated to automate the detection of suspicious network activities, including DNS anomalies, port scanning, and reverse shell communications. Additionally, we centralize security events using the ELK Stack to provide enhanced visibility and faster incident investigation capabilities.
1. Adding Suricata to Repositories
Before installing Suricata, the official package repository should be added to Ubuntu. This ensures access to the latest stable version and security updates. Using the official repository is recommended because default Ubuntu repositories may contain older releases. After adding the repository, the package manager can retrieve updated package information.
sudo add-apt-repository ppa:oisf/suricata-stable
2. sudo apt update
The sudo apt update command refreshes the local package database and retrieves the latest package information from configured repositories.
sudo apt update3. Installing Suricata
Suricata can be installed directly using the Ubuntu package manager. During installation, required dependencies are automatically downloaded and configured.
sudo apt install suricata -y4. Configuration of /etc/suricata/suricata.yml File (Must Be Root User)
The primary Suricata configuration file is located at /etc/suricata/suricata.yml. Administrative privileges are required to modify this file because it controls critical IDS/IPS settings. Network interfaces, logging options, rule paths, and packet capture methods are configured here. Any changes should be carefully reviewed before deployment.

5. Add Network Adapter to AF-Packet Field
The AF-Packet section specifies which network interface Suricata will monitor. The correct adapter name, such as eth0 or ens33, must be configured to capture network traffic. Without selecting the proper interface, Suricata will not inspect packets. This configuration enables high-performance packet processing directly from the Linux kernel.

6. After installation empty rule folder
Probably you have 2 problem that are nothing any rules and AF_Packet fanout:

For solve this problem we must write following commands:
root@server:~# sudo suricata-update
23/5/2026–17:50:12 — <Info> — Using data-directory /var/lib/suricata.
23/5/2026–17:50:12 — <Info> — Using Suricata configuration /etc/suricata/suricata.yaml
23/5/2026–17:50:12 — <Info> — Using /usr/share/suricata/rules for Suricata provided rules.
23/5/2026–17:50:12 — <Info> — Found Suricata version 8.0.5 at /usr/bin/suricata.
23/5/2026–17:50:12 — <Info> — Loading /etc/suricata/suricata.yaml
23/5/2026–17:50:12 — <Info> — Disabling rules for protocol pgsql
23/5/2026–17:50:12 — <Info> — Disabling rules for protocol modbus
23/5/2026–17:50:12 — <Info> — Disabling rules for protocol dnp3
23/5/2026–17:50:12 — <Info> — Disabling rules for protocol enip
23/5/2026–17:50:12 — <Info> — No sources configured, will use Emerging Threats Open
23/5/2026–17:50:12 — <Info> — Fetching https://rules.emergingthreats.net/open/suricata-8.0.5/emerging.rules.tar.gz.
 100% — 5471864/5471864
At last of the update seeing 100% then we must see downloaded rules:
23/5/2026–17:50:16 — <Info> — Loaded 66144 rules.
23/5/2026–17:50:16 — <Info> — Disabled 16 rules.
23/5/2026–17:50:16 — <Info> — Enabled 0 rules.
23/5/2026–17:50:16 — <Info> — Modified 0 rules.
23/5/2026–17:50:16 — <Info> — Dropped 0 rules.
23/5/2026–17:50:16 — <Info> — Enabled 136 rules for flowbit dependencies.
For check all of this write following command:
sudo suricata -T
Now, we give restart to Suricata:
systemctl restart suricata7. Suricata Rules are already available
Now we will look at the /var/lib/suricata/rules folder suricata.rules file

Check availability Suricata creating a manual request to the server:

After this request check /var/log/suricata/fast.log file using following command for logging:

root@server:~# tail -f /var/log/suricata/fast.log
05/23/2026–18:07:39.148607 [**] [1:2013504:6] ET INFO GNU/Linux APT User-Agent Outbound likely related to package management [**] [Classification: Not Suspicious Traffic] [Priority: 3] {TCP} 192.168.100.93:47308 -> 94.20.20.125:80
05/23/2026–18:07:48.383400 [**] [1:2100498:7] GPL ATTACK_RESPONSE id check returned root [**] [Classification: Potentially Bad Traffic] [Priority: 2] {TCP} 18.165.72.39:80 -> 192.168.100.93:43136
Let’s solve second problem, which related with AF-Packet.
9. Changing cluster-id from 99 to 98 for AF_Packet error
In some environments, AF-Packet may generate cluster conflicts when multiple packet capture applications are running. Adjusting the cluster-id value from 99 to 98 resolves interface resource conflicts. Each packet processing application should use a unique cluster identifier. After modifying the value, Suricata should be restarted.
/etc/suricata/suricata.yaml

Now we began to install Zeek to our Ubuntu Server using following command:
sudo apt install cmake make gcc g++ flex bison libpcap-dev libssl-dev python3-dev swig zlib1g-dev -y10. Zeek configure command result
The Zeek configuration process verifies that required libraries and dependencies are available. Successful output confirms that Zeek can be built and deployed on the system. Configuration checks include compiler compatibility, packet capture support, and installation paths. Any missing components are reported during this phase.
sudo wget https://download.zeek.org/zeek-8.0.8.tar.gzAfter installing this file, use tar -xvf zeek-8.0.8.tar.gz for extract and change directory to the following file and run ./configure command for installing Zeek.
Note: Before using ./configure command please be sure all of the following packets are installed: (cmake; make; gcc; g++; flex; bison; libpcap-dev; libssl-dev; python3-dev, swig zlib1g-dev and libzmq3-dev (ZeroMQ))
After installing Zeek we use ./configure, make and make install
12. Changing Interface Name
For change interface type to own interface name:
sudo nano /usr/local/zeek/etc/node.cfg

then change

interface=ens33
13. zeekctl deploy Command
The zeekctl deploy command applies configuration changes and starts Zeek processes. During deployment, Zeek loads scripts, initializes packet capture, and activates logging components.

14. Creating Victim machine
For checking logs I am conducting Nmap to specific IP address.

Attack to victim using Nmap

15. Port Scanning Using Nmap from Kali Linux
Nmap is used from the Kali Linux attacker machine to perform network reconnaissance. The scan identifies open ports, running services, and potential attack surfaces. Port scanning is one of the most common techniques observed during the early stages of an attack. Security monitoring tools should detect and log these activities.
Result of Suricata: Log file located in /var/log/suricata/fast.log

16. Nmap Result to Ubuntu Machine
The Nmap scan reveals exposed services and listening ports on the Ubuntu host. Results may include SSH, HTTP, DNS, or other network services depending on system configuration. Attackers use this information to identify potential entry points. Security analysts can correlate scan activity with detection logs.
Result of Zeek: Log file located in /usr/local/zeek/logs/current/conn.log
There are shows simply connection logs with current machine.

17. Now coming to advance part to DNS Tunneling using iodine
Both of Attacker and Victim machine install iodine
apt install iodine- DNS example using nslookup both of machine


19. DNS creation generated log in Zeek
The Ubuntu machine also performs DNS lookups during normal network usage. Monitoring these requests establishes a baseline of legitimate behavior. Analysts can compare normal DNS activity against suspicious patterns. This comparison helps identify anomalies and malicious communications.

20. Than checking Reverse shell example
Zeek records detailed DNS transactions in dns.log. Information such as queried domains, response codes, query types, and timestamps is stored for analysis. These logs provide valuable visibility into network name resolution activity. DNS monitoring is a key component of threat detection.

21. Zeek logs for Reverse Shell
When a reverse shell is established, Zeek records the associated network connections within its logs. Connection metadata such as IP addresses, ports, duration, and transferred data becomes available. Analysts can use these records to identify unusual outbound communications. Reverse shells often exhibit patterns that differ from normal traffic.
In this case I’ve use dns.log file in Zeek

Now checking connections from conn.log file in Zeek

21. Detection Engineering
When a reverse shell is established, Zeek records the associated network connections within its logs. Connection metadata such as IP addresses, ports, duration, and transferred data becomes available. Analysts can use these records to identify unusual outbound communications. Reverse shells often exhibit patterns that differ from normal traffic.
22. Blue Team — Zeek Cat Query
Blue Team analysts can use command-line tools such as cat, grep, and zeek-cut to quickly analyze Zeek logs. These commands help extract specific indicators and connection records. Rapid log analysis enables faster incident response. Simple queries often reveal valuable evidence.
Example: Zeek Suspicious Connection Detection
Suspicious connections can be identified by reviewing Zeek connection logs for unusual destinations, uncommon ports, or abnormal durations. Analysts may also correlate events across multiple log sources. Such investigations help uncover malicious communications. Zeek provides extensive metadata for this purpose.
23. Creating New File of local.rules
A custom local.rules file allows administrators to create organization-specific detection signatures. This approach separates custom rules from vendor-provided rule sets. Maintaining a dedicated file simplifies updates and management. Custom detections can be tailored to local threats.

24. Add New Path and local.rules File to suricata.yml
After creating the custom rules file, its path must be added to the Suricata configuration. This ensures that the detection engine loads the new signatures during startup. Multiple rule files can be defined if required. Proper configuration enables rule activation.

25. Adding new rule for detect possible Reverse Shell Attack
A custom Suricata rule can be created to identify reverse shell behavior based on network characteristics. Detection criteria may include suspicious ports, payload patterns, or connection directions. Such rules enhance visibility into attacker activity. Testing should be performed to validate effectiveness.

26. Suricata New Rule Accepting
Once added, the new rule should be validated and loaded by Suricata. Configuration testing confirms that the rule syntax is correct. Successful loading indicates that the engine is ready to use the detection logic. Any syntax errors must be corrected before deployment. Suricata new rule accpeting using current command: suricata -T -c /etc/suricata/suricata.yaml

Lets creating own security rules for this project.
If we don’t create this rules, then we have a lot of False Positives. Thus, An alert appears if you do not perform an Nmap scan, browser traffic looks like malware, internal DNS request appears suspicious and etc. In this case we achieve reducing useless alerts, keep only real threats, increase detection accuracy and etc. Against this situation we must create some special rules.
Let’s continue with port scanning.
Sometimes we get some alert from network like, vulnerability scanner, monitoring tool or internal admin scan.
For example: nmap -sS 192.168.50.10
If the source IP is your own admin machine, you may want to ignore this.
The solution to this is to add a threshold to the local.rules file:
alert tcp any any -> any any \
(msg:"Possible Port Scan"; flags:S; \
threshold:type both, track by_src, count 20, seconds 60; \
sid:100002; rev:1;)
Note: This rule does not alert if there are not 20 SYN packets within 60 seconds.
Another way for increase threat-focused detection we may add some rule against creation of Internal network alerts.
In /etc/suricata/suricata.yaml file have HOME_NET feature, this feature help us to check our local network which we appointed ever.

Note: Purpose of this approach: only your internal network is monitored external noise is reduced.
An another different purpose is for example DNS Tunneling false positive reduction.
Some normal domains sometimes sends long query’s, such as CDN, telemetry, antivirus update and etc.
This example I’ve used Python Entropy treshold:
if entropy(domain) > 4.5:You can also simplify the detection part by making it more focus-based by adding network analysis rules that suit your goals and environment.
At last, for easy visualization we can integrate different service with Suricata and Zeek.
28. Elasticsearch installing
Elasticsearch serves as the central data storage and search platform within the ELK Stack. Installation prepares the environment for collecting and indexing security logs. Once operational, it enables fast searching and correlation of events. Elasticsearch forms the foundation of the analytics platform.

29. elasticsearch.yml network configuration
The elasticsearch.yml file controls network communication and cluster settings. Administrators configure listening addresses, ports, and node parameters within this file. Proper network settings allow other components such as Filebeat and Kibana to connect. Configuration accuracy is critical for cluster functionality.

30. Elasticsearch is ready
After startup, Elasticsearch should report a healthy status and accept incoming connections. Successful operation confirms that indexing and search services are available. At this stage, log ingestion can begin. Verification is typically performed using API requests.

31. Filebeat sends Zeek logs to Elasticsearch
Filebeat collects Zeek log files and forwards them to Elasticsearch for storage and analysis. This automated process eliminates the need for manual log transfers. Structured data is indexed and becomes searchable. Centralized visibility significantly improves monitoring capabilities.


32. Zeek Logs on ELK
Once ingested, Zeek logs become available within Kibana dashboards and search views. Analysts can investigate connections, DNS activity, and protocol events from a single interface. Visualization capabilities simplify threat hunting and incident response. Centralized analysis improves operational efficiency.

33. Suricata Logs in ELK
Suricata alerts are also forwarded to Elasticsearch and displayed within Kibana. Detection events can be searched, filtered, and visualized in real time. Combining Suricata and Zeek data provides stronger security visibility. Correlation between data sources enhances detection accuracy.

36. Port scanning from attacker machine to specific IP
To simulate reconnaissance activity, the attacker machine performs a targeted Nmap scan against a specific IP address. This generates network events that can be captured by monitoring tools. Such simulations help validate detection capabilities. The resulting traffic provides realistic testing data.

37. Network Scanning Attack Detection by Zeek in ELK Logging
Zeek records scanning behavior and forwards the resulting logs to Elasticsearch through Filebeat. Within Kibana, analysts can identify scanning patterns, source hosts, and targeted systems. Visualization dashboards make attack activity easier to investigate. This demonstrates the value of centralized detection and monitoring.

Conclusion
By combining Zeek’s powerful network visibility, Suricata’s signature-based detection capabilities, and Python-driven automation, security teams can significantly improve their ability to identify and investigate potential C2 communications. The integration of these tools with the ELK Stack provides centralized monitoring, efficient log analysis, and real-time threat detection. This practical lab demonstrates how open-source security solutions can be leveraged to build an effective and scalable network detection and response environment.
메타데이터
- post_id
- 53ea86c93507
- slug
- automating-c2-traffic-detection-using-python-zeek-and-suricata-53ea86c93507
- url
- https://medium.com/@aghaverditk/automating-c2-traffic-detection-using-python-zeek-and-suricata-53ea86c93507
- canonical_url
- https://medium.com/@aghaverditk/automating-c2-traffic-detection-using-python-zeek-and-suricata-53ea86c93507
- author_url
- https://medium.com/@aghaverditk
- status
- ok
- fetched_at
- 2026-06-09 15:37:30





