Machine Learning vs Traditional Market Timing Indicators: Which Approach Works Better?
Financial markets generate enormous amounts of information every day. Price changes, trading volume, volatility, interest rates, earnings…
Machine Learning vs Traditional Market Timing Indicators: Which Approach Works Better?
Financial markets generate enormous amounts of information every day. Price changes, trading volume, volatility, interest rates, earnings expectations, economic data, investor positioning, and global events all influence market direction.
For decades, investors have relied on technical and macroeconomic indicators to identify potential market turning points. More recently, artificial intelligence and machine learning have introduced a new approach to analyzing those same market signals.
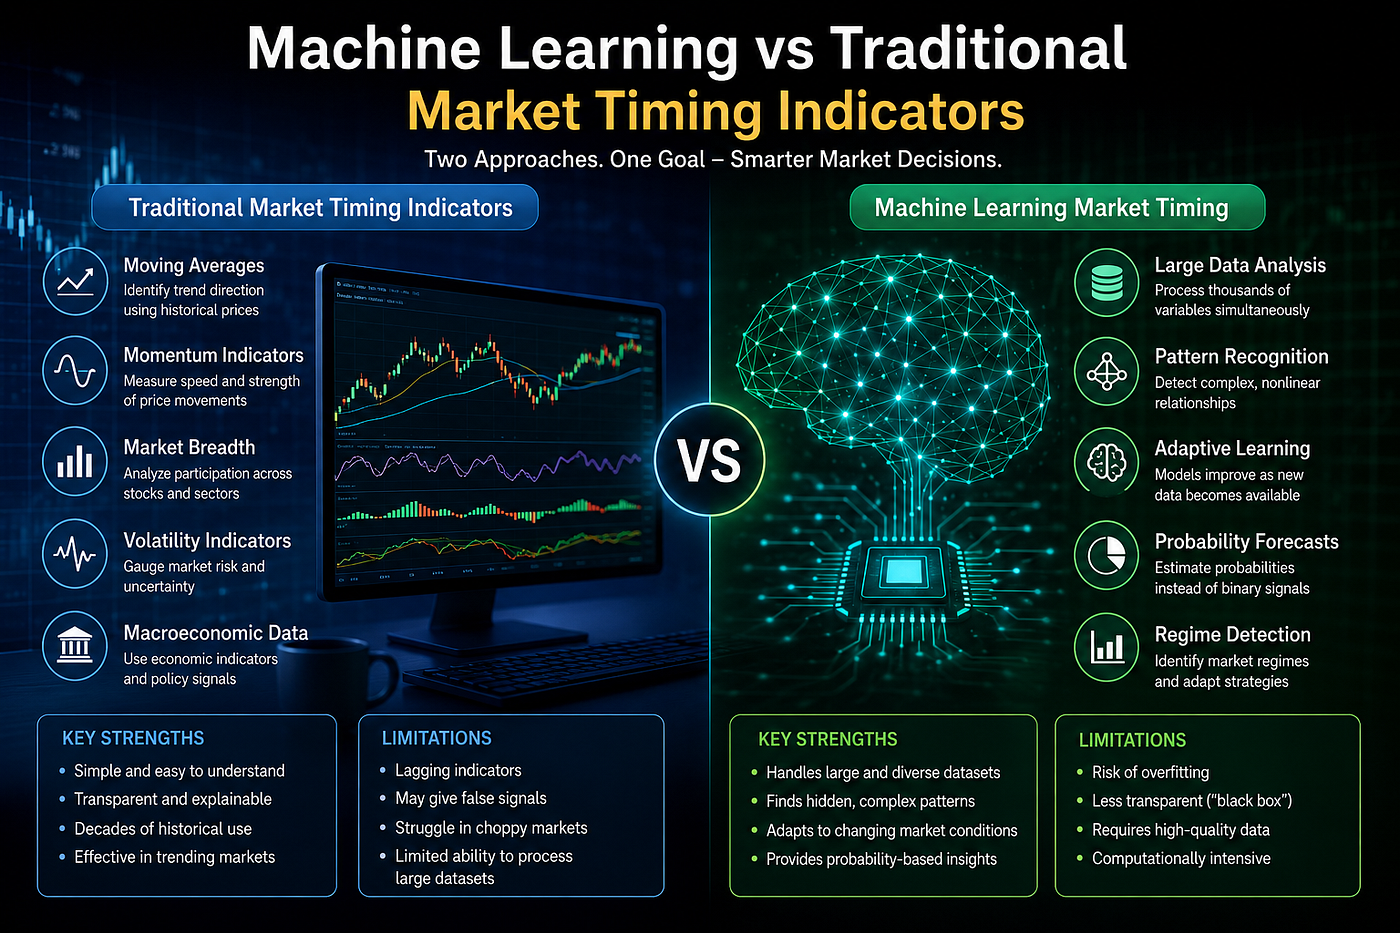
The debate over machine learning vs traditional market timing indicators is therefore becoming increasingly important for traders, portfolio managers, quantitative researchers, and long-term investors. Traditional indicators offer transparency and decades of historical experience. Machine learning models can evaluate far more variables, identify nonlinear relationships, and continuously adapt as new information becomes available.
Neither method, however, provides perfect market predictions. Markets are dynamic systems influenced by human behavior, liquidity, policy decisions, and unexpected events. The strongest market timing framework may therefore come from understanding the strengths and limitations of both approaches rather than treating them as competitors.
This guide examines how machine learning models compare with traditional market timing indicators, where each performs best, and how investors can combine them to build more disciplined market strategies.
What Is Market Timing?
Market timing is the process of adjusting investment exposure based on expectations about future market conditions. Instead of maintaining the same portfolio allocation at all times, investors may increase exposure when market conditions appear favorable and reduce exposure when risk appears elevated.
Market timing does not necessarily mean predicting the exact market top or bottom. In practice, many professional strategies focus on identifying changes in probability.
For example, a portfolio manager may determine that market conditions are becoming less favorable because volatility is rising, market breadth is weakening, and credit spreads are widening. Rather than immediately selling everything, the manager might gradually reduce equity exposure.
Similarly, improving momentum, falling volatility, stronger breadth, and improving economic conditions may justify increasing risk exposure.
The objective is therefore often risk-adjusted positioning rather than perfect prediction.
Traditional market timing indicators and machine learning models attempt to solve this problem in different ways.
What Are Traditional Market Timing Indicators?
Traditional market timing indicators are predefined measurements that investors use to evaluate market trends, momentum, volatility, sentiment, liquidity, and economic conditions.
Many of these indicators have been used for decades.
Common examples include:
- Moving averages
- Relative Strength Index
- Moving Average Convergence Divergence
- Market breadth
- Advance-decline lines
- Volatility indicators
- Bond yields
- Yield curves
- Credit spreads
- Investor sentiment indicators
- Trading volume
- Price momentum
- Support and resistance levels
Each indicator focuses on a particular aspect of market behavior.
A moving average measures trend direction. RSI evaluates momentum. The VIX reflects expectations for equity-market volatility. Credit spreads may provide clues about financial stress.
Traditional market timing systems usually combine several of these signals.
Moving Averages as Market Timing Indicators
Moving averages remain among the most widely followed market timing tools.
The 50-day and 200-day moving averages are particularly popular.
When an index trades above a rising 200-day moving average, investors may interpret the trend as structurally positive. When the index falls below the moving average and the average itself begins declining, the trend may be weakening.
Some systematic strategies use moving-average crossovers.
A commonly followed example occurs when the 50-day moving average crosses above the 200-day moving average. This is sometimes called a golden cross.
The opposite crossover is commonly known as a death cross.
Moving averages can help investors remain aligned with major trends, but they have an important weakness: they are lagging indicators.
By the time the signal appears, a significant part of the market move may already have occurred.
Momentum Indicators
Momentum attempts to determine whether market prices are accelerating or losing strength.
Popular indicators include:
- Relative Strength Index
- MACD
- Rate of Change
- Stochastic Oscillator
Momentum indicators can help identify situations where a trend may be becoming overextended.
However, investors should be cautious about assuming that an overbought market must immediately decline or that an oversold market must immediately recover.
Strong bull markets can remain overbought for extended periods. Similarly, severe bear markets may remain oversold while prices continue declining.
Momentum is therefore generally more useful when combined with trend, breadth, and volatility indicators.
Market Breadth Indicators
Market breadth measures how many individual securities participate in a market move.
Suppose a major stock index reaches a new high while fewer stocks remain above their long-term moving averages. This divergence may indicate that the rally is becoming increasingly dependent on a small number of large companies.
Common breadth measures include:
- Advance-decline lines
- Percentage of stocks above the 50-day moving average
- Percentage of stocks above the 200-day moving average
- New highs versus new lows
- Equal-weighted index performance
Breadth can provide important information that headline index levels sometimes hide.
Volatility Indicators
Volatility plays an important role in market timing because large changes in volatility frequently accompany changing market regimes.
When volatility remains relatively low, investors may become more comfortable holding risky assets. Sharp volatility increases can indicate rising uncertainty, deleveraging, or changing expectations.
However, high volatility does not automatically mean the market will continue falling.
In severe corrections, volatility can reach extreme levels near important market bottoms.
Professional investors therefore often examine both the level and direction of volatility rather than relying on a single threshold.
Macroeconomic Market Timing Indicators
Traditional market timing also uses macroeconomic information.
Important indicators may include:
- Interest rates
- Inflation
- Employment growth
- Manufacturing activity
- Consumer confidence
- GDP growth
- Central-bank policy
- Liquidity conditions
- Yield curves
- Credit spreads
Economic indicators help investors understand the broader environment in which companies operate.
For example, rapidly tightening monetary policy may create pressure on highly valued growth stocks because higher discount rates can reduce the present value of future earnings.
But macroeconomic signals can also be difficult to time because financial markets often anticipate economic changes months before they appear in official data.
What Is Machine Learning in Market Timing?
Machine learning uses algorithms that learn statistical relationships from historical data.
Rather than defining every trading rule manually, researchers provide a model with market data and allow the algorithm to identify relationships associated with future market outcomes.
Potential inputs might include:
- Stock prices
- Returns
- Trading volume
- Volatility
- Options data
- Bond yields
- Credit spreads
- Economic indicators
- Currency markets
- Commodity prices
- Market breadth
- News sentiment
- Earnings data
- Institutional positioning
- Alternative datasets
A machine learning model might analyze hundreds or thousands of variables simultaneously.
The model could then estimate the probability of different market outcomes.
For example, instead of producing a simple BUY or SELL signal, a model might estimate:
Probability of a positive market return during the next 20 trading sessions: 63%.
This probability-based approach can be particularly useful for portfolio allocation.
Machine Learning vs Traditional Market Timing Indicators
The fundamental difference between machine learning vs traditional market timing indicators lies in how information is processed.
Traditional strategies begin with predetermined relationships.
For example:
Price above 200-day moving average = positive trend.
RSI above 70 = potentially overbought.
Credit spreads widening = increasing financial risk.
Machine learning does not necessarily assume those relationships beforehand. Instead, algorithms search historical datasets for combinations of variables associated with particular outcomes.
The difference can be summarized as follows:
Traditional market timing: Humans define the rules.
Machine learning market timing: Algorithms attempt to discover the rules from data.
Both approaches have advantages.
Advantages of Traditional Market Timing Indicators
Simplicity
Traditional indicators are generally easy to understand.
Investors can calculate a moving average, examine market breadth, or monitor volatility without sophisticated computing infrastructure.
Transparency
Traditional indicators provide clear explanations for investment decisions.
A portfolio manager can say:
“We reduced equity exposure because the market fell below its long-term trend while breadth and credit conditions deteriorated.”
This transparency can be especially important for investment committees and institutional investors.
Long Historical Record
Many traditional indicators have been studied across multiple market cycles.
Researchers can examine how trend-following strategies behaved during recessions, inflationary periods, financial crises, and strong bull markets.
Lower Model Complexity
Simple models generally have fewer parameters.
That can reduce the risk of fitting a strategy too closely to historical data.
Limitations of Traditional Market Timing
Traditional indicators are not perfect.
Their biggest limitation is that financial-market relationships change.
A moving-average strategy that performed well during one period may generate frequent false signals during another.
Indicators may also become widely followed.
When large numbers of traders react to the same signal, the market can behave differently than historical models suggest.
Another problem is information overload.
Investors may monitor dozens of indicators that provide conflicting signals.
Machine learning attempts to solve some of these challenges.
Advantages of Machine Learning Market Timing
Ability to Analyze Large Datasets
Human analysts cannot realistically evaluate thousands of market variables continuously.
Machine learning algorithms can.
This allows researchers to combine technical, macroeconomic, fundamental, sentiment, and alternative data in a single system.
Identification of Nonlinear Relationships
Traditional indicators often assume relatively simple relationships.
Machine learning models can potentially detect more complex interactions.
For example, rising interest rates might be negative for technology stocks only when inflation expectations are increasing and earnings momentum is simultaneously declining.
A machine learning model may recognize this interaction automatically.
Adaptive Models
Some machine learning systems can be regularly retrained as new market data becomes available.
This may help them adjust to changing market regimes.
Probability-Based Forecasts
Machine learning models can generate probabilities rather than binary predictions.
Instead of saying:
“Market will fall.”
A model might estimate:
“Historical conditions similar to the current environment produced negative returns approximately 65% of the time.”
This provides a more realistic way to think about market uncertainty.
The Biggest Risk: Overfitting
Machine learning has an important weakness: overfitting.
Overfitting occurs when a model learns historical noise rather than a repeatable market relationship.
Imagine testing thousands of indicators across decades of financial data.
Purely by chance, some combinations will appear highly profitable.
A model may discover that a specific combination of variables predicted previous market movements extremely well.
But when the strategy encounters new data, the relationship disappears.
This is one reason spectacular historical backtests should be treated cautiously.
Professional quantitative research typically separates data into several stages, including training data, validation data, and completely unseen out-of-sample data.
The model should ideally demonstrate performance on data that played no role in its construction.
Machine Learning Models Used in Market Prediction
Different algorithms can be applied to market timing.
Linear and Logistic Regression
These are relatively simple statistical models and remain useful because they are easier to interpret.
Logistic regression can estimate the probability of outcomes such as positive versus negative future returns.
Decision Trees
Decision trees create conditional rules from data.
For example:
If volatility is rising AND momentum is negative AND credit spreads are widening, then risk probability increases.
Random Forest
Random forests combine many decision trees.
They can capture nonlinear relationships while reducing some of the instability associated with individual decision trees.
Gradient Boosting
Gradient-boosting techniques have become popular for structured financial datasets because they can identify complex interactions among variables.
Neural Networks
Neural networks can analyze highly complex relationships.
Deep-learning architectures may also process text, time-series data, and sentiment information.
However, additional complexity does not automatically produce better investment results.
Complex models can be harder to interpret and easier to overfit.
Traditional Indicators May Still Improve Machine Learning
One common misconception is that machine learning makes traditional technical indicators obsolete.
In reality, traditional indicators can become useful machine-learning inputs.
A model might analyze:
- 20-day momentum
- 50-day moving-average slope
- 200-day moving-average distance
- RSI
- Breadth
- Volatility
- Credit spreads
- Yield-curve slope
Machine learning can then determine how these variables interact under different market conditions.
This creates a hybrid framework where traditional market knowledge provides meaningful features while machine learning determines their relative importance.
Market Regime Detection
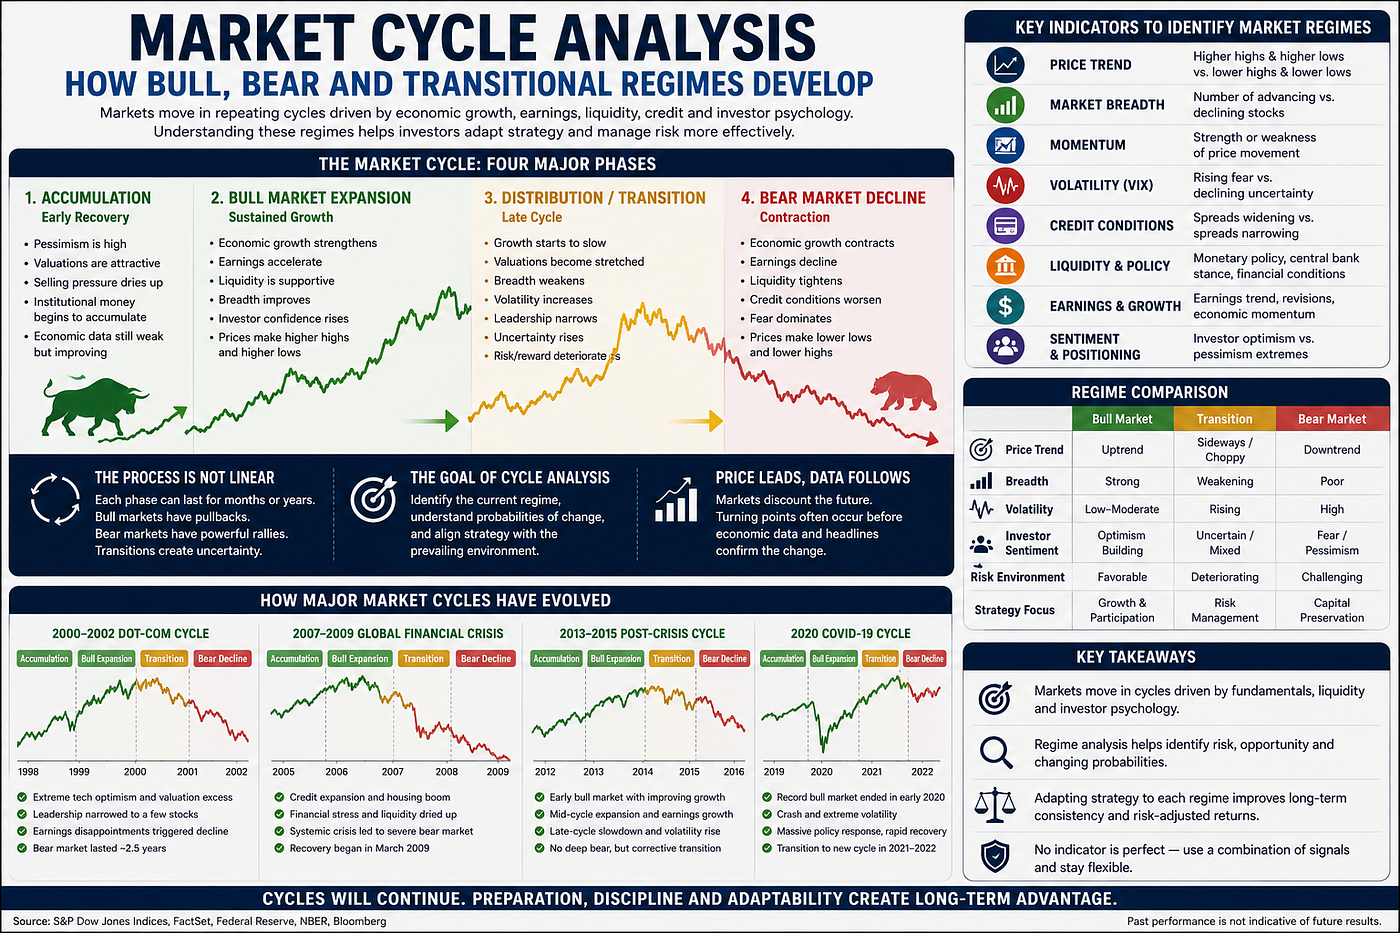
One of the most promising applications of machine learning is market regime detection.
Financial markets behave differently during different environments.
Typical regimes might include:
- Low-volatility bull markets
- High-volatility bull markets
- Inflationary environments
- Recessions
- Liquidity-driven rallies
- Credit stress
- Bear markets
- Recovery phases
An indicator that works well in one regime may perform poorly in another.
For example, momentum strategies may work effectively during persistent trends but struggle during highly volatile sideways markets.
Machine learning models can attempt to identify the current regime and change the weighting of different signals accordingly.
Machine Learning and Market Turning Points
Predicting exact turning points remains extremely difficult.
Major market reversals often occur when investor expectations change rapidly.
The catalyst may include:
- Monetary-policy surprises
- Economic data
- Earnings shocks
- Geopolitical developments
- Liquidity changes
- Financial-system stress
Machine learning may improve the ability to detect conditions associated with elevated reversal probability.
But it cannot consistently predict unexpected events.
This distinction is important.
A sophisticated model may identify vulnerability before a correction without knowing the exact event that triggers the decline.
Traditional Market Timing vs Machine Learning: Interpretability
Interpretability is one area where traditional indicators maintain a strong advantage.
Suppose a strategy reduces equity exposure because:
- The index is below the 200-day moving average.
- Market breadth is deteriorating.
- Credit spreads are widening.
- Volatility is rising.
Most investors can understand the reasoning.
A complex neural network might reach the same conclusion after processing thousands of variables, but explaining exactly why can be difficult.
Institutional investors often require transparent decision-making processes because investment committees must understand how risk is being managed.
For this reason, explainable machine learning is becoming increasingly important in quantitative finance.
Can Machine Learning Beat Traditional Indicators?
The answer depends on how the system is designed.
Machine learning has the potential to outperform simple indicators because it can analyze more information and detect complex interactions.
However, greater complexity introduces new risks.
These include:
- Overfitting
- Data leakage
- Transaction costs
- Changing market regimes
- Poor-quality datasets
- Survivorship bias
- Model instability
A simple trend-following system may sometimes outperform a sophisticated artificial intelligence model because the simpler system captures a persistent market phenomenon without fitting historical noise.
The relevant question is therefore not:
“Is machine learning better?”
A more useful question is:
“Does machine learning provide reliable out-of-sample improvement after costs and risk are considered?”
Transaction Costs Matter
A highly accurate prediction model may still produce poor trading results.
Suppose a machine learning system changes positions every few hours.
Even if many signals are directionally correct, transaction costs, spreads, taxes, slippage, and market impact can reduce profitability.
Traditional long-term timing models may trade less frequently.
This means investors should evaluate not only forecast accuracy but also implementation efficiency.
A model predicting 55% of moves correctly with low turnover may be more useful than a model achieving 60% accuracy while generating excessive trading.
Building a Hybrid Market Timing Framework
For many investors, the strongest approach may involve combining machine learning with traditional market indicators.
A hypothetical framework might examine five categories.
1. Trend
Analyze:
- 50-day moving average
- 200-day moving average
- Long-term momentum
2. Breadth
Monitor:
- Advance-decline data
- Percentage of stocks above major moving averages
- New highs versus new lows
3. Risk
Evaluate:
- Volatility
- Credit spreads
- Liquidity indicators
4. Macro Conditions
Monitor:
- Inflation
- Interest rates
- Economic growth
- Monetary policy
5. Machine Learning Probability
A machine learning model could combine all these signals with additional financial data and estimate the probability of favorable or unfavorable market conditions.
The investor could then adjust portfolio exposure gradually rather than relying on a single all-or-nothing prediction.
Example of Probability-Based Market Timing
Consider a hypothetical market environment.
The S&P 500 remains above its long-term moving average, suggesting that the primary trend is positive.
However:
Market breadth is weakening.
Volatility is rising.
Credit spreads are gradually widening.
Momentum is slowing.
A traditional approach might classify the environment as cautiously bullish.
A machine learning model analyzing similar historical conditions might estimate:
55% probability of positive returns during the next month.
45% probability of negative returns.
Instead of completely exiting equities, the investor might reduce exposure moderately.
If the probability later falls to 35% as additional indicators deteriorate, risk could be reduced further.
This illustrates how market timing can become a process of portfolio adjustment rather than dramatic predictions.
Data Quality Is More Important Than Algorithm Complexity
Investors often focus heavily on finding the most advanced machine learning algorithm.
But data quality may be even more important.
Models trained on inaccurate or biased information will produce unreliable conclusions regardless of algorithm sophistication.
Common financial-data problems include:
- Survivorship bias
- Missing historical constituents
- Revised economic data
- Look-ahead bias
- Incorrect timestamps
- Corporate-action adjustments
Institutional-quality quantitative research therefore requires careful data engineering before machine learning even begins.
Should Investors Abandon Traditional Technical Analysis?
Probably not.
Traditional technical analysis remains useful because price itself contains valuable information about market behavior.
Momentum, trend, volatility, and breadth are still important variables.
Machine learning should therefore be viewed as an additional analytical layer.
The future of market timing may involve combining human financial knowledge with computational analysis.
Human experts understand economic context, market structure, policy changes, and unusual events.
Algorithms excel at processing enormous datasets and identifying patterns.
Combining both capabilities can produce a more robust framework.
Machine Learning vs Traditional Market Timing Indicators for Long-Term Investors
Long-term investors may not need daily trading predictions.
Instead, market timing can help them identify periods when portfolio risk appears unusually high or unusually attractive.
Traditional long-term indicators such as the 200-day moving average, credit spreads, volatility, valuation, and economic trends can provide useful context.
Machine learning can then combine these signals into broader market-risk probabilities.
The objective should not necessarily be to avoid every correction.
It may simply be to reduce exposure during unusually unfavorable environments while remaining invested during strong long-term trends.
Market Timing Should Be a Risk Management Tool
The most practical way to use market timing is often as a risk-management framework.
Markets contain too many unpredictable variables for any model to guarantee future outcomes.
Instead of asking:
“Where will the market be next month?”
Investors may ask:
“What is the current probability distribution of possible outcomes?”
This changes the decision-making process.
If several independent indicators suggest rising risk, investors can adjust portfolio exposure, hedge positions, diversify assets, or reduce leverage.
When conditions improve, risk can gradually be restored.
This approach avoids the false expectation that investors must predict every market movement correctly.
Future of Machine Learning in Market Timing
Machine learning will likely continue becoming more important in quantitative investing.
Future models may combine information from:
- Market prices
- Options markets
- Economic releases
- Corporate filings
- Earnings calls
- News sentiment
- Satellite data
- Supply-chain information
- Social media
- Central-bank communication
Large language models may also improve the ability to process unstructured financial information.
However, increased computing power will not eliminate market uncertainty.
Markets continuously adapt because participants react to new strategies.
Once a profitable signal becomes widely known, its effectiveness may decline.
Successful market timing will therefore continue requiring rigorous testing, risk controls, and continuous evaluation.
Final Thoughts on Machine Learning vs Traditional Market Timing Indicators
The comparison between machine learning vs traditional market timing indicators should not be viewed as a battle between old and new technology.
Traditional indicators offer transparency, simplicity, and decades of market experience. Moving averages, momentum, breadth, volatility, interest rates, and credit conditions remain valuable tools for understanding market behavior.
Machine learning expands this framework by allowing investors to process much larger datasets, detect nonlinear relationships, identify market regimes, and produce probability-based forecasts.
But sophisticated algorithms introduce their own risks, particularly overfitting, data quality problems, and model instability.
For many investors, a hybrid approach may provide the most practical solution.
Traditional indicators can provide economically meaningful signals, while machine learning can evaluate how those signals interact across different market environments.
Ultimately, successful market timing is less about predicting every rally or correction and more about continuously evaluating probabilities.
Investors who combine market trends, volatility, breadth, macroeconomic conditions, quantitative models, and disciplined risk management may be better positioned to navigate changing financial-market cycles.
No indicator — traditional or machine-driven — can eliminate uncertainty. But a carefully designed framework can help investors identify when market conditions are becoming more favorable, when risks are increasing, and when portfolio exposure may need adjustment.
For investors interested in market timing research, quantitative signals, financial-market cycles, and advanced forecasting frameworks, explore the Financial Astrology & Market Timing Terminal for additional market analysis and timing tools:https://finance.rajeevprakash.com/
메타데이터
- post_id
- 53faf49d0366
- slug
- machine-learning-vs-traditional-market-timing-indicators-which-approach-works-better-53faf49d0366
- url
- https://medium.com/@fintechastrodunia/machine-learning-vs-traditional-market-timing-indicators-which-approach-works-better-53faf49d0366
- canonical_url
- https://medium.com/@fintechastrodunia/machine-learning-vs-traditional-market-timing-indicators-which-approach-works-better-53faf49d0366
- author_url
- https://medium.com/@fintechastrodunia
- status
- ok
- fetched_at
- 2026-08-15 05:31:41