9070 XT and RTX 5080: Microbenchmarks
This replaces my previous post "RTX 5080: Microbenchmarks". I now have also a 9070 XT for testing, so I updated my charts with first-party…
9070 XT and RTX 5080: Microbenchmarks
This replaces my previous post "RTX 5080: Microbenchmarks". I now have also a 9070 XT for testing, so I updated my charts with first-party benchmark results and other changes from direct experience with that GPU. So this post is Part II to both series: see Part I for the **RTX 5080, Part I for the [9070 XT](https://medium.com/@opinali/the-9070-xt-and-fsr-4-0-906235d1ddec)**.
In this story I look at synthetic microbenchmarks of GPU performance, comparing one Blackwell and one RDNA 4 GPU against their previous-gen predecessors and against each other. Check major reviewers for more comprehensive benchmarks, I’m going in-depth on less explored areas.
For the Radeon gen-over-gen comparisons, I also have first-party test data for AMD’s RDNA 3 7900 XTX. On the NVIDIA side I didn't have an Ada GPU to test so I used scores for the RTX 4080 Super from various sources.
There are ways to increase confidence in third-party data: choice of benchmarks; results on similar CPU/RAM and GPU tuning; recency. For some tests where I couldn’t source reliably comparable data, the 4080S will be out of the charts. Also, I picked the later 4080S instead of vanilla 4080 because the latter came with the same MSRP as the 5080 so it's the fair same-tier comparison.
As a baseline for my expectations, from 3DCenter’s average of top reviews (at 4K) we have the following "gen-over-gen" numbers:
- RTX 5080 vs. RTX 4080S: +12% Raster, +10% RT.
- 9070 XT vs. 7900 XTX: -7% Raster, +10% RT.
- RTX 5080 vs. 9070 XT: +21% Raster, +41% RT.
Blackwell barely hits the two digits gen-over-gen, disappointing but to be fair Ada was already on the same 4nm N4P process. NVIDIA invested on new features but those still have to prove significant impact on game performance. Meanwhile RDNA 4 is a great generational update; in some areas that was needed just to catch up, but generally the new 9000 series is punchinh above its weight in silicon and MSRP.
The RDNA 4 x Blackwell matching here is not perfect since the RTX 5080 and 9070 XT are in different tiers and price brackets, $600 vs $1,000. But these are the GPUs that I have to test. As a small balancing factor, my 9070 XT is a factory-overclocked SKU with a TGP that matches my RTX 5080 FE. (I will look at manual overclocking of both GPUs in future stories.)
3DMark: Game Rendering
This initial set of tests coversa great range of modern games: Steel Nomad for Raster-only engines, with the main tests more biased for looks and the Light variant closer to games favoring for high framerates like competitive multiplayers. Then we have “RT Medium” Port Royal, “RT High” Speed Way and “Full RT” / Path-Traced DirectX DXR.

In the green team, the RTX 5080 confirms a modest generational uplift beating the 4080S by a similar margin in every test, Raster or RT. The red side of this race is more interesting. The 9070 XT ties or beats its bigger predecessor 7900 XTX in most tests, except Steel Nomad Light. With Ray Tracing the 9070 XT beats the 4080S and lands very close to the 5080 in Port Royal but still lags behind NVIDIA in the two harder tests.
One way to look at these results is that Path Tracing its the only task where the 9070 XT doesn't greatly overperform. That GPU is significantly smaller and cheaper than all others in the chart, it had no business getting so close to the RTX 5080 in any of these tests. Again it’s pity that AMD skipped a true high-end SKU for this generation.
3DMark: DX12 Ultimate
These are tests for three features from 2020’s DX12 Ultimate. Mesh Shaders is the first of the three to break through with adoption by game engines like Snowdrop (Avatar and Star Wars Outlaws), Northlight (Alan Wake II), and UE 5 with Nanite (many). It’s becoming a staple of modern rendering.
In contrast, no PC game that I know of ever used Sampler Feedback or Variable Rate Shading; that might be changing with NVIDIA’s Half-Life 2 RTX use of Sampler Feedback (mostly saves VRAM).
One common trait of all three tests is that they are very simple Raster-only scenes, so we should expect a baseline performance similar to those 3DCenter Raster averages in all the "Off" subtests.
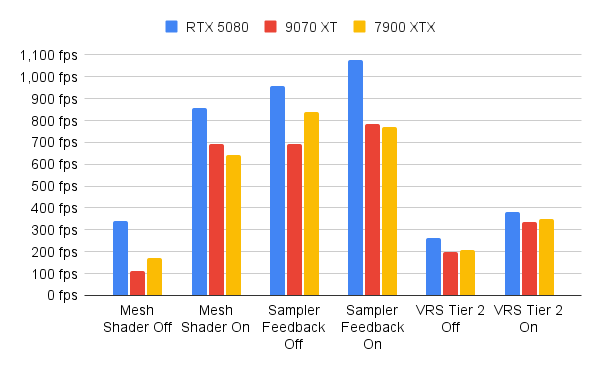
The RTX 5080 leads with Mesh Shading, while the 9070 XT beats the prev-gen 7900 XTX and scores an impressive 5.2X in the On:Off ratio. But the cup half-empty of that rate is that Radeon GPUs always perform very poorly in the Mesh Shader Off test. The test has a ton of raw geometry, historically a weakness of Radeon; and RDNA 4 shows no progress, performance per-CU is similar to RDNA 3 here. The good news is that modern games that have too much geometry are all adopting Mesh Shading.
Blackwell is also ahead in Sampler Feedback. That’s part because Radeon’s implementation was always so poor the On test scored lower than Off; its SF implementation was only good for DX12 API compliance. Here the 9070 XT shows strong progress, the On:Off ratio is now positive and the On test takes second place away from the 7900 XTX.
For Variable Rate Shading all GPUs are close, and they all work well.
3DMark: PCI Express
This measures how fast the CPU can pump data to the GPU and back. The PCIe connection will set a hard limit, and with both Blackwell and RDNA 4 introducing support for PCIe 5.0 I was curious to find if I can finally max out the theoretical max of 64 GB/s in my Zen 5 / AM5 system.
Why is this important? GamersNexus finds gains from PCIe5 are minimal, with the RTX 5090 losing max 2% compared to PCIe4 in games. For the specialized 3DMark PCI Express test, der8auer found the test is broken on Blackwell with impossibly-high scores of 120 GB/s for the RTX 5090.
My RTX 5080 delivered a saner score, but it’s still 2% above the possible 63.015 GB/s for 16 x PCIe5. In fact you can’t ever hit 100% of the limit because of overheads or inefficiencies in the drivers or app/benchmark.
My 9070 XT scores 54.92 GB/s: 87% of the limit. My 7900 XTX hit 28.06 Gbps, 89% of PCIe4’s max of 31.508 GB/s. Those very similar fractions are not a coincidence, the practical limit for this test is apparently ~90% of the spec. A good motherboard can get you a couple points over others.
Back to the RTX 5080 I configured my BIOS to force PCIe4 mode: 35.29GB/s, an even higher excess of 12% over the limit. So this is not a problem with the benchmark or with PCIe5, it’s particular to Blackwell. I reached out to UL Solutions and they confirmed to me that this is caused by a driver bug. NVIDIA is aware and we should eventually get a fix in a driver update. Driver bugs can make things too fast if they lose some data, drop frames, etc. which may be hard to notice in the animation rendered by this test.
It’ also worth mentioning der8auer’s puny RTX 4090 FE only hit 26.89 GB/s, 85% of PCIe4’s limit so it loses to both Radeons here. This could be an effect of AMD being first, and better as of prev-gen, at supporting PCIe ReBAR. Or maybe just more efficient driver behavior for this test.
3DMark: API Overhead
This 2015-era test has been deprecated for years so nobody uses it and it’s probably outdated in aspects like the mix of draw calls used by modern games or even the relevance of draw call throughput. However, I keep valuing this unique microbenchmark of GPU driver efficiency.

For all NVIDIA reputation of higher driver overhead, I don’t see that with the RTX 5080 although I’m not looking at CPU load or forcing bottlenecks.
The RTX 5080’s outsized win of +78% in multithreaded DX11 shows a long-standing advantage of NVIDIA. DX11’s support for MT was a hack despite Microsoft’s claim at launch “designed from the ground up for multithreading”. Yeah, that’s why DX12 needed a new and much better threading model. NVIDIA’s more CPU-driven scheduling helps and they also invested more on the DX11 driver while AMD focused on DX12 and Vulkan.
The much bigger gap in DX12 is more surprising, with the RTX 5080 +117% over the 7900 XTX and still +63% over the 9070 XT. Its large gap between DX12 and Vulkan however is strange, 101M vs 60M draws/s. The 9070 XT improved a lot in Vulkan, it even beats the RTX 5080 by +24%.
3DMark: DirectStorage
DX12’s new DirectStorage APIs curiously got a reputation for working better on AMD’s GPUs, despite NVIDIA’s creation of the GDeflate standard. On the other hand this API is an adaptation of I/O acceleration from the XBox and AMD certainly carried strong experience from that partnership.
3DMark’s result UI is great to illustrate all scores and they look OK here. Comparing this to other GPUs is difficult because too many components contribute: GPU, CPU, DRAM, SSD, and all their drivers; so once again I can only compare GPUs that I could test on the same exact build.

The difference is small but my previous-gen 7900 XTX beat the RTX 5080, especially in GDeflate: 74 GB/s vs 70 GB/s. This decompression runs on the GPU, NVIDIA has a branded RTX IO toolkit for this and it should benefit from RTX 5080’s 30Gbps GDDR7; all that makes it hard to explain a loss even to the older Radeon from a previous generation.
The new 9070 XT only comes in second place in the GDeflate test that craves raw power. Microarchitecture optimizations that “work smarter” don’t help when some code simply needs more shaders and bandwidth, things the 7900 XTX offers in abundance. The RTX 5080 gets very close but not quite, and I don’t think it would be so close without the faster GDDR7.
In any case, again the results are close and I didn’t observe any obvious problem with the games I have using DirectStorage. I’m not sure I would notice anything at naked eye — the only solid report about this seems to be Ratchet & Clank: Rift Apart losing 10% average FPS and 24% 1pct Lows. Initial reports of similar losses in Forspoken were debunked.
I also tested the RTX 5080 in PCIe4 mode and scored up to -2% vs PCIe5, so this benchmark is also not limited by PCIe4 x 16. I used a Samsung 990 PRO 2TB, PCIe4 x 4, which should limit the SSD→RAM leg of the benchmark.
GeekBench 6.4
GeekBench tests GPGPU workloads. The CPU tests are still relevant but I see the GPU tests more useful now as a measure of API overhead for OpenCL and Vulkan; some tests could be described as “oldschool AI”. Others are still representative of productivity apps like photo editors.
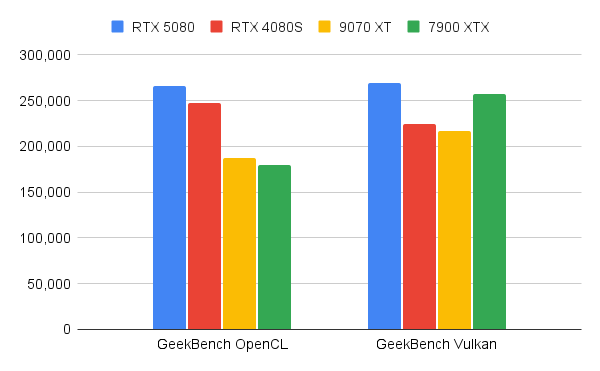
The OpenCL and Vulkan APIs are a tie only in the RTX 5080, perhaps showing an improved Vulkan driver against previous-gen RTX 4080S. Meanwhile the 9070 XT made progress disproportionally in OpenCL, so much that it gets close to a tie with the RTX 5080.
GeekBench AI 1.3
AI APIs like ONNX and DirectML are the hot new thing but they’re still evolving and the benchmark is often updated to catch up; v1.3 came out too late for my first-party testing with the 7900 XTX.

The RTX 5080 is close to its predecessor in the Single-Precision (FP32) and the Quantized (INT8) tests; only the Half-Precision (FP16) test shows more progress over the RTX 4080S. Radeon’s AI acceleration looks excellent, with the 9070 XT beating the RTX 5080 in two out of three tests.
The results however are inconclusive, because of benchmark limitations. There are no tests for FP8 or sparsity — both features missing in RDNA 3 but now supported by RDNA 4. There’s also no support for any vendor-specific AI APIs on Windows/PC such as NVIDIA’s CUDA/TensorRT or AMD’s ROCm, and these APIs can still deliver a large performance advantages especially for the more mature NVIDIA software stack.
Blender
To my surprise the “film-quality” renderers used by popular benchmarks Blender and CineBench didn’t work at launch on Blackwell or RDNA 4. Blender later released their update 4.4.0 adding support for both new GPU architectures. CineBench’s Redshift engine is W.I.P. for Blackwell, no news yet about RDNA 4. So I’m only testing Blender.
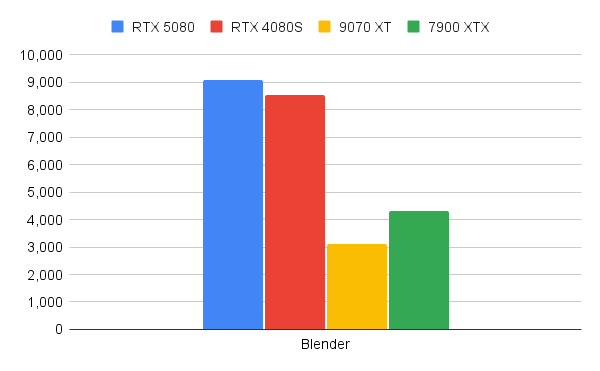
These renderers were always an easy, massive win for NVIDIA because of both hardware and software factors: stronger RT Cores and more mature and popular SDKs like CUDA and now OptiX. My RTX 5080 scores more than 2X the performance of either Radeon GPU.
AMD’s 9070 XT made good progress with its RT Cores but software support is still not quite there. Blender 4.4.0 is the first release with non-preview support for HIP-RT, AMD’s direct competition of OptiX. But this support is not yet enabled by default and AFAIK not used in BlenderBench. Even if you enable HIP-RT the Cycles engine makes limited use of its features, not fully benefiting from RDNA’s RT Cores. You can set up Blender to use AMD’s ProRender engine, but that’s not an option in the popular BlenderBench and these pluggable renderers are differentiated in image quality so a straight performance comparison is not possible. In short, the spanking of Radeon GPUs will continue until support for HIP-RT is complete.
Conclusions
The RTX 5080 so far confirms my expectations, largely because synthetic benchmarks can be excellent: In particular, the “game-like” 3DMark tests in the first section are extremely consistent with the relative performance of the four tested GPUs in 3DCenter’s average of lots of real-game reviews. TLDR it’s a little faster than same-tier Ada.
Some interesting findings here include an NVIDIA driver bug that breaks the 3DMark PCIe test; excellent gains from both Blackwell and RDNA 4 in 3DMark API Overhead; AMD still leading with DirectStorage; and solid support from both GPU vendors for portable GPGPU & AI APIs (OpenCL, Vulkan, ONNX and DirectML). We can see also that the red team still needs to catch up in software support for non-gaming apps. At the same time the 9070 XT clearly overperforms for its tier/price in most gaming tests.
UPDATE: Check out this Ancient Gameplays video, RX 7900 XTX vs RX 9070 XT vs RTX 5080 — Productivity, Gaming & VR Benchmarks that takes a very similar approach but with different tests.
메타데이터
- post_id
- 54528658f83d
- slug
- 9070-xt-and-rtx-5080-microbenchmarks-54528658f83d
- url
- https://medium.com/@opinali/9070-xt-and-rtx-5080-microbenchmarks-54528658f83d
- canonical_url
- https://medium.com/@opinali/9070-xt-and-rtx-5080-microbenchmarks-54528658f83d
- author_url
- https://medium.com/@opinali
- status
- ok
- fetched_at
- 2026-06-26 03:39:16