Trade the Volatility Envelope: A Beginner-Friendly Bollinger Bands Trading Strategy
Introduction
Trade the Volatility Envelope: A Beginner-Friendly Bollinger Bands Trading Strategy
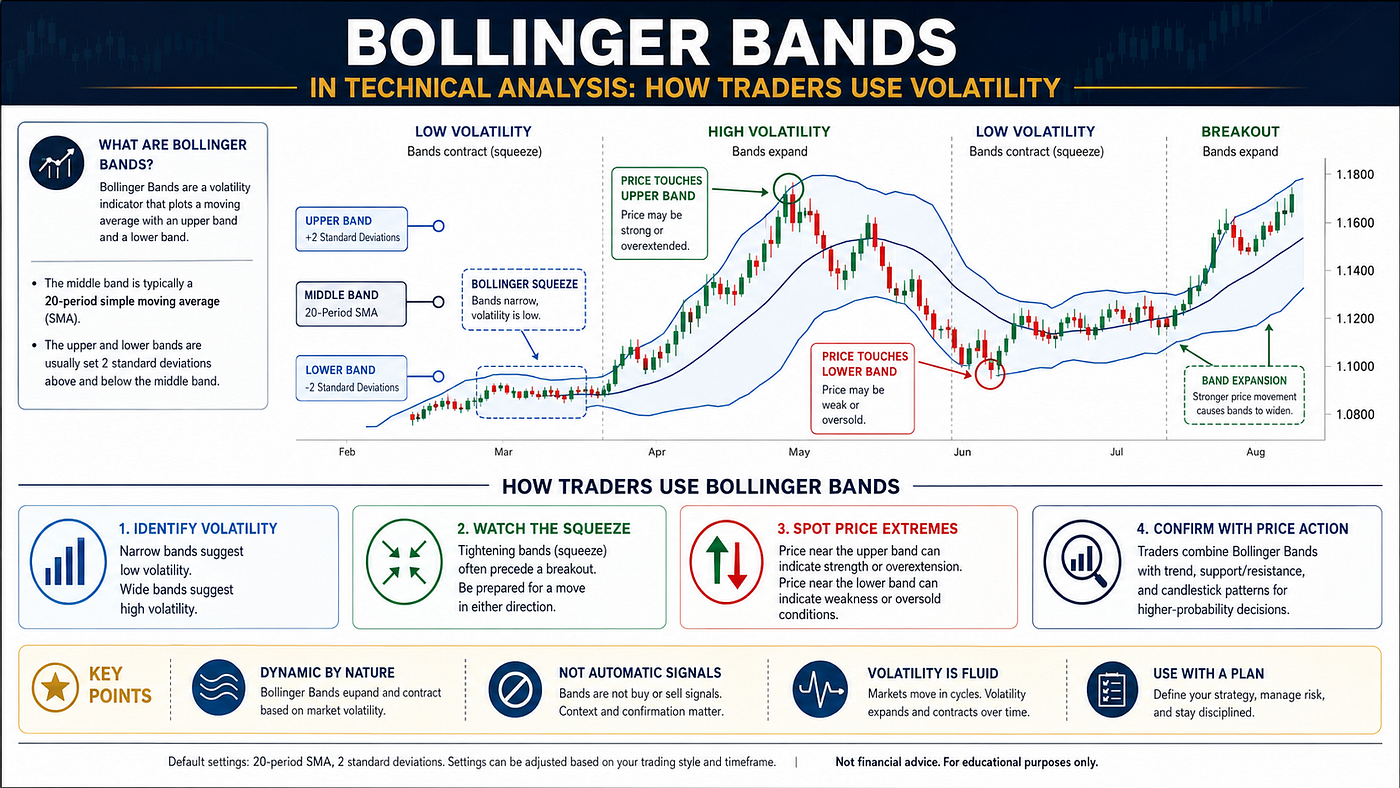
Bollinger Bands
Introduction
A strong Bollinger Bands trading strategy helps traders understand volatility, trend strength, price extremes, and possible breakout zones. Many beginners see Bollinger Bands on a chart and assume they only show overbought and oversold levels. That view is too narrow. Bollinger Bands can also help traders study compression, expansion, pullbacks, reversals, and continuation moves.
Bollinger Bands are a technical analysis tool built around a moving average and two outer bands. These outer bands usually sit two standard deviations above and below the middle moving average. Because the bands use standard deviation, they expand when volatility rises and contract when volatility falls. Fidelity explains Bollinger Bands as price envelopes plotted above and below a simple moving average, with the band distance adjusting to volatility.
For traders, this matters because markets do not move at the same speed every day. Some days bring calm price action. Other days bring sharp breakouts, heavy selling, or fast reversals. A practical Bollinger Bands trading strategy helps traders adapt to those changing conditions instead of using the same entry rule in every market.
What Are Bollinger Bands?
Bollinger Bands include three main parts. The middle band is usually a 20-period simple moving average. The upper band sits above that average, and the lower band sits below it. Most charting platforms use two standard deviations for the upper and lower bands by default.
The middle band shows the average price trend. The upper and lower bands show how far price has moved from that average. When price moves near the upper band, upside momentum may be strong. When price moves near the lower band, downside pressure may be active.
However, traders should not treat every touch of the upper band as a sell signal. They should also not treat every touch of the lower band as a buy signal. In strong trends, price can walk along the band for a long time. This is why a good Bollinger Bands trading strategy studies trend, volume, support, resistance, and confirmation before making a decision.
Why Bollinger Bands Matter in Technical Analysis
Bollinger Bands matter because they make volatility visible. Volatility shows how much price moves over time. When bands widen, price movement has become more active. When bands narrow, price movement has become calmer.
This change can help traders prepare. A narrow band structure may signal that the market is building pressure. A wide band structure may show that the market has already made a large move and may need time to settle.
Schwab notes that Bollinger Bands can help traders identify sharp short-term price moves and possible entry or exit points. It also describes the indicator as a flexible tool for evaluating price action and volatility.
A smart Bollinger Bands trading strategy does not predict direction from volatility alone. Instead, it waits for price to confirm the next move. Volatility tells traders that energy is changing. Price action tells them where that energy may go.
The Bollinger Bands Squeeze
The Bollinger Bands squeeze is one of the most popular setups. A squeeze happens when the bands contract tightly around price. This shows that volatility has dropped. Markets often move from low volatility to high volatility, so traders watch squeezes for possible breakouts.
A squeeze does not tell traders whether price will break up or down. It only tells them that the market may be preparing for a larger move. The breakout direction needs confirmation from price, volume, trend, and market context.
For example, if price breaks above resistance after a squeeze and volume rises, buyers may be gaining control. If price breaks below support after a squeeze and volume expands, sellers may be taking control.
A practical Bollinger Bands trading strategy uses the squeeze as an alert, not as an automatic trade. The squeeze tells traders to pay attention. The breakout confirms whether the opportunity is real.
Riding the Upper Band
Many beginners assume that price near the upper Bollinger Band means the asset is overbought. Sometimes that is true. However, in a strong uptrend, price can keep touching or riding the upper band while the trend continues.
This behavior shows strong demand. Buyers remain active, and pullbacks stay shallow. Traders who sell only because price touches the upper band may exit too early or short a strong trend.
A better Bollinger Bands trading strategy asks a few simple questions. Is the market in an uptrend? Is price making higher highs and higher lows? Is volume supporting the move? Is the middle band rising? If the answer is yes, the upper band may show strength rather than exhaustion.
In this case, traders may use pullbacks toward the middle band as possible entries. They may also trail stops below recent swing lows instead of trying to call the exact top.
Testing the Lower Band
Price near the lower Bollinger Band can show selling pressure. In a weak market, price may keep touching the lower band while the downtrend continues. This can trap beginners who buy only because the asset looks oversold.
A lower band touch becomes more useful when price reaches support, selling volume slows, and a reversal candle appears. If price reclaims the middle band after a lower band test, buyers may be gaining strength.
A strong Bollinger Bands trading strategy avoids blind buying. It waits for evidence. Lower band touches can create opportunity, but only when price confirms that sellers are losing control.
This idea is especially important in fast-moving markets such as crypto, commodities, and high-beta stocks. These assets can stay weak longer than expected. Good traders protect capital first.
The Middle Band as a Trend Guide
The middle Bollinger Band often acts like a trend filter. In many settings, it uses a 20-period simple moving average. When price stays above the middle band, buyers may control short-term momentum. When price stays below it, sellers may control momentum.
In an uptrend, price may pull back toward the middle band and bounce. In a downtrend, price may rally toward the middle band and fail. This makes the middle band useful for timing entries.
A balanced Bollinger Bands trading strategy does not focus only on the outer bands. The middle band often gives cleaner information. It shows whether price has returned to its average zone or moved far away from it.
For swing traders, the middle band can help define whether a pullback remains healthy. For intraday traders, it can help judge whether momentum is shifting during the session.
Bollinger Bands and Support and Resistance
Bollinger Bands become more useful when traders combine them with support and resistance. The bands show volatility and relative price position. Support and resistance show where buyers and sellers have reacted before.
If price reaches the lower band near a major support zone, traders may watch for a possible bounce. If price reaches the upper band near strong resistance, traders may become cautious. However, confirmation still matters.
For deeper chart structure, traders can study Support and Resistance in Technical Analysis: A Practical Trading Guide. That guide explains how important price zones help traders plan entries, exits, stop-loss levels, and targets.
A good Bollinger Bands trading strategy uses support and resistance as the map and Bollinger Bands as the volatility lens. When both tools point to the same area, the setup becomes more meaningful.
Bollinger Bands and RSI
The Relative Strength Index, or RSI, can help confirm Bollinger Band signals. Bollinger Bands show volatility and price location. RSI shows momentum.
For example, price may touch the lower band while RSI forms a bullish divergence. This can suggest that downside momentum is weakening. Price may also touch the upper band while RSI forms bearish divergence. This can warn that upside momentum is slowing.
However, traders should avoid using too many signals at once. The goal is not to make the chart complicated. The goal is to improve confirmation.
For a deeper momentum guide, read RSI Indicator Explained: How Traders Spot Overbought and Oversold Zones. RSI can support a Bollinger Bands trading strategy by helping traders judge whether a band touch has real momentum behind it.
Bollinger Bands and Volume
Volume validates price movement. A breakout from a Bollinger Bands squeeze becomes stronger when volume rises. A band breakout with weak volume may fail quickly.
If price breaks above the upper band with strong volume and clears resistance, buyers may have conviction. If price breaks below the lower band with heavy volume and loses support, sellers may control the move.
This is why traders should remember a simple principle: financial astrology prepares, technical analysis confirms, volume validates, and risk management protects.
A complete Bollinger Bands trading strategy should never ignore volume. Price can move beyond the band, but volume helps traders decide whether the move has real participation.
Mean Reversion With Bollinger Bands
Mean reversion means price may return toward its average after moving too far away. Bollinger Bands can help traders spot these stretched conditions.
When price moves far above the upper band, traders may wait for signs that momentum is slowing. When price moves far below the lower band, traders may wait for signs that selling pressure is fading.
Mean reversion works best in sideways or range-bound markets. It works poorly in strong trends. This is why traders must first identify market conditions.
A mean-reversion Bollinger Bands trading strategy may look for price rejection near the outer band, confirmation from RSI, and a move back toward the middle band. The middle band often becomes the first target.
Still, traders should use stop-loss levels. A stretched market can become more stretched before it reverses.
Trend Continuation With Bollinger Bands
Bollinger Bands also support trend-following strategies. In a strong uptrend, price may stay above the middle band and repeatedly test the upper band. In a strong downtrend, price may stay below the middle band and repeatedly test the lower band.
Trend traders should not fight this behavior. Instead, they can use pullbacks toward the middle band as potential entry zones. They can also use recent swing lows or highs to manage risk.
A trend-following Bollinger Bands trading strategy works best when the broader market supports the move. For example, a bullish stock setup has better odds when the sector and index also show strength. A bearish commodity setup may work better when macro conditions support selling pressure.
This is why market context matters. Indicators work best when they align with the bigger picture.
Bollinger Bands for Intraday Traders
Intraday traders can use Bollinger Bands on 5-minute, 15-minute, or hourly charts. The bands help them judge whether price is stretched during the session.
For example, if Nasdaq rallies sharply into the upper band after the open, an intraday trader may wait for a pullback instead of chasing. If price holds the middle band and volume remains strong, the trend may continue. If price breaks below the middle band with volume, momentum may shift.
Intraday traders should stay careful during low-volume periods. Midday markets can create false signals. News events can also push price beyond the bands very quickly.
A disciplined Bollinger Bands trading strategy for intraday trading should include clear entries, exits, stop-loss levels, and position sizing. Fast charts require faster decisions, so traders need a plan before entering.
Bollinger Bands for Swing Traders
Swing traders often use Bollinger Bands on daily charts. This allows them to study larger price swings and avoid short-term noise.
A swing trader may watch for a squeeze before earnings, a breakout from consolidation, or a pullback to the middle band in an uptrend. The trader may also use weekly charts to confirm the bigger trend.
A swing-based Bollinger Bands trading strategy should include support and resistance, sector direction, volume, and risk-reward. If the next resistance level sits too close, the trade may not offer enough upside.
Swing traders should also avoid entering only because price touches a band. The best setups usually combine band behavior with chart structure and confirmation.
Risk Management With Bollinger Bands
No indicator removes risk. Bollinger Bands can create false signals, especially during news events, strong trends, and sudden volatility spikes.
Before entering a trade, traders should define the stop-loss, target, position size, and risk-reward ratio. If buying a pullback near the middle band, the stop may sit below the recent swing low. If trading a breakout, the stop may sit below the breakout zone.
A good Bollinger Bands trading strategy protects the account first. Traders should not risk too much on one setup. They should also avoid revenge trading after a failed breakout.
Risk management turns technical analysis into a professional process. Without it, even a good indicator can lead to poor results.
How the Financial Astrology Terminal Supports Volatility Analysis
Modern traders need more than one indicator. They need market data, charts, watchlists, global stocks, indices, commodities, and timing tools in one place. The Financial Astrology Terminal helps traders and investors combine market data, charts, watchlists, global stocks, indices, commodities, and financial astrology-based timing insights in one platform.
This can support a stronger Bollinger Bands trading strategy because volatility often expands around important market windows. A trader may watch a Bollinger Bands squeeze in gold, Nasdaq, crude oil, or a major stock while also reviewing broader timing conditions.
Financial astrology should prepare traders for sensitive periods. Technical analysis should confirm price behavior. Volume should validate participation. Risk management should protect capital.
This balanced approach helps traders avoid relying on one signal alone.
Internal Learning Path for Traders
Traders who are new to chart reading can begin with Technical Analysis for Beginners: How to Read Price Charts Like a Trader. That article builds the foundation for reading price charts, trends, support, resistance, and volume.
After that, traders can study Technical Analysis vs Price Action: What Is the Difference? to understand how indicators and raw price behavior work together.
For a neutral external reference, traders can review Fidelity’s guide to Bollinger Bands, which explains the indicator’s structure and volatility-based behavior.
Common Mistakes Traders Should Avoid
Many traders make Bollinger Bands too mechanical. They sell every upper band touch and buy every lower band touch. This can fail badly in strong trends.
Another mistake is ignoring the squeeze direction. A squeeze only shows low volatility. It does not predict whether price will break upward or downward. Traders must wait for price confirmation.
Some traders also forget volume. A breakout without volume may not last. Others use Bollinger Bands without support, resistance, trend, or stop-loss planning.
A reliable Bollinger Bands trading strategy stays simple. It studies volatility, trend, price levels, volume, and risk. It avoids blind signals and emotional trades.
Conclusion
Bollinger Bands help traders read volatility with more clarity. They show when price moves away from its average, when volatility contracts, and when expansion may begin. However, they work best when traders use them with trend analysis, support and resistance, RSI, volume, and strong risk management.
A smart Bollinger Bands trading strategy does not treat the upper band as an automatic sell signal or the lower band as an automatic buy signal. It studies market context first. In a strong trend, price can ride the bands. In a range, price may return toward the middle band. During a squeeze, price may prepare for a larger breakout.
The best traders combine preparation, confirmation, validation, and protection. Financial astrology prepares, technical analysis confirms, volume validates, and risk management protects.
메타데이터
- post_id
- 54af6a369bbf
- slug
- trade-the-volatility-envelope-a-beginner-friendly-bollinger-bands-trading-strategy-54af6a369bbf
- url
- https://medium.com/@astroduniafintech5/trade-the-volatility-envelope-a-beginner-friendly-bollinger-bands-trading-strategy-54af6a369bbf
- canonical_url
- https://medium.com/@astroduniafintech5/trade-the-volatility-envelope-a-beginner-friendly-bollinger-bands-trading-strategy-54af6a369bbf
- author_url
- https://medium.com/@astroduniafintech5
- status
- ok
- fetched_at
- 2026-06-09 15:37:30