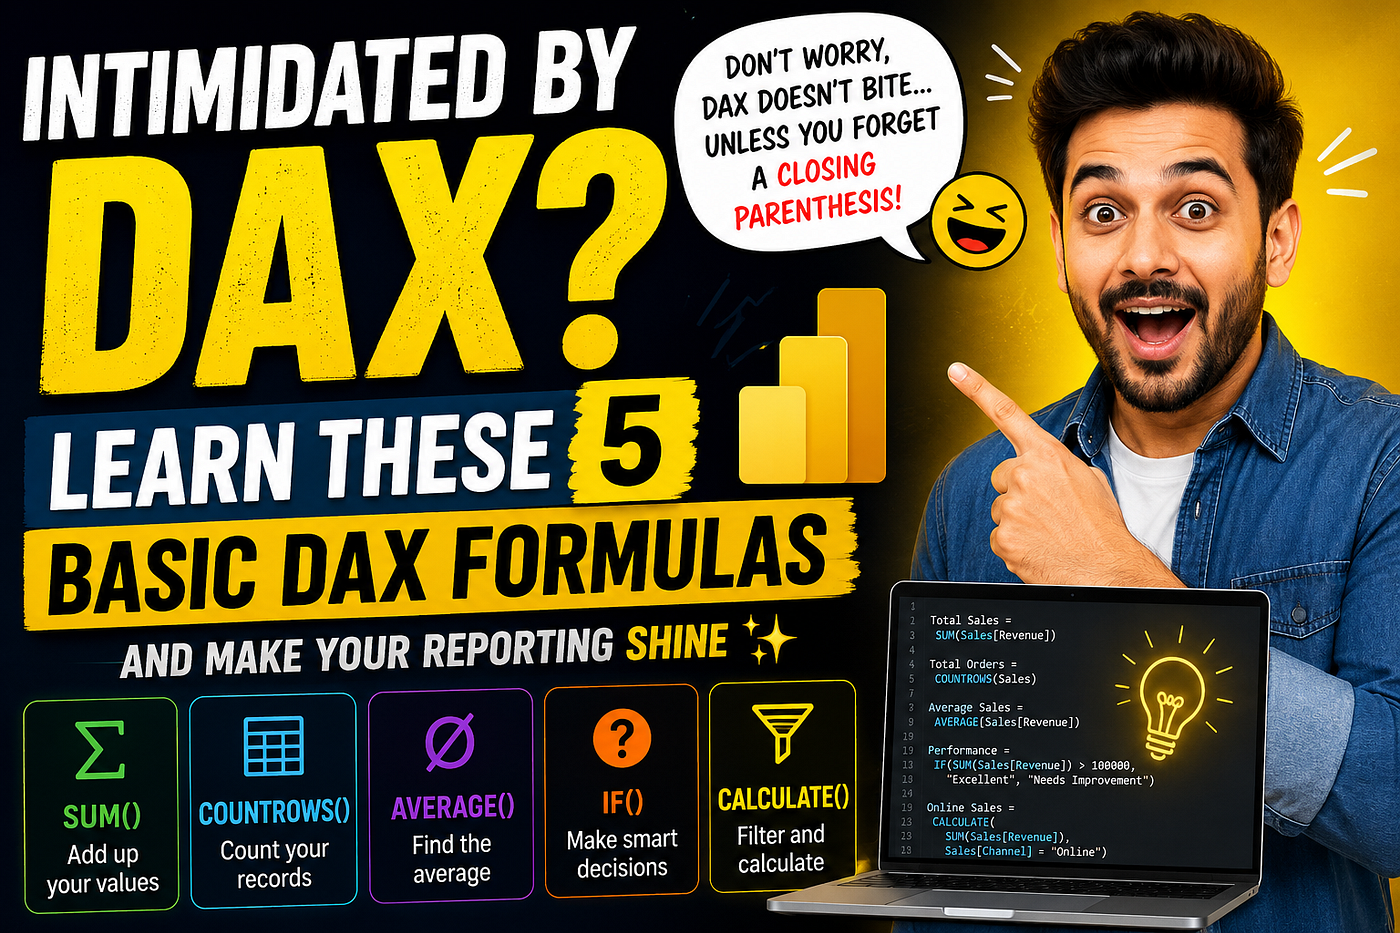
Intimidated by DAX? Learn These 5 Basic DAX Formulas and Make Your Reports Shine 🚀
Don’t worry. DAX doesn’t bite… unless you forget a closing parenthesis.😅
Intimidated by DAX? Learn These 5 Basic DAX Formulas and Make Your Reports Shine 🚀
Don’t worry. DAX doesn’t bite… unless you forget a closing parenthesis.😅
If you’ve ever opened Power BI, clicked on New Measure, and stared at the blinking cursor like it was judging your life choices…
Congratulations. You’ve officially met DAX (Data Analysis Expressions).
Most beginners think DAX is some secret language invented by data scientists who enjoy making spreadsheets cry. The truth? DAX is simply a tool that helps Power BI answer questions about your data. Think of it like teaching your report to think for itself. Instead of manually calculating everything in Excel every Monday morning (while questioning your career), DAX does it automatically.
The good news? You don’t need to learn 300 formulas. Just mastering a handful can completely transform your dashboards.
Let’s start with the five formulas every beginner should know.
1. SUM()
- How it works: Adds up all the values in a column. Simple. Reliable. Basically the “Mom” of DAX formulas — it keeps everything together.
- The Formula:- Code snippet
Total Sales = SUM(Sales[Revenue])Now your report instantly shows total revenue. No calculator. No panic. No “Oops, I forgot row 15,432.”
Real-Life Example:
Imagine your manager asks: “How much revenue did we make this year?”
Instead of scrolling endlessly through Excel, Power BI replies instantly. Your manager smiles. You smile. Excel quietly wonders if it’s being replaced.
2. COUNTROWS()
- How it works: Sometimes you don’t need totals. You just want to know, “How many records do we have?” That’s where
COUNTROWScomes in. It counts the exact number of rows in a specific table. - The Formula:- Code snippet
Total Orders = COUNTROWS(Sales)If your table has 15,000 transactions, COUNTROWS tells you exactly how many entries exist. No manual counting. Because we're analysts—not kindergarten teachers counting crayons.
3. AVERAGE()
- How it works: Managers love averages. Average salary. Average sales. Average order value. Average coffee consumed before Monday meetings. This function calculates the arithmetic mean of a column.
- The Formula:- Code snippet
Average Sales = AVERAGE(Sales[Revenue])Suppose your transaction amounts are 100, 200, and 300. The average? 200. Easy. Now your dashboard looks smarter without you doing any complicated mental math.
4. IF()
- How it works: This is where DAX becomes fun.
IFhelps reports make decisions based on a condition. Imagine teaching your dashboard: "If sales are good, celebrate. If not... maybe send another marketing email." - The Formula: (Pro-tip: We can reuse the
[Total Sales]measure we built in step one!):- Code snippet
Performance =
IF(
    [Total Sales] > 100000,
    "Excellent",
    "Needs Improvement"
)
Now your report automatically labels performance. No manual checking. No color-coded sticky notes. Just intelligence. Well… spreadsheet intelligence.
5. CALCULATE()
- How it works: This is the superstar of DAX. Many experts call it the most powerful function in Power BI. At first, it looks scary — kind of like assembling IKEA furniture. But once it clicks, everything suddenly makes sense.
CALCULATElets you evaluate a measure under a modified filter context. - The Formula:- Code snippet
Online Sales =
CALCULATE(
    [Total Sales],
    Sales[Channel] = "Online"
)- Want store sales? Change one word.
- Want sales from Europe? Easy.
- Want sales during holidays? Still easy.
CALCULATE lets you filter data while calculating. That's why professionals use it everywhere.
Why These Five Formulas Matter
Many beginners jump straight into advanced DAX. Big mistake. It’s like buying a Formula 1 car before learning how to drive.
Master these five first. You’ll already be ahead of many Power BI users, and everything else builds on these basics.
A Simple Practice Challenge

Open one of your own datasets and create these five measures:
- ✅ Total Sales (using
SUM) - ✅ Total Orders (using
COUNTROWS) - ✅ Average Revenue (using
AVERAGE) - ✅ Performance Status (using
IF) - ✅ Sales by Category (using
CALCULATE)
Congratulations! You’ve already written more DAX than many people who say, “Yeah… I know Power BI.”
Common Beginner Mistakes (We’ve All Been There)
- Missing parentheses: One tiny bracket can turn a perfect formula into a red error message.
- Misspelled column names: Power BI isn’t being rude; it genuinely has no idea what
Reveneumeans. - Using SUM instead of SUMX: Don’t worry about this one yet. That’s iterative DAX. Baby steps. Even superheroes started by tripping over their capes.
Tips to Learn DAX Faster
- Practice with real datasets instead of generic sample files.
- Create one new measure every single day.
- Read your formulas aloud — it helps you understand the underlying logic.
- Don’t memorize everything. Learn what problem each function is meant to solve.
- When an error appears, treat it like a clue, not a disaster.
Remember, every experienced Power BI developer has spent time wondering why a formula wouldn’t work — only to discover they forgot a comma or a parenthesis.
Final Thoughts
DAX has a reputation for being intimidating, but most of that fear comes from trying to learn too much at once. Start with SUM(), COUNTROWS(), AVERAGE(), IF(), and CALCULATE(). These five formulas can handle a surprising number of everyday reporting tasks and give you a strong foundation for more advanced analytics.
The next time someone asks, “Can you build a Power BI dashboard?” you won’t need to panic. You’ll know exactly where to begin.
And if your first DAX formula throws an error? Congratulations. You’re officially learning DAX. Welcome to the club. 🎉
Where are you planning to publish this article (e.g., LinkedIn, Medium, a personal blog)?
👋 Enjoyed This Article?
If this guide helped you take the first step into DAX, consider following me on Medium. I share practical tutorials, AI productivity tips, Power BI tricks, and real-world tech insights — all explained in plain English with a little humor to make learning enjoyable.
Happy learning, and may all your measures return the right results! 📊✨
메타데이터
- post_id
- 5619ebd5d489
- slug
- intimidated-by-dax-learn-these-5-basic-dax-formulas-and-make-your-reports-shine-5619ebd5d489
- url
- https://medium.com/@digitalbykewat/intimidated-by-dax-learn-these-5-basic-dax-formulas-and-make-your-reports-shine-5619ebd5d489
- canonical_url
- https://medium.com/@digitalbykewat/intimidated-by-dax-learn-these-5-basic-dax-formulas-and-make-your-reports-shine-5619ebd5d489
- author_url
- https://medium.com/@digitalbykewat
- status
- ok
- fetched_at
- 2026-07-09 16:18:44




