Announcing LightningChart JS 8.3: sunburst charts, multithreading, new dashboards
What is LightningChart JS?
Announcing LightningChart JS 8.3: sunburst charts, multithreading, new dashboards
What is LightningChart JS?
LightningChart JS is a data visualization library for building high-end JavaScript charting applications in complex scenarios that demand high-performance data processing.
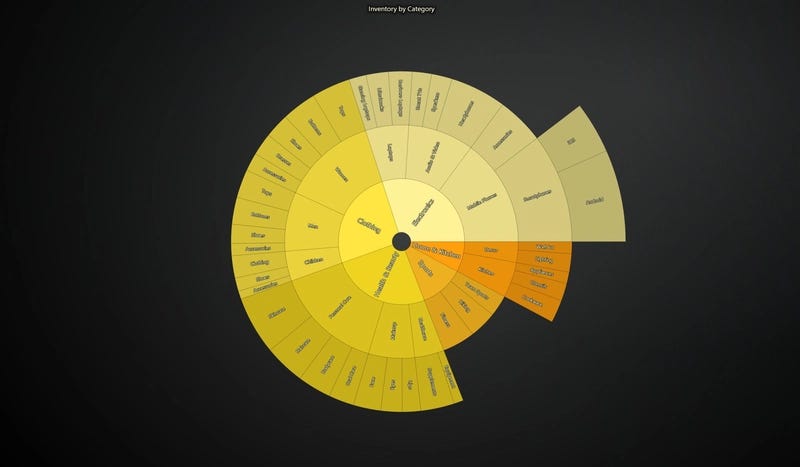
Introducing the Sunburst Chart
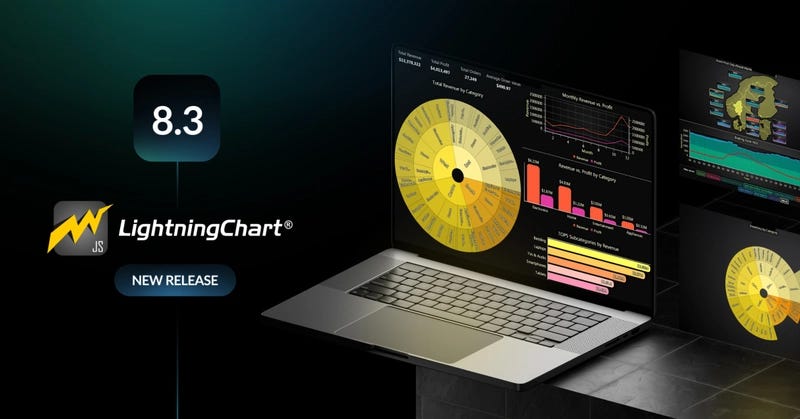
LightningChart JS introduces the sunburst chart, used for displaying hierarchical data as a series of aligned rings. LightningChart JS now makes it easier to explore part-to-whole relationships simultaneously across multiple levels.
Multithreading Performance Optimizations
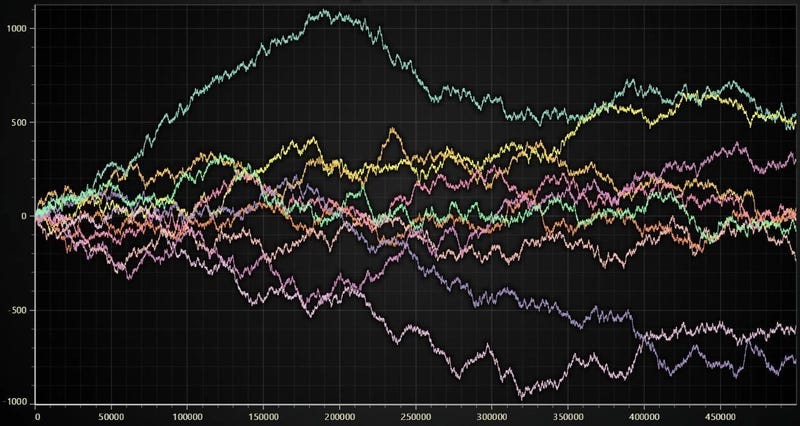
Just when you thought that LightningChart JS could not get any faster, version 8.3 introduces Multi-threading Performance Optimizations as a built-in functionality to make your charts even snappier.
By using multi-threading, we were able to load an absolutely massive data visualization with 40 channels and 10 million data points each in just above 1 second. And you can zoom in/out/reload data without any lag.
JS Drill-Down Nord Pool Map Dashboard
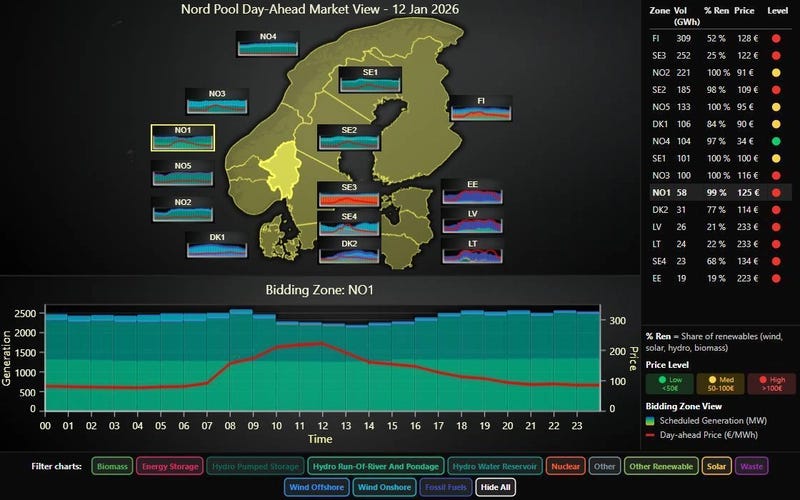
Introducing the JavaScript Drill-Down Nord Pool Map Dashboard, which visualizes day-ahead market data from the Nord Pool energy exchange. It provides a geographic overview of the next day’s planned power generation across the Nordic-Baltic region.
Sunburst Chart Dashboard
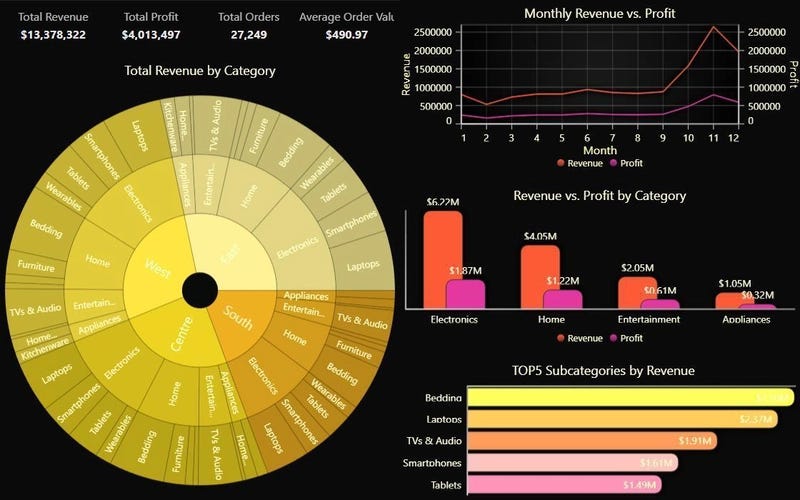
Introducing the Sunburst chart dashboard, which combines a regional map with embedded sparkline-style charts, a sortable summary table with status indicators, a dual-axis chart pairing stacked columns with an overlaid line series on a shared time axis, and a row of toggle chips for filtering.
Other Improvements
LightningChart JS 8.3 comes with several more improvements, including:
- Built-in axis zebra stripes
- Out-of-the-box text color contrast improvements
- Built-in chart opacity filter
- Rectangle series histogram usability improvements
To see the full list of changes and improvements, visit the changelog or read the official release note.
Get started with LightningChart JS 8.3 today
메타데이터
- post_id
- 56a8a32afbc8
- slug
- announcing-lightningchart-js-8-3-sunburst-charts-multithreading-new-dashboards-56a8a32afbc8
- url
- https://medium.com/@lightningchart/announcing-lightningchart-js-8-3-sunburst-charts-multithreading-new-dashboards-56a8a32afbc8
- canonical_url
- https://medium.com/@lightningchart/announcing-lightningchart-js-8-3-sunburst-charts-multithreading-new-dashboards-56a8a32afbc8
- author_url
- https://medium.com/@lightningchart
- status
- ok
- fetched_at
- 2026-06-09 15:37:30