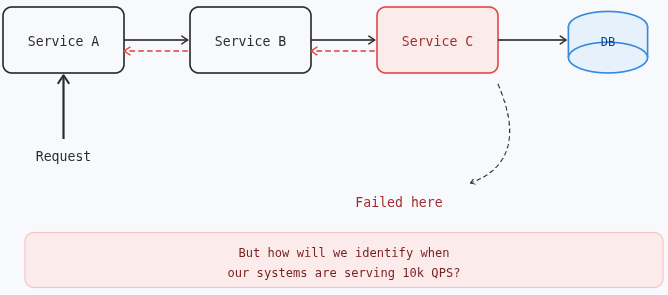
Part 2: Stop Flying Blind — Instrument Your FastAPI App using Opentelemetry (Implementation)
Part 1 : https://medium.com/p/915787b1a4af
Part 2: Stop Flying Blind — Instrument Your FastAPI App using Opentelemetry (Implementation)
Part 1 : https://medium.com/p/915787b1a4af
In part 2, we’ll be :
- Setting up the codebase
- Dockerizing app, database and OTEL components(loki, tempo, grafana, collector)
- Setting up the docker-compose command to boot all containers using a single command
- See live logs and traces for database transactions, application logging and requests
Github Repo : https://github.com/hardikambati/fastapi-otel-demo
What we’ll be building
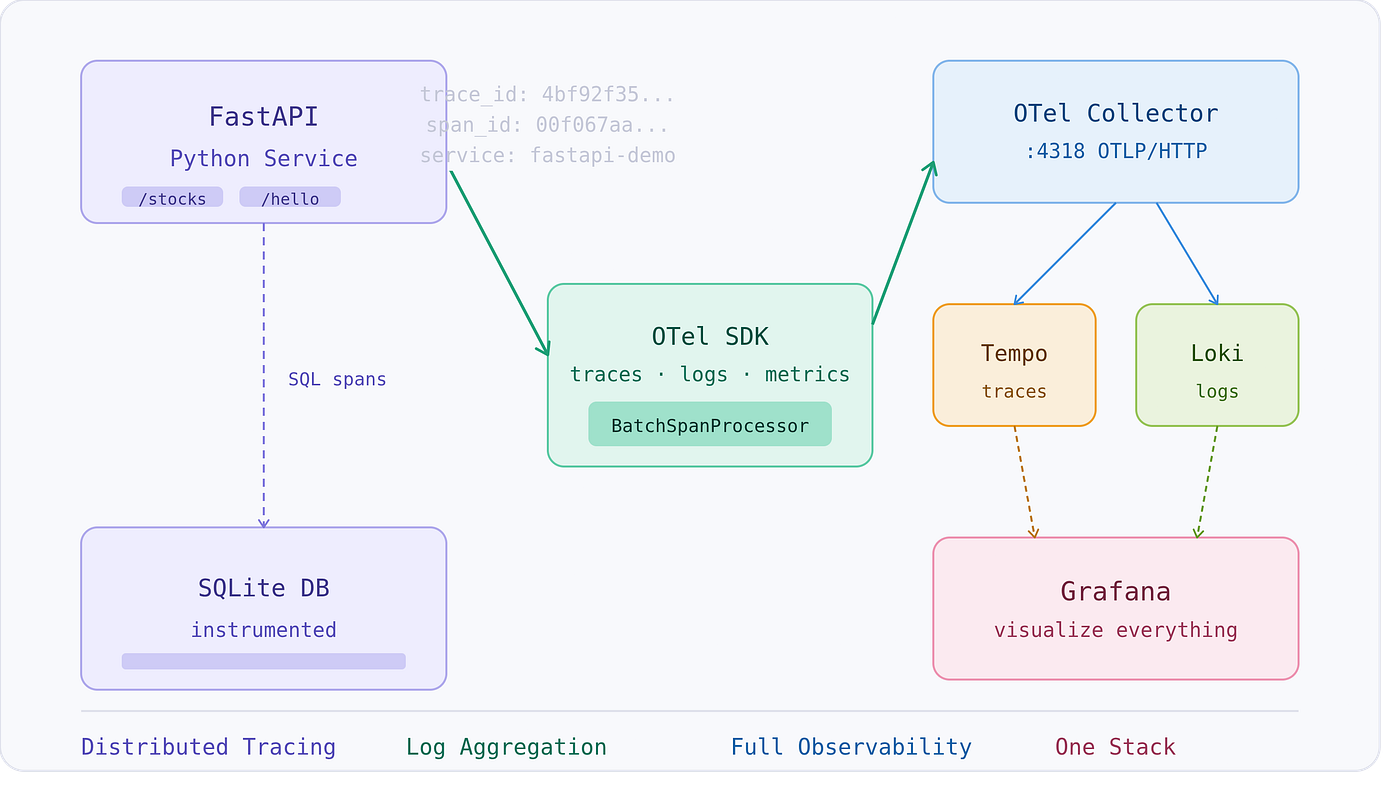
Implementation Architecture
How things work under the hood
- The OpenTelemetry Collector acts as a central receiver, listening for telemetry data (logs, traces, metrics) sent by OTEL exporters
- A request is received by the server through an API endpoint
- OTEL instrumentation intercepts the request as soon as it enters the service and checks whether tracing context already exists.
- If no trace context is present, the OTEL SDK generates a new trace_id for the request. If the request already carries trace headers, the existing trace_id is reused
- As the request flows through the application, the OTEL SDK creates child spans for granular operations such as : database queries, external API calls, background or async tasks
- Each span gets its own span_id while sharing the same trace_id, forming a complete trace tree
- Application logging continues as usual, but the OTEL Logging Handler enriches each log with the active trace_id and span_id
- The OTEL exporter standardizes logs and traces into OTLP format and pushes them to the collector in batches.
- The Collector processes and routes this data to backends like Tempo (traces) and Loki (logs).
- Finally, grafana visualizes the full request journey — from entry point to failure or success, across services.
What we can monitor with OTEL setup
- End-to-end request lifecycle
- All services a particular request has traversed
- What all database transactions were made during the request lifecycle
- The duration of every span across each DB transaction, external API call, and internal application processing
Step 1 : Create a folder named otel, and include the below files
otel/
├── __pycache__/
├── .gitignore
├── main.py
├── otel.py
├── db.py
├── Dockerfile
├── docker-compose.yaml
├── requirements.txt
├── otel-collector.yaml
├── tempo.yaml
└── venv/
Step 2 : Add the below files (can skip step 2 if you choose to fork the repo directly)
otel.py — consists of otel setup, get’s activated when imported in main.py
import logging
from opentelemetry.sdk._logs import LoggerProvider, LoggingHandler
from opentelemetry.sdk._logs.export import BatchLogRecordProcessor
from opentelemetry.exporter.otlp.proto.http._log_exporter import OTLPLogExporter
from opentelemetry.sdk.resources import Resource
from opentelemetry._logs import set_logger_provider

# Resource
def get_resource():
  return Resource.create({
      "service.name": "fastapi-otel-demo"
  })

# Logger provider
logger_provider = LoggerProvider(resource=resource)

# Exporter -> Loki
logger_provider.add_log_record_processor(
    BatchLogRecordProcessor(
        OTLPLogExporter(endpoint="http://otel-collector:4318/v1/logs")
    )
)

# Set global provider
set_logger_provider(logger_provider)

handler = LoggingHandler(
    level=logging.INFO,
    logger_provider=logger_provider,
)

root_logger = logging.getLogger()
root_logger.addHandler(handler)
root_logger.setLevel(logging.INFO)

print("[SETUP] OTEL LOGGING INITIALIZED")
main.py — consists of demo API’s
import logging
from fastapi import FastAPI
import otel # init logging

from opentelemetry import trace
from opentelemetry.sdk.resources import Resource
from opentelemetry.sdk.trace import TracerProvider
from opentelemetry.sdk.trace.export import BatchSpanProcessor
from opentelemetry.exporter.otlp.proto.http.trace_exporter import OTLPSpanExporter
from opentelemetry.instrumentation.fastapi import FastAPIInstrumentor
from opentelemetry.instrumentation.sqlite3 import SQLite3Instrumentor

from db import init_db, get_conn
from pydantic import BaseModel

app = FastAPI()
logger = logging.getLogger(__name__)

@app.on_event("startup")
def startup():
    print("[SETUP] INITIALIZING DATABASE...")
    init_db()
    print("[SETUP] DATABASE INITIALIZED")

# Tracer provider
trace.set_tracer_provider(TracerProvider(resource=otel.get_resource()))
trace.get_tracer_provider().add_span_processor(
    BatchSpanProcessor(
        OTLPSpanExporter(endpoint="http://otel-collector:4318/v1/traces")
    )
)

# Instrument FastAPI
FastAPIInstrumentor.instrument_app(app)

# Instrument SQLite3
SQLite3Instrumentor().instrument()

@app.get("/hello")
def hello():
    logger.info("hello api called", extra={"user": "hardik"})
    return {"msg": "hello"}

class StockIn(BaseModel):
    name: str
    price: float

@app.post("/stocks")
def create_stock(stock: StockIn):
    conn = get_conn()
    cur = conn.cursor()
    cur.execute(
        "INSERT INTO stocks (name, price) VALUES (?, ?)",
        (stock.name, stock.price)
    )
    conn.commit()
    logger.info(f"inserted {stock.name} to DB")
    stock_id = cur.lastrowid
    conn.close()
    return {"id": stock_id, **stock.dict()}

@app.get("/stocks")
def get_stocks():
    conn = get_conn()
    rows = conn.execute("SELECT id, name, price FROM stocks").fetchall()
    conn.close()
    return [
        {"id": r[0], "name": r[1], "price": r[2]}
        for r in rows
    ]
db.py
import sqlite3

DB_NAME = "stocks.db"

def get_conn():
    return sqlite3.connect(DB_NAME, check_same_thread=False)

def init_db():
    conn = get_conn()
    conn.execute("""
        CREATE TABLE IF NOT EXISTS stocks (
            id INTEGER PRIMARY KEY AUTOINCREMENT,
            name TEXT NOT NULL,
            price REAL NOT NULL
        )
    """)
    conn.commit()
    conn.close()
otel-collector.yaml — consists of configuration used while setting up otel collector (overrides default collector config)
receivers:
  otlp:
    protocols:
      http:
        endpoint: 0.0.0.0:4318

exporters:
  otlphttp/loki:
    endpoint: http://loki:3100/otlp
    tls:
      insecure: true

  otlphttp/tempo:
    endpoint: http://tempo:4318
    tls:
      insecure: true

service:
  pipelines:
    logs:
      receivers: [otlp]
      exporters: [otlphttp/loki]

    traces:
      receivers: [otlp]
      exporters: [otlphttp/tempo]
temp.yaml — consists of tempo configuration
server:
  http_listen_port: 3200

distributor:
  receivers:
    otlp:
      protocols:
        http:
          endpoint: 0.0.0.0:4318
        grpc:
          endpoint: 0.0.0.0:4317

storage:
  trace:
    backend: local
    local:
      path: /tmp/tempo
Dockerfile
FROM python:3.12-slim
WORKDIR /app
RUN pip install --no-cache-dir uv
COPY requirements.txt .
RUN uv pip install --system -r requirements.txt
COPY . .
EXPOSE 8001
CMD ["uvicorn", "main:app", "--host", "0.0.0.0", "--port", "8001"]
docker-compose.yaml — single orchestration command to manage containers
networks:
  observability:
    name: observability

services:
  app:
    build: .
    container_name: fastapi-app
    command: uvicorn main:app --host 0.0.0.0 --port 8001
    ports:
      - "8001:8001"
    depends_on:
      - otel-collector
    environment:
      OTEL_EXPORTER_OTLP_ENDPOINT: http://otel-collector:4318
    networks:
      - observability

  loki:
    image: grafana/loki:3.1.1
    container_name: loki
    ports:
      - "3100:3100"
    command: -config.file=/etc/loki/local-config.yaml
    networks:
      - observability

  grafana:
    image: grafana/grafana:latest
    container_name: grafana
    ports:
      - "3000:3000"
    networks:
      - observability

  otel-collector:
    image: otel/opentelemetry-collector-contrib:latest
    container_name: otel-collector
    command: ["--config=/etc/otel/collector.yaml"]
    volumes:
      - ./otel-collector.yaml:/etc/otel/collector.yaml
    ports:
      - "8888:8888"   # metrics (debug)
    depends_on:
      - loki
    networks:
      - observability

  tempo:
    image: grafana/tempo:latest
    container_name: tempo
    command: ["-config.file=/etc/tempo/tempo.yaml"]
    volumes:
      - ./tempo.yaml:/etc/tempo/tempo.yaml
    ports:
      - "3200:3200"   # Tempo query
    networks:
      - observability
requirements.txt — consists of packages that have to be installed
annotated-doc==0.0.4
annotated-types==0.7.0
anyio==4.13.0
asgiref==3.11.1
certifi==2026.5.20
charset-normalizer==3.4.7
click==8.4.1
exceptiongroup==1.3.1
fastapi==0.136.3
googleapis-common-protos==1.75.0
grpcio==1.81.0
h11==0.16.0
idna==3.18
opentelemetry-api==1.42.1
opentelemetry-exporter-otlp==1.42.1
opentelemetry-exporter-otlp-proto-common==1.42.1
opentelemetry-exporter-otlp-proto-grpc==1.42.1
opentelemetry-exporter-otlp-proto-http==1.42.1
opentelemetry-instrumentation==0.63b1
opentelemetry-instrumentation-asgi==0.63b1
opentelemetry-instrumentation-dbapi==0.63b1
opentelemetry-instrumentation-fastapi==0.63b1
opentelemetry-instrumentation-sqlite3==0.63b1
opentelemetry-proto==1.42.1
opentelemetry-sdk==1.42.1
opentelemetry-semantic-conventions==0.63b1
opentelemetry-util-http==0.63b1
packaging==26.2
protobuf==6.33.6
pydantic==2.13.4
pydantic-core==2.46.4
requests==2.34.2
starlette==1.2.1
typing-extensions==4.15.0
typing-inspection==0.4.2
urllib3==2.7.0
uvicorn==0.49.0
wrapt==2.2.1
Step 3 : Boot all the containers
# Boot up all containers
docker compose up --build -d
# Confirm container status
docker ps
Step 4 : Open grafana dashboard
When prompted for username / password use
username : admin
password : admin
Adding new datasource connection
LOKI : Go to Connection -> Data sources, search for loki and enter URL : **http://loki:3100** (loki : name of the container, 3100 : port where loki is running and accepting events)

TEMPO : Repeat the same process for tempo, and use URL : http://tempo:3200 (tempo : name of the container, 3200 : port where tempo is running and accepting events)
Step 5 : Hit different cURL’s to push logs + traces
# Log
curl --location 'http://localhost:8001/hello'

# Create DB record
curl --location 'http://localhost:8001/stocks' \
--header 'Content-Type: application/json' \
--data '{
    "name": "SpaceX",
    "price": 160
}'

# Read DB records
curl --location 'http://localhost:8001/stocks' \
--data ''
Step 6 : Checking out the logs in Loki
- Open Explore section and choose Data source -> Loki.
- Enter below service name
{service_name="fastapi-otel-demo"}- Click -> Run query.

We can see 2 logs that appear in Loki, now expand the first log for viewing the details

The trace_id is the most important thing here, using which you can check the full lifecycle of this particular request. Copy the trace_id to view span details in tempo.
Step 7 : Checking out the traces in Tempo
- In Explore section, now choose Data source -> Tempo
- Enter the trace_id as shown below
- Click shift + enter

We are able to see all the spans connected to this trace_id. Open the INSERT span to view more details

The span literally shows query executed, and the time it has taken (duration).
This setup demonstrates a single application exporting API calls, database transactions, and the full request lifecycle. That’s manageable at a small scale.
Now imagine a real production system with 80–100 microservices, where a single request hops across multiple services. Manually tracing what happened — who responded, where latency was added, or where things failed — is practically impossible with logs alone.
This is where OpenTelemetry (OTEL) shines. It’s an industry-standard solution designed to trace every request end-to-end, across services, databases, and external calls. Instead of guessing, you get a clear, connected picture of what happened, where it happened, and why.
I highly recommend forking the repo and experimenting:
- Add more services
- Introduce client-side or custom spans
- Trigger failures and latency intentionally and watch how the entire request/response lifecycle comes together in traces.
Observability is a deep ocean — and that’s what makes it fun to explore.
If you run into issues while setting things up, feel free to reach out or drop a comment below.
Happy logging 🚀
메타데이터
- post_id
- 56d82fc9e93a
- slug
- part-2-stop-flying-blind-instrument-your-fastapi-app-using-opentelemetry-implementation-56d82fc9e93a
- url
- https://medium.com/@hardikambati69/part-2-stop-flying-blind-instrument-your-fastapi-app-using-opentelemetry-implementation-56d82fc9e93a
- canonical_url
- https://medium.com/@hardikambati69/part-2-stop-flying-blind-instrument-your-fastapi-app-using-opentelemetry-implementation-56d82fc9e93a
- author_url
- https://medium.com/@hardikambati69
- status
- ok
- fetched_at
- 2026-06-27 07:40:21