Mastering OpenTelemetry: Integrating WSO2 API Manager 4.5.0 with Dynatrace
In modern distributed architectures, APIs are the central nervous system of your business. But when things go wrong — or when you simply…
Mastering OpenTelemetry: Integrating WSO2 API Manager 4.5.0 with Dynatrace
In modern distributed architectures, APIs are the central nervous system of your business. But when things go wrong — or when you simply need to understand the performance bottlenecks of your microservices — you need a way to track requests from the edge all the way down to the database. This is where OpenTelemetry (OTel) and robust observability backends like Dynatrace come into play.
Starting from version 4.2.0, WSO2 API Manager introduced native support for OpenTelemetry (OTLP), eliminating the need for custom, drop-in tracers.
In this post, we’ll walk through the complete setup of configuring WSO2 API Manager 4.5.0 to send traces to Dynatrace using the OpenTelemetry Collector. We’ll also cover a common challenge you might encounter — default “Internal” span kinds — and how to fix it using the OpenTelemetry Transformation Language (OTTL).
Step 1: Prepare Dynatrace
Before configuring your gateway, you need a destination for your traces. Dynatrace natively ingests OTLP data, making this process highly streamlined.
- Sign up for a free trial of Dynatrace (if you don’t already have an environment). URL — https://www.dynatrace.com/signup/
- Generate an Access Token: Navigate to the Dynatrace Access Tokens app within your tenant. Create a new token and ensure it has the Ingest OpenTelemetry traces (
openTelemetryTrace.ingest) scope enabled. - Note down your SaaS environment URL (e.g.,
[https://{your-environment-id}.live.dynatrace.com).](https://{your-environment-id}.live.dynatrace.com).) You can get the environment-id from the URL after logging into the dynatrace environment.
Step 2: Deploy the OpenTelemetry Collector
While WSO2 can export OTLP data, it uses gRPC by default. Dynatrace’s native ingestion endpoint expects HTTP/protobuf. To bridge this gap — and to add powerful batching and processing capabilities — we use the standard OpenTelemetry Collector.
Deploy the OTel Collector using Docker with the following otel-collector-config.yaml :
receivers:
  otlp:
    protocols:
      grpc:
        endpoint: 0.0.0.0:4317

processors:
  batch:
    timeout: 1s
    send_batch_size: 1024

exporters:
  otlphttp/dynatrace:
    endpoint: "https://{environment-id}.live.dynatrace.com/api/v2/otlp"
    headers:
      Authorization: "Api-Token <valid-token>"

service:
  pipelines:
    traces:
      receivers: [otlp]
      processors: [transform/span_kind, batch]
      exporters: [otlphttp/dynatrace]
(Note: We use otlp_http as the exporter type, which is the modern standard over the deprecated otlphttp alias)
Run the below commad to spin up the instance of OTel collector:
docker run -d \
  --name otel-collector \
  -p 4317:4317 \
  -v $(pwd)/otel-collector-config.yaml:/etc/otelcol-contrib/config.yaml \
  otel/opentelemetry-collector-contrib:latest
Step 3: Configure WSO2 API Manager 4.5.0
With the collector running and listening on port 4317, we simply need to point our WSO2 API Gateway to it.
Open your <WSO2_HOME>/repository/conf/deployment.toml file and append the following configuration:
[apim.open_telemetry]
remote_tracer.enable = true
remote_tracer.name = "otlp"
remote_tracer.url = "http://localhost:4317"

[[apim.open_telemetry.resource_attributes]]
name = "service.name"
value = "WSO2-API-Gateway"

[[apim.open_telemetry.resource_attributes]]
name = "deployment.environment"
value = "Production"
Restart WSO2 API Manager, invoke a few APIs, and navigate to the Dynatrace Distributed Tracing dashboard. You should see your traces flowing in!

The Challenge: The “Internal” Span Trap
If you stop at Step 3, you will notice a glaring issue in the Dynatrace dashboard. Following successful invocations, all traces grouped under WSO2 show up with the Span Kind labeled as “Internal”.
By default, WSO2 tags its internal mediation steps and message processors as Internal spans. However, Dynatrace relies on Server spans (incoming requests) and Client spans (outgoing requests to backends) to accurately map your topology and calculate Service-Level Indicators (SLIs). If everything is Internal, Dynatrace cannot stitch the distributed trace together properly.
The Solution: Enter OTTL and the Transform Processor
To solve this, we don’t need to rewrite any WSO2 code. Instead, we can leverage the Transform Processor in our OTel Collector. Using the OpenTelemetry Transformation Language (OTTL), we can intercept the traces on the fly and intelligently rewrite the span kinds based on regex matching.
Here is the updated OTel Collector configuration that fixes the issue:
receivers:
  otlp:
    protocols:
      grpc:
        endpoint: 0.0.0.0:4317

processors:
  batch:
    timeout: 1s
    send_batch_size: 1024

  # Manipulate the spans on the fly
  transform/span_kind:
    error_mode: ignore
    trace_statements:
      - context: span
        statements:
          # 1. Change specific API entry points to SERVER spans (Span Kind 2)
          - set(kind, 2) where kind == 1 and IsMatch(name, "^PizzaShack.*")

          # 2. Change HTTP resource invocations to SERVER spans
          - set(kind, 2) where kind == 1 and IsMatch(name, "^(GET|POST|PUT|DELETE|PATCH|OPTIONS)--.*")

          # 3. Change outbound backend calls to CLIENT spans (Span Kind 3)
          - set(kind, 3) where kind == 1 and IsMatch(name, ".*Endpoint.*")

exporters:
  otlp_http/dynatrace:
    endpoint: "https://{your-environment-id}.live.dynatrace.com/api/v2/otlp"
    headers:
      Authorization: "Api-Token <valid-token>"

service:
  pipelines:
    traces:
      receivers: [otlp]
      # Add the transform processor BEFORE the batch processor
      processors: [transform/span_kind, batch]
      exporters: [otlp_http/dynatrace]
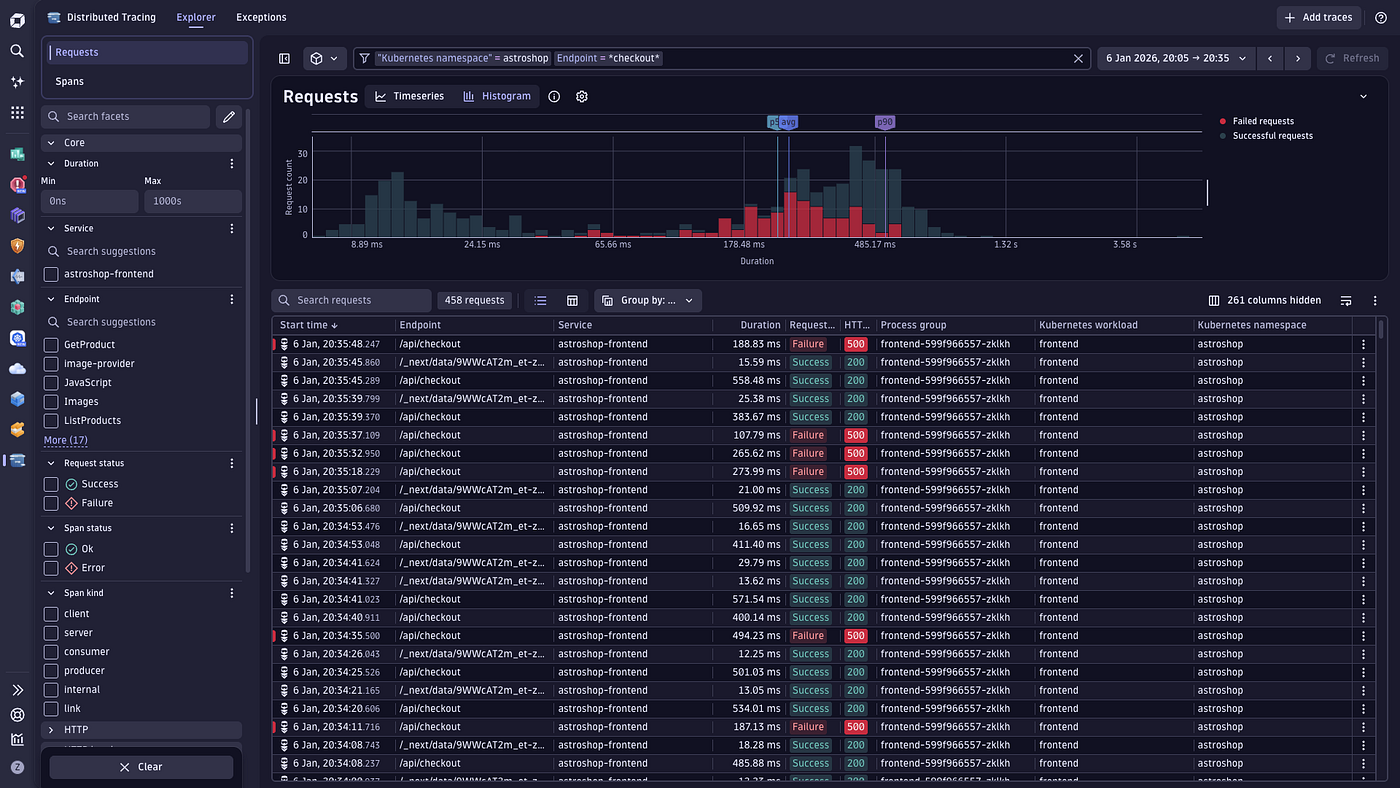
Deploy a new instance of the OTel collector using the above configuration and invoke few APIs to see the traces in dynatrace with different kinds of spans as shown in the screenshot below.

Why this works:
In the OTLP specification, span kinds are represented as integers (1 for Internal, 2 for Server, 3 for Client). Using the IsMatch OTTL function, we look at the dynamic name of the span WSO2 generated (e.g., GET--/menu or PizzaShackAPI). If it matches an entry point, we use set(kind, 2) to promote it to a Server span. If it matches an outbound call to a backend (.*Endpoint.*), we promote it to a Client span.
Conclusion
By combining WSO2 API Manager’s native OpenTelemetry support with an OTel Collector, you create a highly performant, vendor-neutral observability pipeline. Furthermore, by tapping into the power of the Transform Processor and OTTL, you retain total control over your telemetry data, ensuring that robust backends like Dynatrace can ingest, map, and analyze your API traffic flawlessly.
Have you implemented OpenTelemetry in your WSO2 environments? Let me know your thoughts and architecture patterns in the comments!
메타데이터
- post_id
- 570e0cba2e92
- slug
- mastering-opentelemetry-integrating-wso2-api-manager-4-5-0-with-dynatrace-570e0cba2e92
- url
- https://medium.com/@chethanbs21/mastering-opentelemetry-integrating-wso2-api-manager-4-5-0-with-dynatrace-570e0cba2e92
- canonical_url
- https://medium.com/@chethanbs21/mastering-opentelemetry-integrating-wso2-api-manager-4-5-0-with-dynatrace-570e0cba2e92
- author_url
- https://medium.com/@chethanbs21
- status
- ok
- fetched_at
- 2026-06-20 20:29:01