A Novel Approach to Player Rankings in European Football
Transforming Performance Metrics: A Deep Dive into Multi-Dimensional Analysis of Football Players
A Novel Approach to Player Rankings in European Football
Transforming Performance Metrics: A Deep Dive into Multi-Dimensional Analysis of Football Players
Originally published at https://thexgfootballclub.substack.com.
Football, the world’s largest sports industry, often struggles with the inherent complexity of evaluating player performance across different competitions, positions, and roles. Traditionally, metrics like goals, assists, and clean sheets have been used to evaluate players, but these are insufficient for many roles, particularly in defense. A recent paper titled “A Dimension Reduction Approach to Player Rankings in European Football” by Ayse Elvan Aydemir and colleagues introduces a novel framework aimed at a fairer evaluation of player performance, addressing the multi-dimensional nature of player contributions in football. This article provides an in-depth review of the paper, summarizing its key methodologies, analyses, and implications for football analytics.
I. Introduction
The paper presents a global framework to evaluate football players in an unsupervised manner, focusing particularly on players in left and right-back positions. Unlike traditional evaluations that rely on isolated in-game statistics, this framework seeks to integrate external factors like team dynamics, competition quality, and opponent strength, which all significantly impact a player’s contribution on the field. By utilizing advanced statistical methodologies, the authors aim to create a more balanced and contextual player ranking system applicable not only to football but also to other global team sports.
The authors argue that, given the subjective nature of current metrics and the absence of a universally accepted ranking system, an unsupervised and adaptable ranking mechanism is essential for assessing players’ true value. By employing a combination of scaling methods, exponential decay for performance recency, and Kernel Principal Component Analysis (PCA), this framework attempts to provide a holistic evaluation of players across multiple competitions and timeframes.
II. Literature Review
The literature review in the paper situates this work in the context of modern developments in sports analytics. Early methodologies, such as those popularized by the “Moneyball” approach, emphasized maximizing returns on player investment through rigorous data analysis. Although football lagged behind baseball and basketball in adopting data analytics, the recent influx of data has encouraged more sophisticated approaches to evaluating performance.
Aydemir et al. draw upon a broad range of existing studies and illustrate how most prior approaches either constrain the region of analysis or use limited dimensions in player metrics. Existing ranking methods often focus on one-off competitions or specific leagues, lacking a scalable methodology for comparison across different playing conditions. Unlike previous supervised models that rely on labeled datasets or rankings based on narrowly defined metrics, this new framework positions itself as a generalized method for ranking players across multiple competitions and roles.
III. Methodology
Aligning Player Statistics
The authors propose a comprehensive multi-step methodology to address the inconsistencies in existing player evaluations. One of the most critical steps is aligning player statistics to make them comparable across leagues and competitions. This process accounts for factors such as gameplay duration, game difficulty, and competition quality.
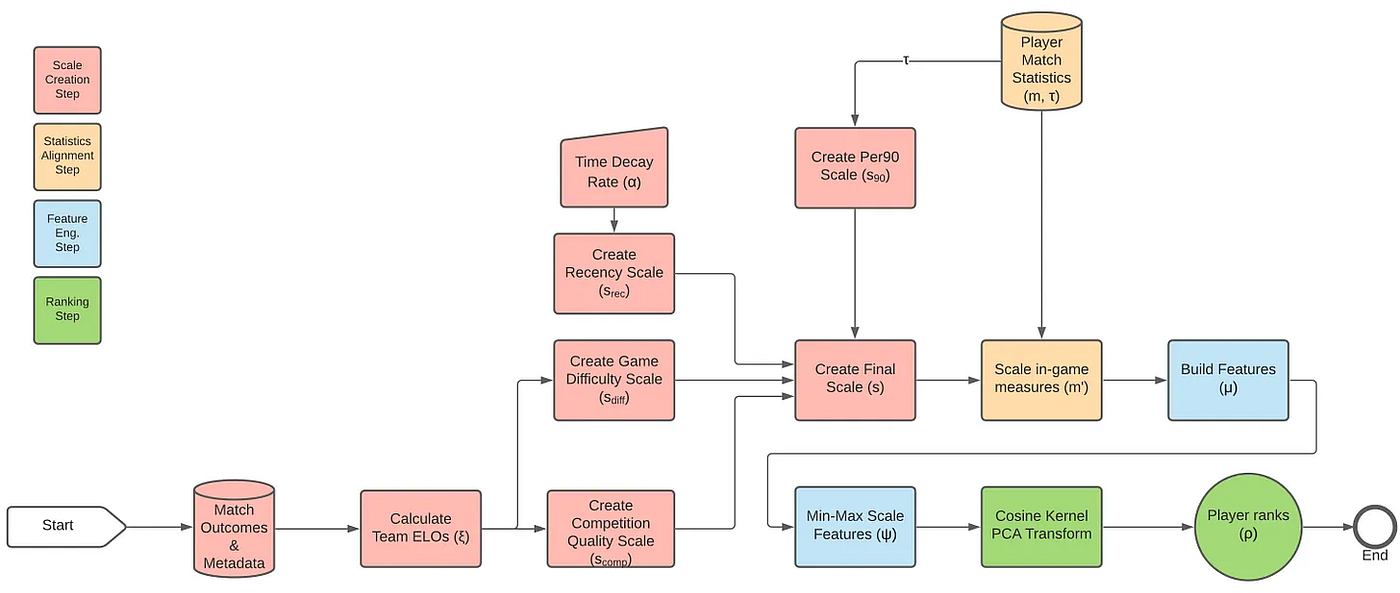
“FIGURE 1. Process diagram of methodology.”
The paper uses logarithmic per 90-minute scaling to adjust player statistics, ensuring comparability despite differences in playing time. This is especially useful for scaling data between players who have vastly different game-time opportunities, giving a fair representation of their contributions. The authors also propose a game difficulty scaling based on the well-established ELO rating system, typically used in chess. By adapting ELO for team games, the authors adjust player statistics to account for the quality of opponents and overall competition difficulty. This scaling technique helps in providing a level playing field for assessing player performance.

“FIGURE 2. UEFA coefficients vs. player market values.”
In addition, competition quality scaling is used to distinguish between the levels of different football leagues. Since different competitions have varying degrees of quality, this scaling boosts statistics obtained in higher-rated competitions to accurately reflect the level of gameplay. Recency scaling is another crucial component of the methodology, ensuring that recent performance metrics are given higher weight than older data, thus maintaining the relevance of the ranking.
Aggregating Player Statistics
After aligning the raw in-game statistics, the paper proceeds to aggregate them into player-level metrics. Three different aggregation techniques are used: scaled averages, scaled ratios, and strength variables. These metrics represent player performance across different analysis dimensions, providing insights into both activity levels and success rates. The strength variable introduced here is particularly notable, as it extends the concept of success ratios by incorporating the impact of sample size, making it a more reliable indicator of a player’s overall quality.
Ranking Players with Dimension Reduction
Once player metrics have been aggregated, the next step involves combining these features into a single ranking score. For this purpose, the authors use Kernel Principal Component Analysis (PCA) with a cosine similarity kernel. Traditional PCA techniques are typically unsuitable for ranking players due to the orthogonality constraints, which do not align well with the real-life interdependencies of player attributes. By opting for Kernel PCA, the authors effectively bypass these constraints, enabling the representation of player rankings in a more meaningful one-dimensional space.
The authors further argue that traditional ranking techniques often fall short in dealing with the complexity of multi-dimensional player attributes. By employing Kernel PCA, they are able to uncover the latent relationships between player attributes, providing a holistic view of a player’s performance. This unsupervised learning approach is particularly powerful as it does not require labeled datasets-a major limitation in traditional ranking methodologies.
IV. Experimental Setup
The paper uses data from 72 competitions over two seasons (2016/2017 and 2017/2018), encompassing over 3,600 players and nearly 2 million in-game statistics. Only players who played at least 20 games, with a minimum of 90% of their game-time spent as left or right backs, were considered. The experimental setup also included publicly available data, such as team ELO ratings and transfer values from Transfermarkt.

“TABLE 3. Parameter details.”
The experimental configuration was designed to demonstrate the efficacy of the methodology across different player roles and competition levels. The parameters used for game difficulty, recency scaling, and other factors were optimized based on best practices in related literature, ensuring that the proposed ranking system was robust and scalable. The experiments were run using both real and synthetic benchmarks, comparing the model’s output against established ranking systems like CPP and COMET.

TABLE 4. Analysis dimensions.
V. Results
Financial Validation
One of the unique aspects of the paper is the validation of its rankings using financial metrics, specifically player market values before and after the analysis period. The authors show that players ranked highly by the proposed model experienced an increase in market value significantly above inflation rates, suggesting that the model is effective at identifying talent with substantial financial potential.

“FIGURE 3. Cumulative return on investment per age group and rank.”
For validation purposes, players were grouped into deciles, and their cumulative market value changes were compared across ranking groups. On Figute 3 cumulative return on investment per age group and rank illustrates that top-ranked players experienced significant value growth. Notably, the paper reports that investing in younger, highly-ranked players yields the highest financial return, with diminishing returns as player age increases.

“FIGURE 4. Player market value distribution per rank group and analysis period.”
Team Fit Validation
The authors further validate the player rankings by analyzing the correlation between a player’s rank and the ELO rating of the team they transferred to post-analysis. A statistically significant correlation was found between the two, suggesting that players rated highly by this model tend to move to stronger teams, highlighting the robustness of the ranking system.

“FIGURE 5. Relationship between ranks and post-analysis destination team ratings.”
The team-fit analysis also employs Spearman rank correlation to assess the alignment between player performance and team quality. The analysis confirms that the ranking system is not only able to identify top-performing players but also those who are suitable for competitive team environments, providing clubs with a reliable tool for talent acquisition.
Player Ranking Evaluation Using Information Retrieval Metrics
This section describes the challenge of evaluating player rankings when no ground-truth data is available. In such scenarios, traditional methods of validation, such as feedback-based adjustments or direct comparison to true rankings, are not possible. To tackle this, the paper applies evaluation metrics commonly used in information retrieval problems, similar to those used for ranking search results without user feedback.
To evaluate the effectiveness of the player rankings, several information retrieval metrics were used:
- Kendall’s τ: Measures the overall agreement between two ranked lists. It serves as a benchmark for understanding how well two ranking outputs correlate with each other.
- Average Precision: Calculates performance at different intervals in the rankings and averages them. It is more focused on the accuracy of rankings for the top-ranked players, which makes it particularly valuable when the highest performers are of greater importance.
- Normalized Discounted Cumulative Gain (NDCG): Quantifies the gain obtained by the ranking system by correctly ordering items. This metric gives higher relevance to correctly ranking items at the top of the list.
- WS Coefficient: This metric emphasizes the importance of correctly ranking top items and requires user input on the importance of ranking observations. Unlike NDCG, it provides a more well-rounded evaluation of rankings by placing more weight on the highest-ranked players.
Importance of Ranking High Performers
In information retrieval problems, correctly ranking the highest performers is usually more important than getting the lowest performers right. Metrics like Average Precision and WS Coefficient are designed to reflect this by placing greater emphasis on the top-ranking items. If a ranking system’s error is distributed randomly, Average Precision and Kendall’s τ would provide similar results. However, if a system ranks the top items more accurately, the Average Precision value will be higher than that of Kendall’s τ. The WS Coefficient, like Average Precision, also gives more weight to top-ranked items.
Results and Observations
The study provides results for the proposed ranking methodology using these metrics (shown in Table 9). All metrics demonstrated a positive correlation between the rankings generated by the proposed methodology and subsequent player values, confirming the validity of the model. Metrics that prioritize order (such as Average Precision and WS Coefficient) had higher values compared to Kendall’s τ, indicating that the methodology is particularly effective at identifying and ranking top-valued players.

“TABLE 9. The results of the proposed solution using information retrieval metrics.”
However, the study acknowledges that using player value as a baseline has limitations because these values can be influenced by several external factors, such as player age.
Comparison with COMET Methodology
The authors also compared their proposed methodology with the COMET model, which groups features into preference buckets rather than outputting individual player rankings. The proposed methodology outperformed COMET, even when COMET was applied to scaled and aggregated data. The difference in performance was attributed to COMET’s inability to account for complex relationships between player attributes, which the proposed method successfully addresses by incorporating detailed scaling and aggregation.
Discussion on Average Precision and WS Coefficient
The authors noted a significant difference between the Average Precision and WS Coefficient values, hypothesizing that this could be due to the large sample size in their ranking study. Although the difference was observed, a more detailed comparison between these metrics was beyond the scope of the current study. More analysis is suggested to better understand how these metrics perform under different ranking scenarios.
Real-World Results
The final configuration of the methodology produced rankings for 3,681 players, with the top 20 players listed in Table 10. This table provides details on each player’s team, age at the beginning and end of the analysis period, and market values obtained from Transfermarkt before and after the analysis.

“TABLE 10. Top 20 Players and Their Metadata.”
Fourteen of the top 20 players increased their market value by the end of the analysis period. However, some players saw a decline, which was mostly attributed to factors like injuries or age. For example, Luke Shaw’s market value decreased after the analysis due to injuries that kept him sidelined for a significant part of the season. The decline in value for older players is consistent with general market trends, as shown in Figure 3.
Figure 6 illustrates that almost all top-ranking players under the age of 25 saw an increase in their market values following the analysis, which reinforces the model’s effectiveness in identifying talent with growth potential.

“FIGURE 6. Market value changes through time.”
To make the methodology accessible to others, the authors provided a public API and a dashboard interface for testing different configurations using publicly available data. This allows researchers and practitioners to experiment with the methodology and use it for their own analyses.
VI. Discussion
Broad Scope of Player Evaluation
The authors analyzed more than 3,500 players across different competitions, showcasing the proposed methodology’s capability to identify players likely to increase their market value. Unlike existing literature, which typically restricts analysis to a smaller player subset, this framework was designed to operate on a much larger scale, demonstrating significant improvement in performance and scalability compared to prior methods.
Correlation with Financial Value
The analysis showed that high-rated players tend to experience a statistically significant increase in their market value, beyond inflation. This implies that teams investing in highly rated players are more likely to see financial returns. Additionally, highly rated players tend to move to more prestigious teams, indicating that the model effectively captures valuable player characteristics. The results also highlighted that the methodology outperforms existing approaches, particularly in identifying players in the top-ranked groups.
Complexities in Mid-Rank Groups
The lack of statistical significance in mid-rank groups (4–7) reflects the complexity of player evaluation. Factors such as player popularity, coach preferences, inflation, and even a player’s nationality can affect transfer values, as suggested in Figures 3 and 6. To enhance accuracy, additional contextual information could be integrated into the methodology to better capture the nuances of the transfer market.
Influence of Age and Contextual Factors
The study notes the importance of age as a contextual factor. For instance, young players may initially move to lower-ranked teams due to transfer restrictions, impacting their destination ratings. Teams often loan younger players to gain experience, which affects both player and team evaluations.
Market Value Dynamics and Investment Strategy
Table 7 shows that player values generally increased across rank groups, largely due to market inflation. However, the percentage change was more substantial for higher-ranked players, indicating that the ranking system effectively captures non-inflationary factors contributing to market value.

“TABLE 7. Market value change percentages by group.”
An interesting pattern emerged regarding age and player valuation. Figure 6 demonstrates that top-ranked players under 25 almost universally saw an increase in market value, irrespective of transfers. This suggests that when combined with demographic filters, the proposed methodology could help teams optimize their transfer decisions.
Investment Cut-Off Points by Age Group
The cumulative gain on market values, shown in Figure 3, provides insights for investment strategies. After a certain performance level (approximately the 25th percentile), the return on investment diminishes, which varies by age group. For younger players (under 21), the cut-off is around the 1,000th rank, while for players below 24, it decreases to around the 800th rank, and for players younger than 28, it further drops to around the 500th rank. This suggests that investing in a top-1,000 ranked player under 21 may yield financial returns, but similar investments in older players may not be as beneficial.
The data also shows two “elbow points” for younger age groups, indicating that competitions with lower average player value, such as second or third divisions, may produce young superstars who eventually yield high returns, even if they are initially ranked low. Achraf Hakimi’s move from Real Madrid Castilla to Inter in 2020 exemplifies this phenomenon.
High-Ranked Players and Market Performance
Figures 3, 4, and Table 6 all indicate that highly ranked players perform well financially. This relationship holds true even when using purely performance-based evaluations, as shown in Figure 5. However, it is essential to acknowledge that market values are an imperfect reflection of player performance, influenced by other factors such as demographics and market dynamics.

“TABLE 6. Two-Sample Kolmogorov-Smirnov Test P-Values.”
VII. Conclusion & Future Work
Framework Overview and Expansion Potential
The authors present a comprehensive framework for evaluating player performance across multiple dimensions on a global scale. While it is impossible to encode every aspect of a complex game like football statistically, the proposed methodology is designed to be extendable across various contexts, including different competitions, timeframes, and opponent types.
Future Directions
The authors plan to extend the methodology to identify specific gaps in team performance and cross-reference these gaps with player recommendations through optimization techniques, moving beyond a general ranking system. They also intend to explore approaches from Complexity Economics to gain deeper insights into transfer market dynamics, potentially incorporating demographic factors like age to further customize player evaluations.
Originally published at https://thexgfootballclub.substack.com.
메타데이터
- post_id
- 5750b5e7cd9a
- slug
- a-novel-approach-to-player-rankings-in-european-football-5750b5e7cd9a
- url
- https://medium.com/@marin11amf11/a-novel-approach-to-player-rankings-in-european-football-5750b5e7cd9a
- canonical_url
- https://medium.com/@marin11amf11/a-novel-approach-to-player-rankings-in-european-football-5750b5e7cd9a
- author_url
- https://medium.com/@marin11amf11
- status
- ok
- fetched_at
- 2026-06-11 05:11:55




