Why We Wait: A Simple Guide to the M/M/1 Queuing Model
Have you ever stood in a long line at a grocery store or waited on hold for a customer service agent, wondering if there is a science…
Why We Wait: A Simple Guide to the M/M/1 Queuing Model

Have you ever stood in a long line at a grocery store or waited on hold for a customer service agent, wondering if there is a science behind the wait? There is. It is called Queuing Theory, and it helps businesses estimate how long you will wait and decide how many staff members they need.
One of the most fundamental models in this field is the M/M/1 Model. It might sound complex, but it is actually a simple way to predict how a single line works. Let’s break it down into plain English.
What Does “M/M/1” Mean?
The name M/M/1 is a code that describes the system’s three main parts:
- First “M” (Arrivals): This stands for “Memoryless” (or Markovian). It assumes that customers arrive randomly, but at a predictable average rate. We usually describe this using a Poisson Distribution.
- Second “M” (Service): This also stands for “Memoryless.” It assumes the time it takes to serve a customer varies but follows an average pattern, described by an Exponential Distribution.
- “1” (Server): This simply means there is only one person or machine serving the customers.
In short: Random Arrivals + Random Service Times + One Server = M/M/1.
The Key Variables
To calculate how busy a system is, we need two numbers:
- (Lambda): The arrival rate (e.g., 2 patients per hour).
- (Mu) : The service rate (e.g., the doctor can treat 3 patients per hour).
From these two numbers, we can calculate everything else.
The Magic Formulas
Here are the four “Magic Formulas” managers use to check if their system is working well. Note that we first calculate Rho, which is the utilization factor (how busy the server is).
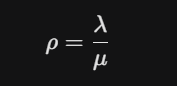
If rho is less than 1, the system is stable. If it is greater than or equal to 1, the line will grow forever!.
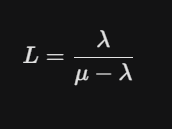
- Average number of customers in the system (L):
(This includes the person being served and those waiting)
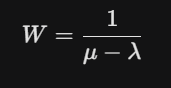
- Average time a customer spends in the system (W):
(Wait time + Service time)
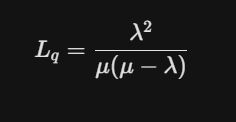
- Average number of customers waiting in line (L_q):
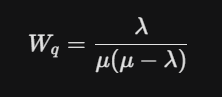
- Average time waiting in the line (W_q):
Real-World Example: The Hospital ER
Let’s look at a real scenario involving an Emergency Room (ER) to see these formulas in action.
The Scenario:
- Patients arrive at the ER randomly at a rate of lambda = 2$ patients per hour.
- A single doctor can treat patients at an average rate of mu = 3$ patients per hour.
The Questions:
- How busy is the doctor?
- How long will a patient wait in the lobby before seeing the doctor?
The Solution:
Step 1: Calculate Utilization
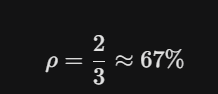
The doctor is busy 67% of the time. Since this is less than 100%, the system can handle the traffic15.
Step 2: Calculate Waiting Time in the Queue (W_q)
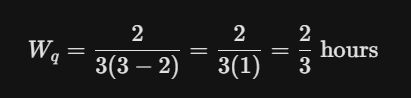
So, the average wait time is 40 minutes16.
Step 3: Calculate Total Time in the ER (W)
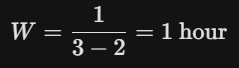
A patient spends about 1 hour total in the hospital (40 minutes waiting + 20 minutes with the doctor).
Test Your Knowledge: The University Help Desk
Now it’s your turn. Try to solve this problem derived from a university computer lab scenario.
The Problem
A university help desk has one server (student assistant).
- Arrivals (lambda): Students arrive at a rate of 15 per hour.
- Service (mu): The assistant can help 20 students per hour.
Calculate the following:
- What is the average utilization of the server ?
- What is the average number of students in the system (L)?
- What is the average number of students waiting in line (L_q)?
(Scroll down for the answers!)
…
…
…
The Answers
- Average Utilization :
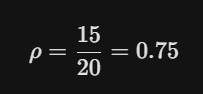
Answer: The server is busy 75% of the time20.
- Average Number of Students in the System (L):
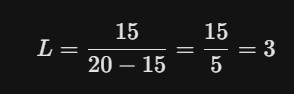
Answer: On average, there are 3 students in the area (waiting or being helped).
- Average Number of Students Waiting in Line (L_q):
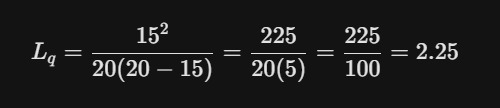
Answer: On average, 2.25 students are waiting in line.
Conclusion
The M/M/1 model is a powerful tool for managers. By knowing just the arrival rate and the service rate, you can predict if customers will be happy or frustrated. In our examples, we saw that even if the server is faster than the arrivals (like the doctor treating 3/hr vs 2/hr arriving), there is still a significant wait time. That is the paradox of queuing!
Second Part M/M/c with next Article
메타데이터
- post_id
- 575da2debc2d
- slug
- why-we-wait-a-simple-guide-to-the-m-m-1-queuing-model-575da2debc2d
- url
- https://medium.com/@kavindupraneeth8/why-we-wait-a-simple-guide-to-the-m-m-1-queuing-model-575da2debc2d
- canonical_url
- https://medium.com/@kavindupraneeth8/why-we-wait-a-simple-guide-to-the-m-m-1-queuing-model-575da2debc2d
- author_url
- https://medium.com/@kavindupraneeth8
- status
- ok
- fetched_at
- 2026-06-16 19:09:56