The 31% No One Talks About
A living reference on district staffing and the structural budget problem in Seattle Public Schools
The 31% No One Talks About
A living reference on district staffing and the structural budget problem in Seattle Public Schools
[Lastest Post: Cracking the Budget #1: Chronic Underspend. Finds 50M in the budget deficit that can be just erased without any impact since it is routinely never used]
TL;DR: The real structural deficit in the SPS budget isn’t about underutilized buildings — it’s about the $383 million (30.6%) budgeted to “District Office” staffing that’s gone largely unexamined for a decade. This post introduces the issue and outlines where we’re heading.
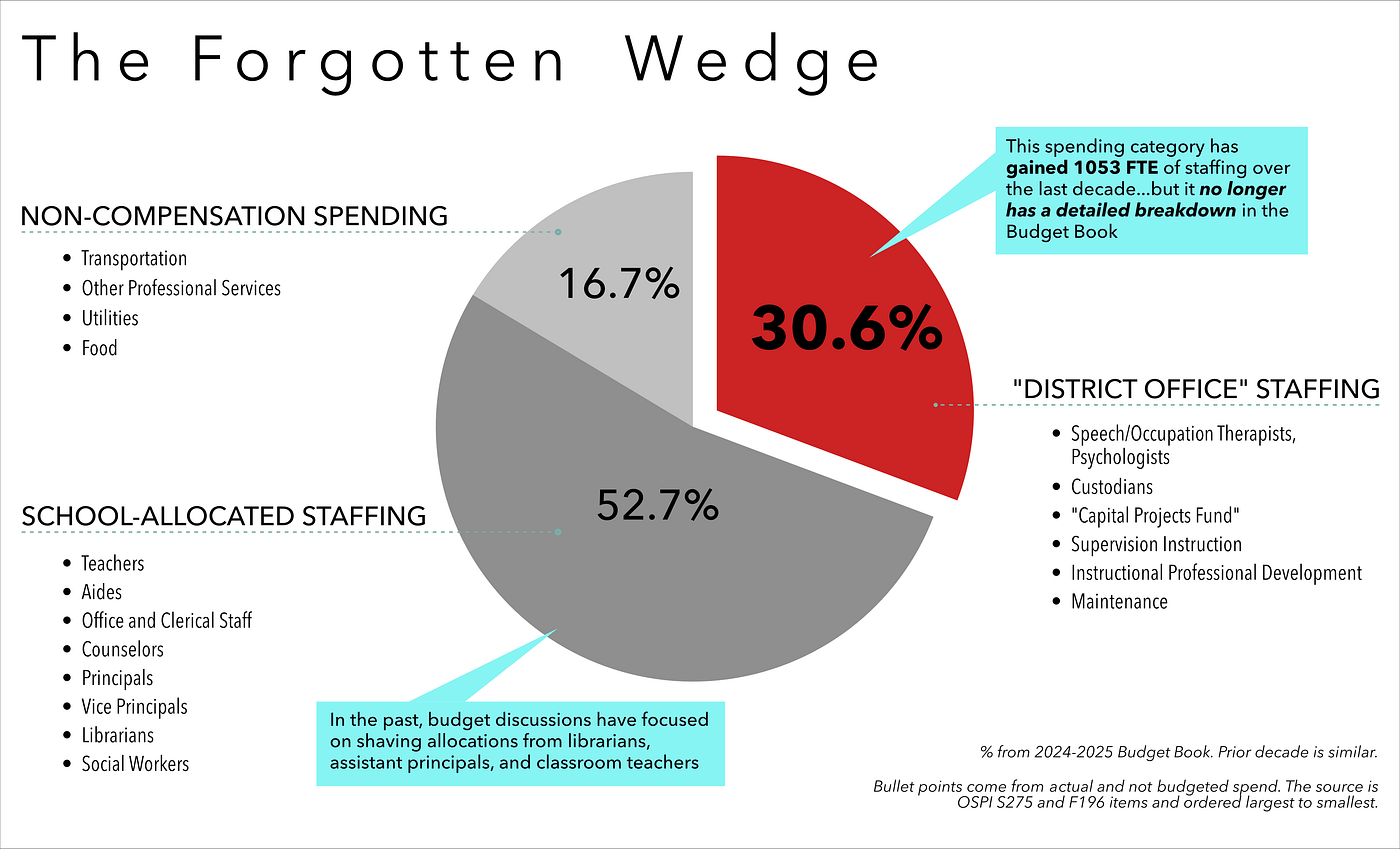
Pie-chart showing how much of the budget is allocated to staffing in the “District Office”
What can we take away from this?
That advocates, staff, and the board have focused on juggling staffing and spending in School Allocations while forgetting to ask hard questions about growth in the District Office is a collective failure. We’ve been looking at the wrong things, and that’s a major reason why we can’t make progress on equity or outcomes.
This is the first in a series of posts. By the end, we’ll zoom in on this 31%, draw a circle around odd growth areas, and (yes) share a list of staff names, transition paths into the positions, and salaries with the staff and board. Early findings are already with the Board and SPS staff.
The SPS Finance and HR departments could and should do this analysis more precisely. But we can help them by taking the first pass — using publicly available OSPI S275, F196, and F196 data.
Caveats and Terminology
- We define “District Office” as staffing not allocated to a specific school. This matches the official state reporting term. Older terms like “Central Office” or “JSCEE staff” or “Central Administration” refer to much smaller subsets and are misleading. Let’s retire them.
- This post focuses primarily on the budget, but keep in mind: SPS often underspends. In 2023–24, for example, compensation was underspent by $63M — over 5% of the entire budget. We will crack open this difference and how it matters in follow up posts.
Key Points
- The structural deficit is not in buildings — it’s in unchecked “District Office” staffing growth. Even though the percentage of budgeted dollars allocated to District Office has stayed around 30% for the last decade and looks stable, the % of total staffing assigned to the District Office has consistently grown. This is obscured by consistent underspending of the compensation budget; the extent of that underspend has shifted over time.
- There are 2600 Full-Time Equivalent (FTE) staff allocated to the District Office. It has grown from 27% to 36% of total staffing since 2013. This is worth $85M in budget dollars. Note though that if we examine the actual spend for filled positions reported to OSPI, this shows the shift may be closer to $40M which arises from a complicated mix of underspending and reporting differences. This will be explored in a later post.
- Compensation is 85% of the total budget. Any serious resource allocation discussion must focus on staffing, career paths, and talent development over a 5-year horizon. If it’s not in the Strategic Plan, the plan is not based in reality.
- We’ve spent a decade fighting the wrong battles — PTA staff funding, school closures, HCC, transportation — which mostly just move headcount around within school-allocated staffing or the even smaller non-compensation budget wedge.
- Leadership failed to highlight the staffing shift. The new governance structure (Student Outcomes Focused Governance) has further prevented board members from recognizing, let alone investigating, this shift. It is maintained by a 1-vote majority on the board. Correcting governance to require deep finance understanding from the board is the first structural problem to fix.
- The next Superintendent must restructure culture and staff. The unchecked $40M growth happened on someone’s watch. Getting a strong Superintendent is the second structural problem to fix.
What’s next?
Most of it is written now! But much of it moved to reddit and was pushed out in a less polished fashion. Here’s the links:
- SPS By The Numbers District Finance (and data) dashboard — A very flexible dashboard that joins 5+ or 10+ years of data in OSPI about finances, enrollment, and test scores for all districts in the state. It allows one to drill down into many details, create comparisons with other districts, and send stable links with the charts.
- Manufacturing a Deficit: Why we always have 100M+ in the bank but keep having to cut staff
- Cracking the Budget #1: Chronic Underspend — 50M of the Budget Deficit can be just elimited without any cuts anywhere as it has been present for 10+ years and never gets used.
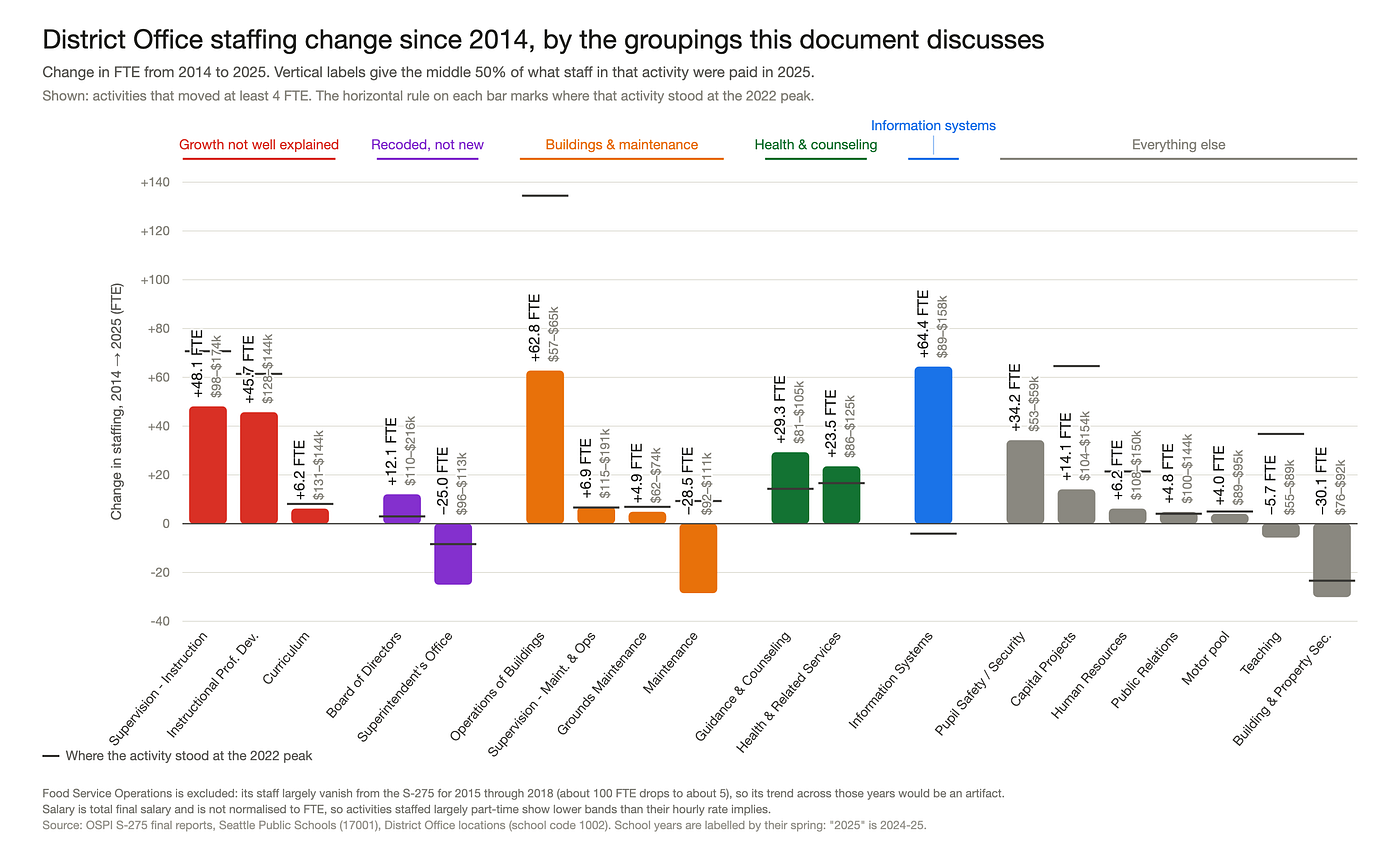
- Reddit: Growth in the District Office/Central Office — Breaks down the staffing in the 30.6% bucket by grouping activites into Teaching, Student Support, Building Support, and Other FTE.
- Reddit: Lack of relation between Per-pupil Spending per school and demographics — Analysis of FY2024–25 actual spending data by school, splitting out Special Education/Title1/Bilingual Transition/Compesenatory/etc thats shows that current allocation of funds do not relate much to demogaphic groups we keep talking about supporting.
- Reddit: Maps of School Data + Analysis of where District Office Staff comes from — Maps of FY2024-25 data on attendance, teaching experience, Funding per student, and highly capable drive times. Also shows that one source of loss of experience in South seattle is that nearly half of all hires into District Office since 2014 drew from that area.
- Reddit: SPS Enrollement vs Seattle population aged 5–17 shows declining capture — year by year comparison of enrollment (headcount and AAFTE) versus the Census SAIPE estimates for kids aged 5–17 in the district showing how SPS enrollment is declining, not because Seattle has less kids, but because fewer kids are choosing SPS.
- Reddit: Enrollment over time by schools — Description of how to use finance dashboard to look at enrollment over time for each school.
- Reddit: Teacher vs Aides — Description of staffing composition changes over time that have lead to fewer elementary classroom teachers both because budget was diverted into District Office and also because the composition of staffing under that pressure changed.
This post will be updated with corrections and new links as they’re published. Think of it as the landing page for this series. Comments? Feel free to use my **public Facebook post** for discussion.
How much does this matter?
A lot.
As an example, during the entire school closure fiasco, even the most unrealistically optimistic estimates predicted only $31M in budget savings a year. No one ever discussed District Office allocations such as the fact that in 2023–2024, we had 137 FTE of “Supervision — Instruction”. That’s nearly 1.3x more District Office instructional supervision than we have Principals.
This blindness has continued. See slide 33 from the January 22 2025 Budget Study Session:
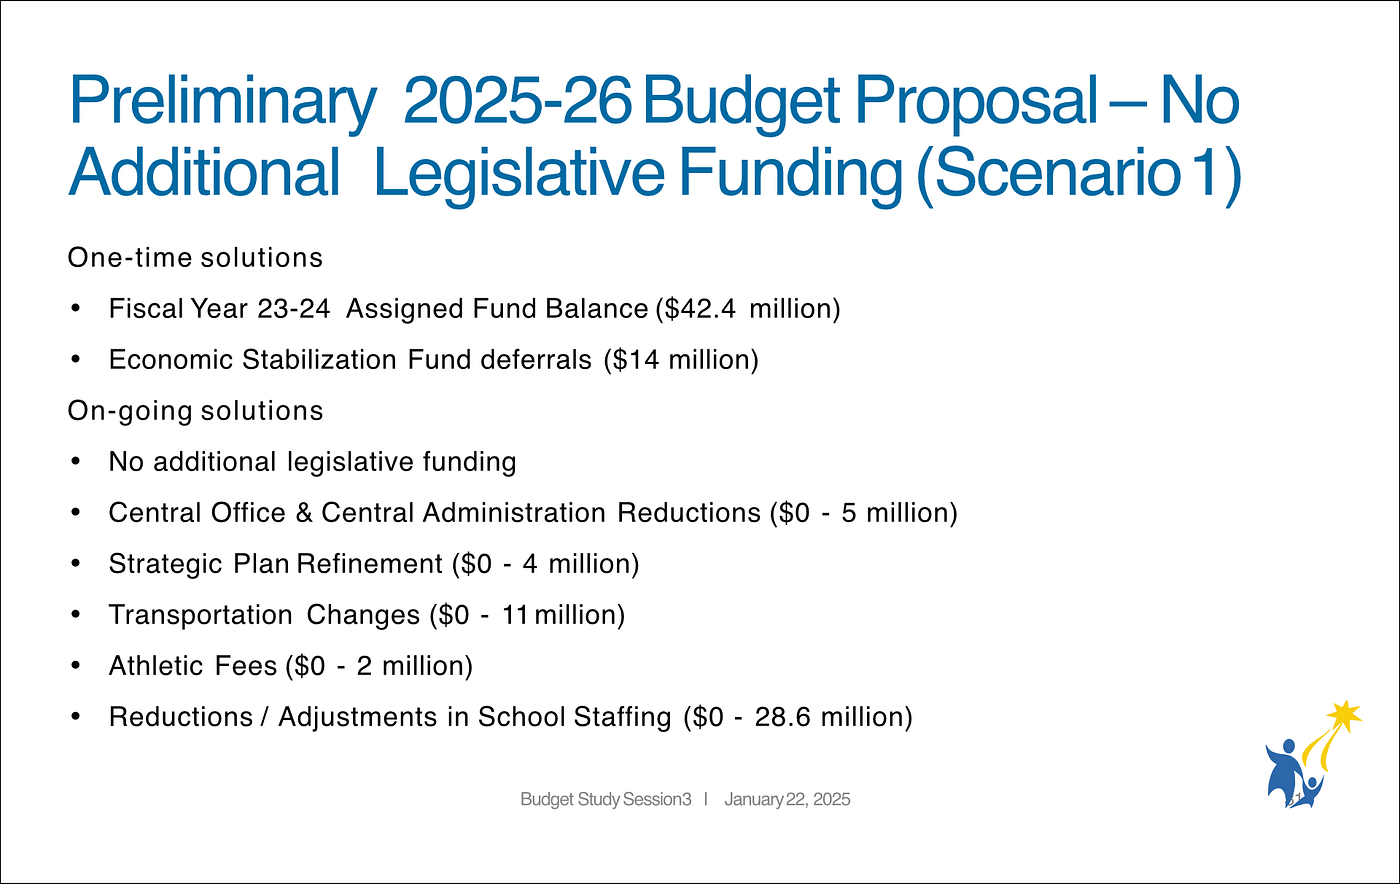
“Scenario 1” in Jan 22, 2025 Budget Study Session showing cuts focused mostly on Schools-Allocated Staffing and Transportation, but somehow only $5M from District Office Staffing.
The “Central Office & Central Administration” line item is the only one from District Office Staffing. Here’s a graph comparing the % of the budget shown in the Pie Chart earlier versus the % of the proposed reductions each category has to bear.
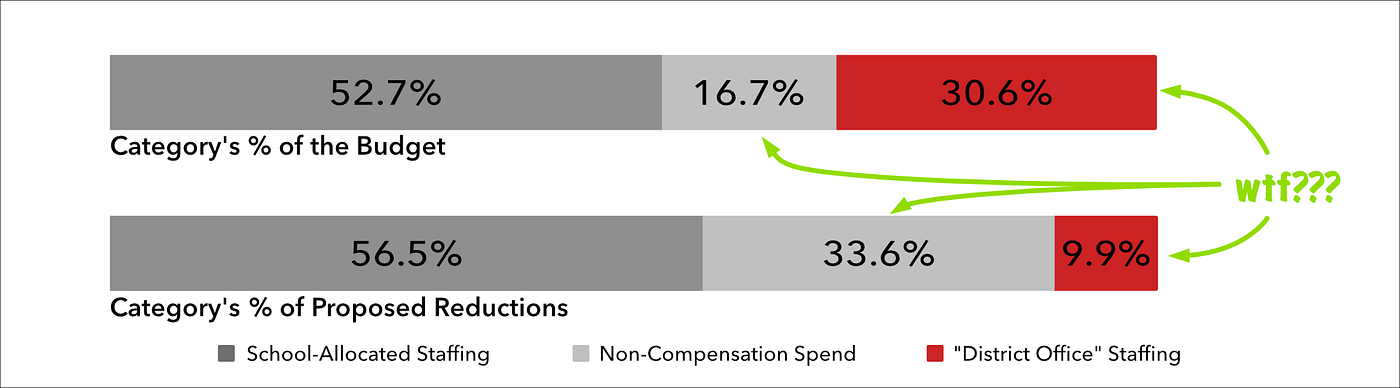
Comparison of how reductions barely “District Office” Staffing at the cost of other categories.
[embed]
The 31% District Office Staffing wedge keeps getting left out of serious examination even in the most recent reduction proposals.
Why do you choose 2013, 2019 as comparisons?
Enrollment in 2013–2014 (48,529 AAFTE) is almost exactly the same enrollment as 2024–2025 (48,229 AAFTE). Between these years, enrollment peaked in 2019–2020 (52,656 AAFTE). This makes both points a good comparison.
So… how do we fix this?
Step 1: Educate the public. Until there’s shared understanding of how things really work, meaningful reform is impossible.
Step 2: Rebuild governance. The board needs to reconstitute a Financial Committee and take ownership of strategic staffing decisions. Forget governance doctrine — this is about stewardship of public funds and any rule that prevents fixing problems needs to go.
Step 3: Hire a Superintendent from the outside who can restructure. The internal skills gap is real. If someone could have fixed this from within, they would have.
New leadership must be given restructuring power and a mandate to fix the organization. This leadership likely must also come from the outside.
This will take at least a year before we can even make meaningful change. So yes, the Superintendent search — and next year’s board elections — matter. A lot.
Step 4: The restructured governance + a strong superintendent working with the public can plan next steps. Real changes can now start.
31% is a large number, can you show your work?
Of course. It’d be ridiculous not to.
All figures are from the **2024–25 Budget Book**:
- Total Compensation = Certificated + Classified Salaries + Benefits
- Non-Compensation Spend = Total Budget — Total Compensation
- School-allocated Compensation = School Allocations “Grand Total” (p.66)
- District Office Compensation = Total Compensation — School-allocated Compensation
[embed]
2,600 FTE of staff is a large number, can you show your work?
Of course! If you just believed numbers without the math, I’d be worried.
From the 2024–25 Budget Book:
- Total Staffing (p.201) = 7270.4 FTE
- School-Allocated Staffing (p.75–185) = 4667 FTE
- Unaccounted FTE = 7270.4–4667 = 2603.4 FTE
For School-Allocated staffing, here is a spreadsheet that can be used to double check numbers. (It was generated using a Python script to parse the Budget book pdf).
$85M Budget dollars is a large number, can you show your work?
Of course! If you didn’t feel entitled to clear explana…..you get the drift.
From the 2013–2104 and 2024–2025 budget books:
[embed]
From 2013–2014 to 2024–2025, we gained 613 FTE in School Allocated Staff but 1052.5 FTE in District Office FTE. Using that and the numbers from earlier, we get:
- Change in District Office % of Total Staff = 35.81% — 27.67% = 8.14%
- Total Compensation Spend in 2024–2025 = $660M+ $384M = $1044M
- Budget dollar growth = 8.14% * $1044M = $85M
This is true even though the total % of the Budget allocated to the District Office has stayed at 30%. This happens because we underspend on budget by as much as $60 million. Detangling the relation between the % Budget dollars allocated and the FTE shift will take at least a full other post.
However, we can already see that the staffing FTE numbers show a steady shift of staffing away from schools and into the District Office that is not visible when looking at budget dollars alone.
How did we miss this?
It’s a process issue: Budget Book formatting changed over the years to give better school-level data while reducing central office oversight to just $ Allocated and not FTE. In doing so, it obscured changes in the central staffing wedge. (Here are all the budget books since 2002. For a comparison, look at 2002–2003 and 2013–2014 and ask questions like “how many people are in HR?” In 2013–2014, SPS even published this information in spreadsheet format!)
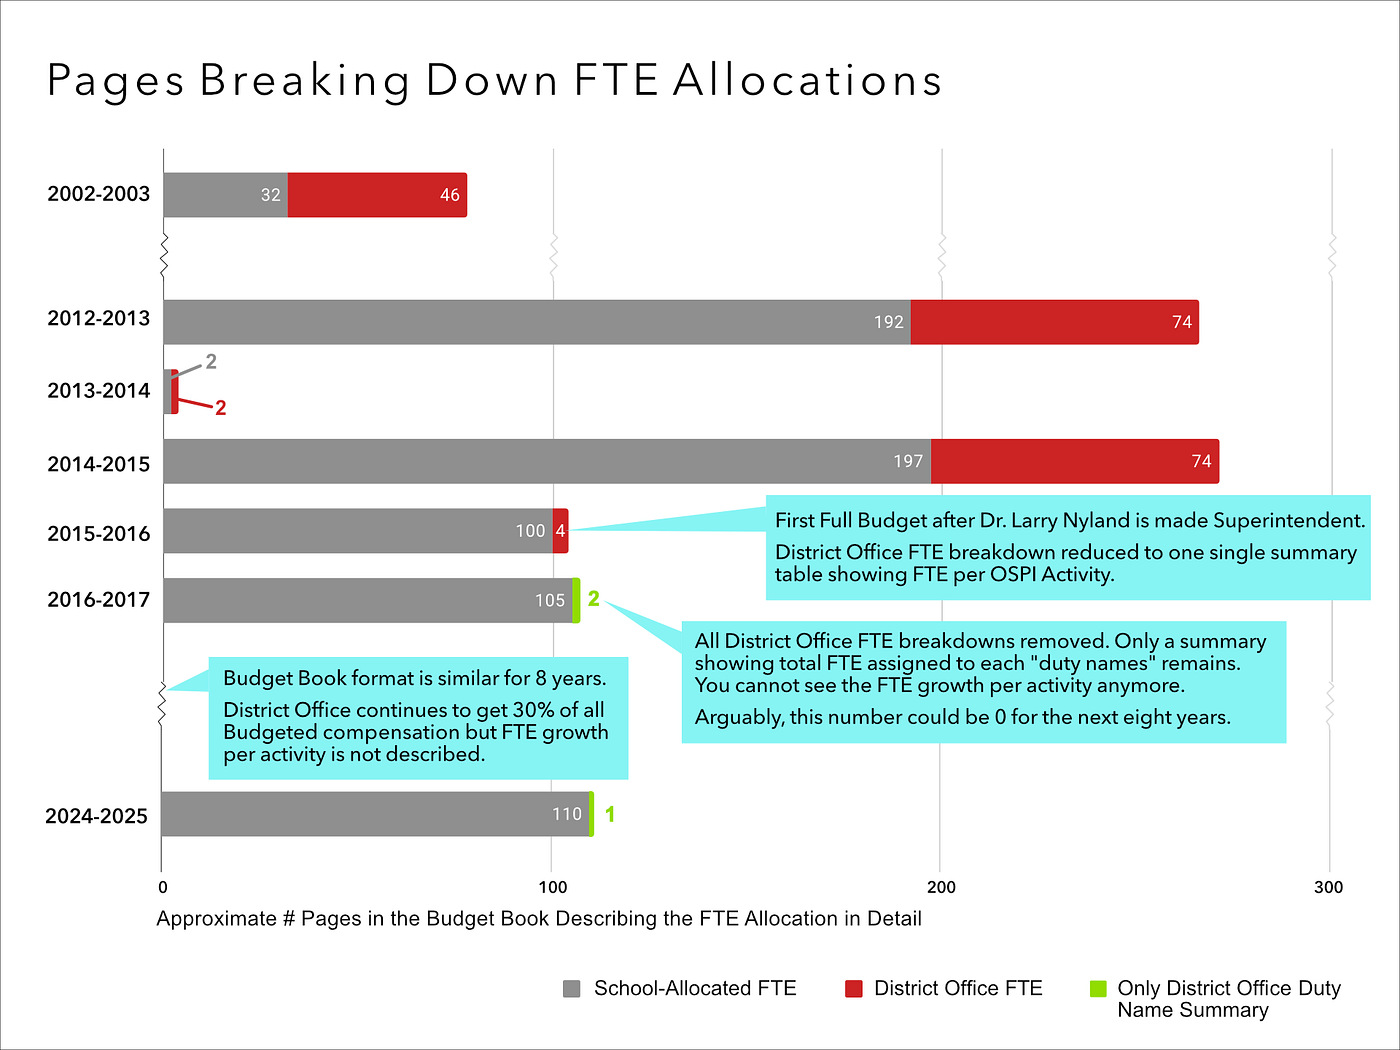
Shows removal of District Office Staffing FTE information when Dr. Larry Nyland restructured Budget book.
When we talked about school closures, many repeated the idea of a “structural deficit.” But the real deficit isn’t buildings — it’s oversight of staffing allocation.
The main change occurred in 2015–2016 during the first full budget process after Larry Nyland became Superintendent. (Historical curiosity: Liza Rankin was around too!)
Larry Nyland is on the Council of Great City Schools and a proponent of Student Outcomes Focused Governance, a governance model that discourages the School Board — who are primarily responsible for district oversight — from asking detailed questions.
Increasing the obscurity of significant parts of the budget combined with hindering detailed oversight from the Board is a recipe for budget mismanagement and eventual insolvency.
Student Outcomes Focused Governance is still being used and is maintained by a 1-vote School Board majority. It is also continuing to be pushed by some parent advocacy groups.
Does this mean $383M and 2,600 staff are idle?
No. Untracked ≠ unused.
Some of this group includes:
- Custodians and Cafeteria workers (~500 FTE)
- Staff whose roles are partially or fully funded by restricted programs such as Title I, Learning Assistance, and Special Education.
Do NOT conclude that there’s $383M free money and that school funding from the state is adequate or allocated correctly. The figures in this document are budgeted numbers, not actual spending. A significant portion goes unused each year and gets reallocated elsewhere. In fact, in 2023–2024, SPS underspent on compensation by $63M and was used to cover overages elsewhere. It is possible to be underfunded and have this gap at the same time. This will be explored this later posts.
Having said that, since 2013, things have happened such as SPS adding 127 FTE into “Instructional Professional Development” and “Supervision — Instruction”.
In 2025, we have 107 FTE of Principals.
This means over the last decade we’ve added 1.2x more staff into those two buckets than we have Principals, yet there’s been no public conversation about the value of any of those roles versus assistant principals, staff librarians, art teachers, tutors — or lower class sizes.
What can we do right now?
Whenever we see staff reductions in school-allocated roles, we must ask:
“What’s the equivalent plan for District Office reductions?”
Start with positions not directly student-facing — program managers, professional development, curriculum coaches, etc. Leave custodians, nurses, food service workers, and therapists for last.
Why are you doing this? Who’s paying you?
Hah! As if anyone could give me enough money to go dig through school data. This isn’t fun.
Speaking just for me personally, we just almost tried to close most of the schools of color in the area of the city that I was born and raised in and no one cried foul — not even orgs that wear anti-racism on their sleeves. It is the right time to step up.
Also, all of this is done using free-tier of cloud services. No money is spent cause the data just isn’t very large. :)
If you notice an error — especially a large one — send an email to sps [dot] by [dot] the [dot] numbers [at] gmail.com. I would love nothing more than to be completely incorrect because if this is even close to accurate, it would make me rather angry.
Acknowledgements
Again, thank you to the small army of data-driven folks who are talented in analysis, writing, editing, data visualization, and generally making things sane. I know many of you don’t want to be listed, but there’s no way any of this gets done without you all.
SeattleSchools #SPS #EducationReform #SchoolBudgets #PublicEducation
메타데이터
- post_id
- 57bf62c68969
- slug
- the-31-no-one-talks-about-57bf62c68969
- url
- https://medium.com/@awongawong/the-31-no-one-talks-about-57bf62c68969
- canonical_url
- https://medium.com/@awongawong/the-31-no-one-talks-about-57bf62c68969
- author_url
- https://medium.com/@awongawong
- status
- ok
- fetched_at
- 2026-08-07 22:47:36