SPY Trend Analysis Using Moving Averages: Complete Guide for Traders
SPY Trend Analysis Using Moving Averages is one of the most practical methods for understanding the direction, strength and possible…
SPY Trend Analysis Using Moving Averages: Complete Guide for Traders
SPY Trend Analysis Using Moving Averages is one of the most practical methods for understanding the direction, strength and possible turning points of the SPDR S&P 500 ETF Trust. SPY is one of the most widely followed exchange-traded funds in the world because it tracks the S&P 500 Index, which is designed to measure the performance of the large-cap segment of the U.S. equity market and is float-adjusted market-cap weighted.
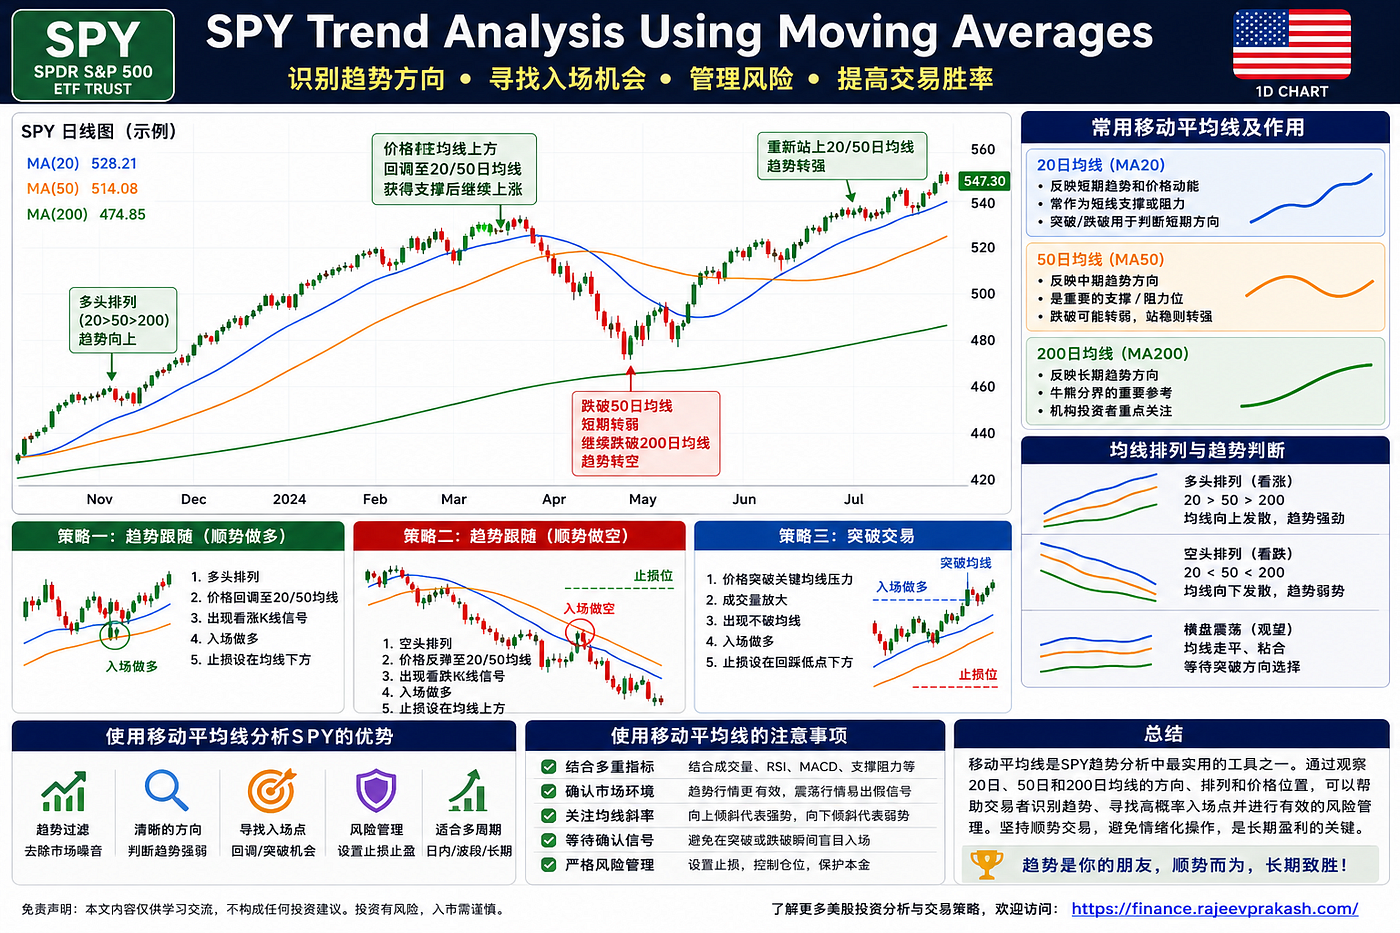
For traders, SPY is often used as a direct proxy for U.S. stock market sentiment. When SPY trends higher, it often reflects stronger risk appetite in large-cap U.S. equities. When SPY weakens, traders may become more cautious about broader market exposure. That is why moving averages are so useful. They help traders cut through daily price noise and identify whether SPY is in an uptrend, downtrend or sideways range.
A moving average is not a prediction tool. It does not know where SPY will move tomorrow. Instead, it smooths price data and gives traders a clearer view of the current trend. When used correctly, moving averages can help with entry timing, exit planning, support and resistance analysis, stop-loss placement and risk management.
What Is a Moving Average?
A moving average is a technical indicator that calculates the average price of an asset over a selected number of periods. A simple moving average, or SMA, is calculated by adding price data for a specific period and dividing that total by the number of periods. Fidelity explains that SMA is one of the easiest moving averages to construct because it is simply the average price over a specified period.
An exponential moving average, or EMA, works differently. It gives more weight to recent prices. Fidelity explains that EMA is similar to SMA because it measures trend direction over a period of time, but EMA applies more weight to current data and therefore follows prices more closely than a corresponding SMA.
For SPY trend analysis, both SMA and EMA can be useful. Long-term investors often prefer simple moving averages because they are smoother and less reactive. Short-term traders may prefer exponential moving averages because they respond faster to price changes. The best choice depends on trading style, timeframe and risk tolerance.
Why Moving Averages Work Well With SPY
SPY is highly liquid, widely traded and strongly connected to broader U.S. market sentiment. This makes it suitable for moving average analysis because price trends are usually visible across multiple timeframes. A moving average can help traders understand whether SPY is moving with a clear trend or simply moving sideways.
Moving averages work well with SPY for three reasons. First, SPY reflects a broad basket of large U.S. stocks, so its trend can represent broader market direction. Second, SPY has strong trading activity, which makes technical levels more visible to traders. Third, institutional and retail traders often watch similar moving averages, especially the 20-day, 50-day and 200-day averages.
However, traders should not forget that SPY is still an ETF and carries risk. Investor.gov explains that ETFs are not guaranteed or insured by the FDIC or any other government agency, and investors may lose money if the securities held by the fund decline in value.
Key Moving Averages for SPY Trend Analysis
The most common moving averages used in SPY trend analysis are the 20-day, 50-day and 200-day moving averages. Each one serves a different purpose.
The 20-day moving average is useful for short-term trend analysis. It helps traders see whether SPY has short-term momentum. If SPY stays above the 20-day moving average, short-term sentiment is often strong. If SPY keeps failing below the 20-day moving average, short-term momentum may be weakening.
The 50-day moving average is useful for medium-term trend analysis. Swing traders often use it to identify pullback opportunities, trend continuation and breakdown risk. When SPY remains above the 50-day moving average, the medium-term trend is usually healthier. When SPY breaks below it and cannot recover, traders may become more cautious.
The 200-day moving average is one of the most important long-term trend tools. Many traders and investors use it to separate bullish and bearish market conditions. When SPY trades above a rising 200-day moving average, the long-term trend is often considered constructive. When SPY trades below a falling 200-day moving average, market risk may be higher.
How to Identify an SPY Uptrend With Moving Averages
A strong SPY uptrend usually has three visible features. First, price trades above the major moving averages. Second, the shorter moving averages remain above the longer moving averages. Third, the moving averages slope upward.
For example, if SPY is trading above the 20-day, 50-day and 200-day moving averages, and the 20-day average is above the 50-day average while the 50-day average is above the 200-day average, the trend structure is bullish. This type of alignment is often called bullish moving average alignment.
In an uptrend, moving averages often act as dynamic support. SPY may pull back to the 20-day or 50-day moving average and then bounce. These pullbacks can provide better entry points than chasing price after a sharp rally. A disciplined trader waits for price to approach support, watches for a reaction and then plans the trade with a defined stop-loss.
The key is patience. Buying SPY only because it is above a moving average is not enough. A better approach is to wait for price confirmation, such as a bounce from a moving average, a bullish candle, improving volume or a break above a short-term resistance level.
How to Identify an SPY Downtrend With Moving Averages
A downtrend has the opposite structure. SPY may trade below the 20-day, 50-day and 200-day moving averages. The shorter moving averages may stay below the longer moving averages. The moving averages may slope downward.
In a downtrend, moving averages often become resistance. SPY may rally toward the 20-day or 50-day moving average, fail to break above it and then move lower again. This is why traders should be careful when buying every dip in a weak market.
A common mistake is assuming that a short-term bounce means the downtrend has ended. If SPY remains below the 200-day moving average and the 50-day moving average is still falling, a bounce may simply be a relief rally. Traders should wait for stronger confirmation before assuming that the trend has reversed.
Downtrend analysis is especially important for risk management. If SPY breaks below major moving averages with strong selling pressure, traders may reduce long exposure, tighten stops or wait for a better setup.
The 20-Day Moving Average for Short-Term SPY Trading
The 20-day moving average is popular among short-term traders because it reacts relatively quickly to price changes. It can help traders identify short-term momentum and possible pullback zones.
When SPY is in a strong uptrend, price may stay near or above the 20-day moving average for several weeks. If price pulls back to the 20-day line and bounces, traders may treat it as a short-term continuation signal. If SPY breaks below the 20-day moving average and fails to recover, short-term momentum may be weakening.
However, the 20-day moving average can produce false signals in sideways markets. When SPY is moving in a range, price may cross above and below the 20-day average many times without creating a meaningful trend. That is why the 20-day average should be used with support, resistance and volume.
The 50-Day Moving Average for Swing Trading SPY
The 50-day moving average is one of the most useful tools for SPY swing traders. It is slow enough to filter out some short-term noise but fast enough to detect medium-term trend changes.
In a healthy uptrend, SPY may pull back to the 50-day moving average and then resume its upward movement. Traders often watch this area for signs of support. If price bounces from the 50-day moving average with strong volume, it may signal that buyers are defending the trend.
If SPY breaks below the 50-day moving average and stays below it, the medium-term trend may be weakening. This does not always mean a bear market has started, but it can be an early warning that momentum has changed.
The 50-day moving average is especially powerful when it aligns with horizontal support. If SPY pulls back to the 50-day average at the same time it tests a previous breakout level, that area becomes more important.
The 200-Day Moving Average for Long-Term SPY Trend Analysis
The 200-day moving average is widely watched because it reflects long-term market direction. Traders and investors use it to judge whether SPY is in a broad bullish or bearish phase.
When SPY trades above a rising 200-day moving average, long-term market structure is often considered strong. Long-term investors may stay invested, while swing traders may focus more on buying pullbacks. When SPY trades below a falling 200-day moving average, risk may be higher, and traders may become more defensive.
The 200-day moving average can also act as a major support or resistance zone. If SPY falls toward the 200-day average and buyers defend the level, it may create a strong bounce. If SPY breaks below the 200-day average and cannot recover, the market may face deeper weakness.
Still, the 200-day moving average is not perfect. It can lag price action. By the time SPY crosses it, a large move may already have happened. That is why it should be used as a trend filter, not as a mechanical buy-or-sell signal.
Golden Cross in SPY Moving Average Analysis
A golden cross occurs when a shorter moving average crosses above a longer moving average. The most common version is when the 50-day moving average crosses above the 200-day moving average. Traders often view this as a bullish long-term signal.
A golden cross suggests that medium-term price strength is improving relative to the long-term trend. If SPY is also trading above both moving averages and volume is improving, the signal becomes stronger.
However, golden crosses are lagging signals. By the time the cross appears, SPY may already have rallied significantly. Traders should avoid blindly buying only because a golden cross appears. A better approach is to use the golden cross as a trend confirmation signal and then wait for pullbacks, support tests or lower-risk entries.
Death Cross in SPY Moving Average Analysis
A death cross occurs when a shorter moving average crosses below a longer moving average. The most common version is when the 50-day moving average crosses below the 200-day moving average. Traders often view this as a bearish long-term warning.
A death cross suggests that medium-term weakness has become strong enough to pull the 50-day average below the 200-day average. If SPY is also trading below both moving averages and rallies fail at resistance, caution is necessary.
Like the golden cross, the death cross is also a lagging signal. It should not be used alone. A death cross may appear after SPY has already dropped sharply, and a relief rally may follow. Therefore, traders should combine it with market structure, volume and support levels.
Using Moving Averages as Dynamic Support and Resistance
One of the best ways to use moving averages in SPY trend analysis is to treat them as dynamic support and resistance. Unlike horizontal levels, moving averages change every day. They move with price and can show where buyers or sellers may react.
In an uptrend, the 20-day or 50-day moving average may act as support. When SPY pulls back to these lines, buyers may step in. In a downtrend, the same moving averages may act as resistance. When SPY rallies into them, sellers may return.
The strongest signals happen when dynamic moving average support aligns with horizontal support. For example, if SPY pulls back to the 50-day moving average and that level also matches a previous breakout zone, the area becomes more important.
Combining Moving Averages With Volume
Volume helps confirm moving average signals. If SPY breaks above a key moving average on strong volume, the breakout has more credibility. If SPY breaks above the moving average on weak volume, the move may be less reliable.
The same applies to breakdowns. If SPY falls below the 50-day or 200-day moving average on high volume, selling pressure may be significant. If the break happens on low volume and price quickly recovers, it may be a false breakdown.
Volume also helps evaluate pullbacks. In a strong uptrend, healthy pullbacks often happen on lower volume, while rebounds show stronger volume. If SPY falls on heavy volume and bounces on weak volume, the trend may be losing strength.
Combining Moving Averages With RSI and MACD
Moving averages show trend direction, but momentum indicators such as RSI and MACD can add context. RSI can help identify whether SPY is overbought, oversold or losing momentum. MACD can help identify changes in trend momentum.
For example, if SPY pulls back to the 50-day moving average and RSI moves from oversold territory back upward, the bounce may be more reliable. If SPY breaks above the 20-day moving average and MACD turns positive, short-term momentum may be improving.
However, too many indicators can create confusion. The goal is not to fill the chart with tools. The goal is to use moving averages as the core trend framework and add one or two confirmation tools when needed.
SPY Moving Average Strategy for Better Entries
A simple SPY moving average entry strategy starts with trend direction. First, check whether SPY is above or below the 200-day moving average. If it is above a rising 200-day average, the long-term trend is constructive. Next, check the 50-day moving average. If SPY is above it and the 50-day average is rising, the medium-term trend is also positive.
Then wait for a pullback. The best entries often come when SPY pulls back toward the 20-day or 50-day moving average and shows signs of support. Those signs may include a bullish candle, a bounce from a previous support zone, improving volume or a break above a short-term resistance level.
This approach helps traders avoid emotional buying after a rally. It encourages buying near support, where the stop-loss can be defined more clearly.
SPY Moving Average Strategy for Better Exits
Moving averages can also help with exits. If a trader buys SPY during an uptrend, the 20-day moving average can act as a short-term trailing guide. If SPY closes below the 20-day average after a strong rally, the trader may reduce some exposure. If SPY breaks below the 50-day moving average, the trader may reduce further.
Longer-term investors may use the 200-day moving average as a major risk line. If SPY breaks below the 200-day moving average and fails to recover, it may be a warning to review portfolio risk.
Exits should not be based on panic. A clear moving average rule can help traders make decisions calmly. The goal is not to sell the exact top. The goal is to protect capital and avoid letting a profitable trade become a large loss.
Moving Averages in Sideways SPY Markets
Moving averages work best in trending markets. They are less reliable in sideways markets. When SPY trades in a range, price may cross above and below moving averages repeatedly. This can create false signals and cause traders to overtrade.
In sideways markets, support and resistance become more important than moving average crosses. Traders should identify the range high and range low. A moving average breakout is more meaningful only if price also breaks out of the broader range with volume confirmation.
This is why market environment matters. Before using a moving average strategy, ask whether SPY is trending or ranging. If it is trending, moving averages can work well. If it is ranging, use them carefully.
Common Mistakes in SPY Moving Average Analysis
The first mistake is using moving averages as automatic buy-and-sell signals. A price cross above a moving average does not guarantee a rally. A price cross below a moving average does not guarantee a crash.
The second mistake is ignoring timeframe. A 20-day moving average may show weakness while the 200-day moving average still shows a long-term uptrend. Traders must match the moving average to their trading style.
The third mistake is changing settings too often. If you constantly switch from 20-day to 21-day to 30-day averages, your system becomes inconsistent.
The fourth mistake is ignoring risk management. No moving average strategy works all the time. Every trade needs a stop-loss, position size and target.
The fifth mistake is trading in choppy markets without confirmation. Moving averages can generate many false signals when SPY is range-bound.
Practical SPY Moving Average Trading Framework
A practical SPY moving average framework can follow a simple process. First, identify the long-term trend using the 200-day moving average. Second, identify the medium-term trend using the 50-day moving average. Third, use the 20-day moving average to judge short-term momentum.
If SPY is above all three moving averages and they are rising, the trend is strong. Traders may focus on buying pullbacks. If SPY is below all three moving averages and they are falling, the trend is weak. Traders may reduce long exposure or wait for a better setup. If SPY is moving back and forth through the averages, the market may be sideways, and traders should avoid overtrading.
This framework keeps the analysis simple and disciplined. It also helps traders avoid emotional decisions.
Final Thoughts on SPY Trend Analysis Using Moving Averages
SPY Trend Analysis Using Moving Averages is a powerful but simple way to understand market direction. The 20-day moving average helps identify short-term momentum. The 50-day moving average helps define medium-term trend strength. The 200-day moving average helps judge long-term market structure.
Moving averages can help traders find better entries, plan exits, identify dynamic support and resistance, confirm trend changes and manage risk. However, they should not be used alone. The best SPY moving average strategies combine price structure, support and resistance, volume, RSI, MACD and disciplined risk management.
SPY is a broad-market ETF, but it still carries market risk. Traders should always use stop-losses, avoid overtrading and match their strategy to their timeframe. Moving averages are not magic lines. They are tools that help traders make more structured and less emotional decisions.
For more financial market insights, trading strategies, technical analysis guides and investment tools, visit Rajeev Prakash Finance.
메타데이터
- post_id
- 5837d1dee9eb
- slug
- spy-trend-analysis-using-moving-averages-complete-guide-for-traders-5837d1dee9eb
- url
- https://medium.com/@astrologyindiatech/spy-trend-analysis-using-moving-averages-complete-guide-for-traders-5837d1dee9eb
- canonical_url
- https://medium.com/@astrologyindiatech/spy-trend-analysis-using-moving-averages-complete-guide-for-traders-5837d1dee9eb
- author_url
- https://medium.com/@astrologyindiatech
- status
- ok
- fetched_at
- 2026-08-06 07:12:48