Website Performance Optimization (Part — 1): Performance Importance & Monitoring
Performance Importance: Why Performance Matters More Than You Think
Website Performance Optimization (Part — 1): Performance Importance & Monitoring
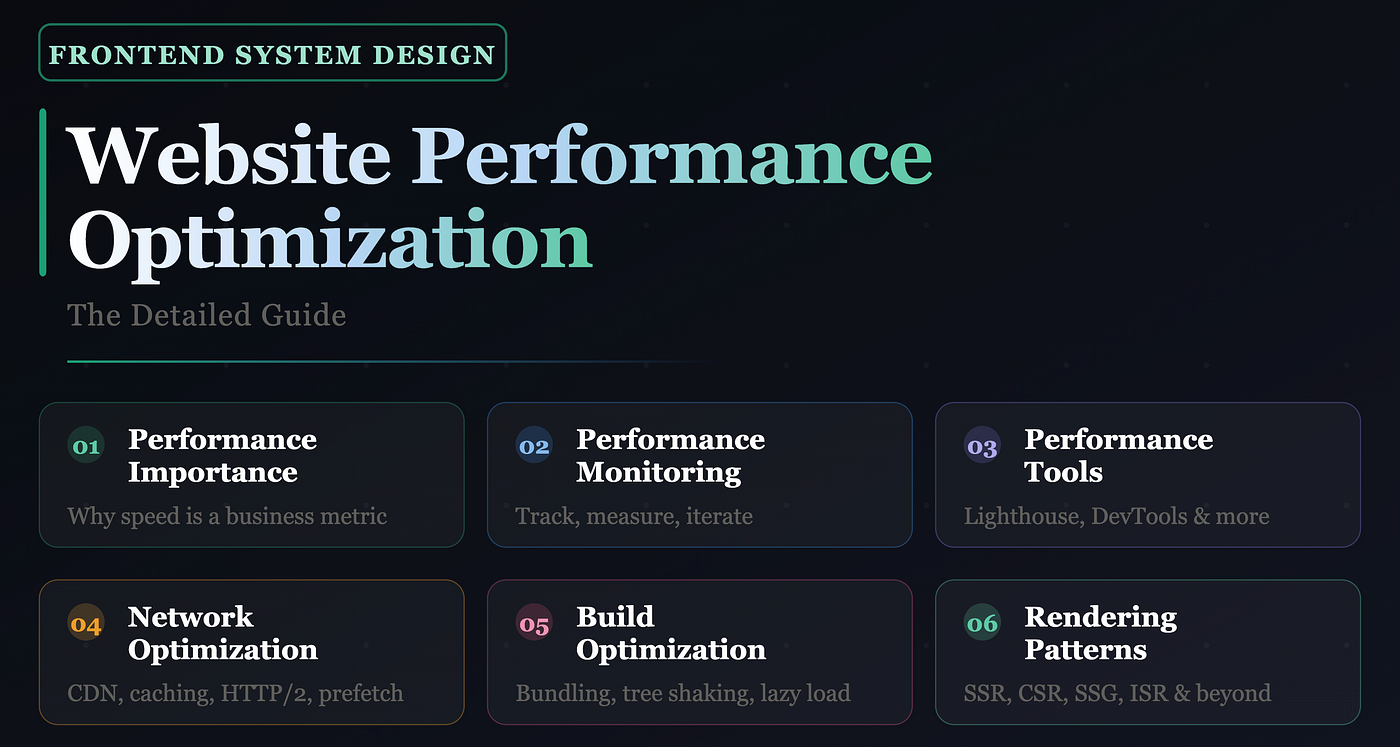
Performance Importance: Why Performance Matters More Than You Think
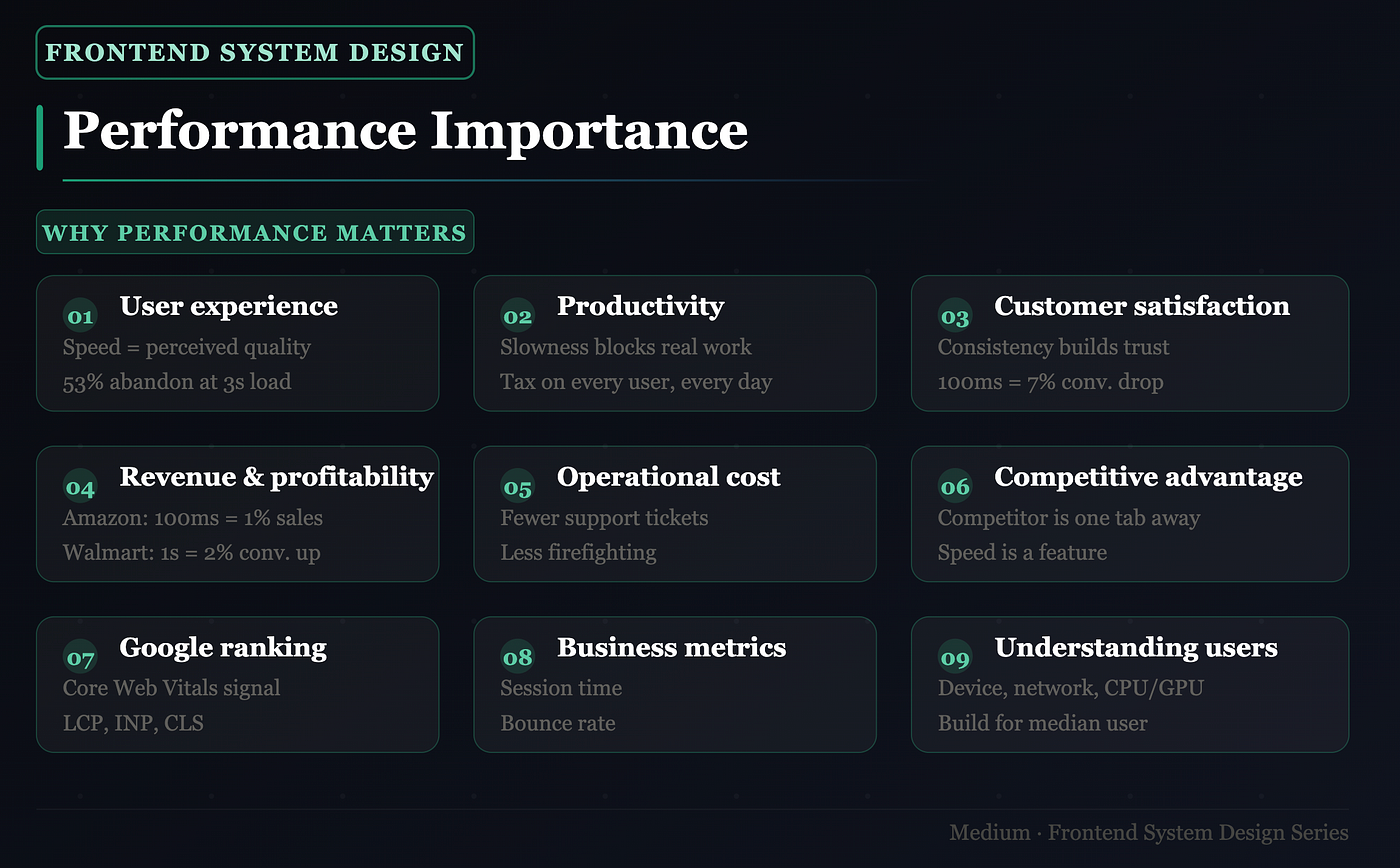
1. User Experience
- Performance is the experience — users don’t separate speed from quality, they’re the same thing
- People actively avoid slow products (e.g. government websites) not because content is missing, but because the experience feels disrespectful of their time
- Fast products like Swiggy or Zepto have reset user expectations — anything slower feels broken
- Google stat: 53% of mobile users abandon a site that takes more than 3 seconds to load
2. Productivity
- Performance problems hit hardest when stakes are highest — flash sales, peak traffic events
- Example: During a big sale, if a seller dashboard lags, catalog updates time out and inventory edits fail — every second of lag = missed orders + frustrated partners
- For internal tools and B2B platforms, slowness doesn’t just annoy — it blocks actual work
- A slow dashboard compounding across a team is essentially a daily tax on everyone using it
3. Customer Satisfaction
- Satisfaction is built on consistency — and users notice performance most when it’s bad
- One smooth checkout followed by a spinning loader the next time breaks trust immediately
- Akamai research: a 100ms delay in load time can drop conversion rates by 7%
- At scale (say, ₹500 crore daily GMV), even a 1% drop is a massive revenue impact
- A bad experience gets talked about; a fast seamless experience simply brings users back
4. Revenue & Profitability
- Performance is not a tech conversation — it’s a business conversation
- Amazon: every 100ms of latency cost them 1% in sales
- Pinterest: reduced perceived wait times by 40% → 15% increase in sign-ups
- Walmart: every 1 second improvement in load time → 2% increase in conversions
- Faster site → more pages visited → more purchases completed → more revenue
- For e-commerce, performance is literally money on the table or money left behind
5. Operational Cost
- Every slow page or failed interaction is a potential support ticket
- Ops team picks it up → investigates → tries to reproduce → escalates to engineering → hours spent on something rooted in a performance issue
- Multiply that by hundreds of tickets a week — the cost is enormous
- Cost isn’t just engineering hours — it’s support staff time, customer goodwill, and engineers firefighting instead of building
- Proactively investing in performance is almost always cheaper than reactively managing its consequences
6. Competitive Advantage
- Your competitor is one tab away — if they load faster, they win
- Users associate fast products with reliability, quality, and trust
- Slow products feel unfinished, regardless of how feature-rich they are
- In mobile-first markets like India, a brand that works well on a ₹12,000 Android phone on 4G wins a customer segment premium-optimized products never reach
- Speed is a feature — and unlike most features, it benefits every user, every time
7. Google Ranking (Core Web Vitals)
- Google officially uses performance as a search ranking signal
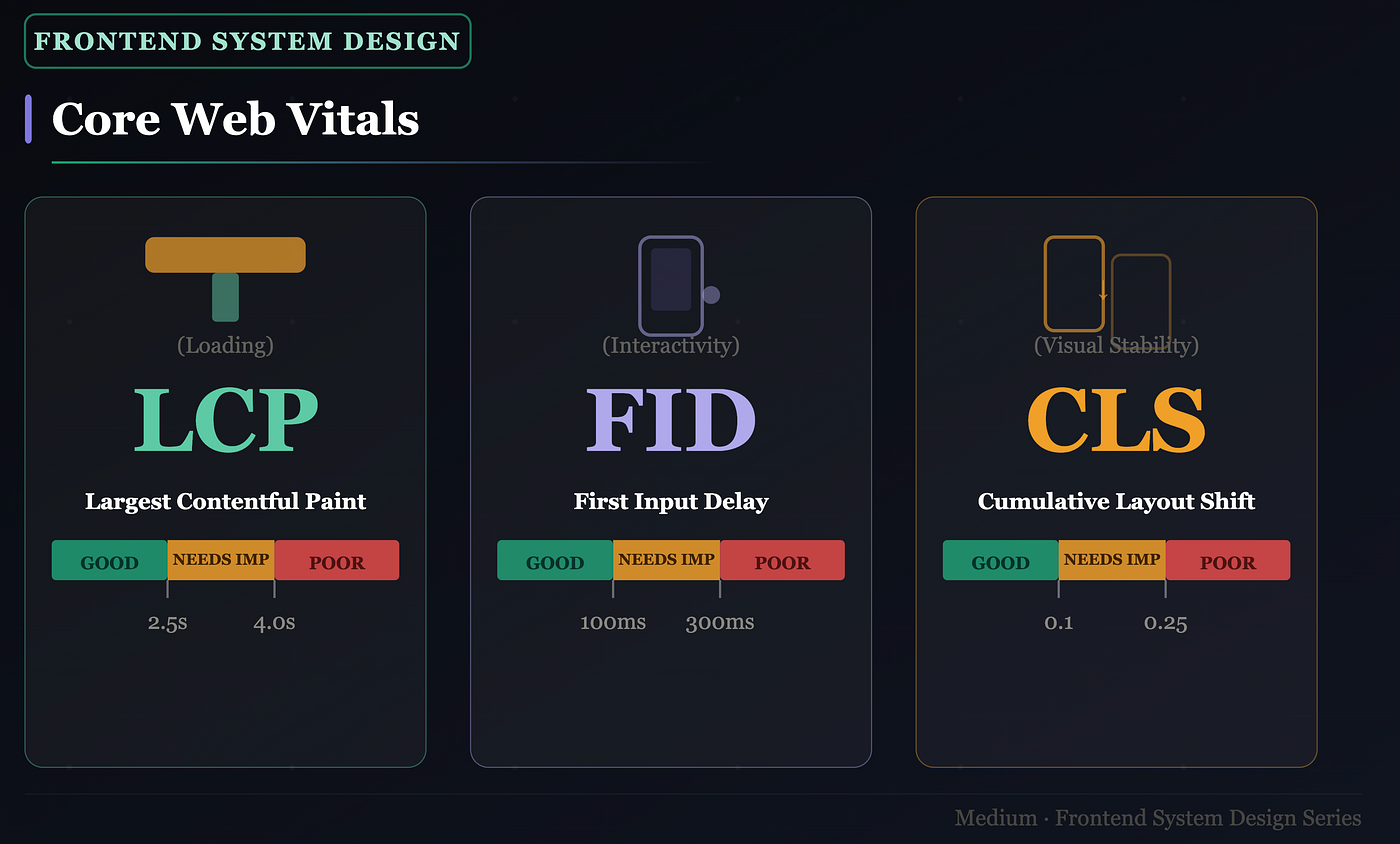
- Three key metrics under Core Web Vitals:
- LCP (Largest Contentful Paint) — how fast does main content load? Target: under 2.5s
- INP (Interaction to Next Paint) — how fast does the page respond to input? Target: under 200ms
- CLS (Cumulative Layout Shift) — does content jump around while loading? Target: under 0.1
- Poor scores = lower search ranking = less organic traffic = higher paid acquisition costs
- A slow site doesn’t just lose visitors — it loses people who never find you at all
Business Metrics to Track
-> Session Time
- Measures how long users stay and engage
- Poor performance directly reduces this — users leave faster when pages lag
- High bounce rate + short session time is almost always a performance signal
-> Bounce Rate
- A user who lands and leaves without interacting = a bounce
- Google’s data on how load time impacts bounce rate: 1–3 seconds: 32% higher bounce probability 1–5 seconds: 90% higher 1–10 seconds: 123% higher
Understanding Your Users
-> Device
- A MacBook M3 handles JS very differently from a mid-range Android phone
- In India, most users are on mobile — optimize for mid-range Android, not the latest iPhone in your pocket
- Always test on real devices, not just DevTools simulations
-> Network Quality
- 4G in Bangalore ≠ 4G in a Tier 2 city
- A user on a congested 2 Mbps connection has a fundamentally different experience
- Use Chrome DevTools network throttling to simulate real conditions — the results are often humbling
-> CPU & GPU
- JavaScript is CPU-intensive; animations and canvas rendering lean on the GPU
- Weak processors struggle with heavy JS bundles and complex CSS animations in ways your dev machine never reveals
- Profiling on real devices matters as much as profiling in DevTools
The JavaScript Boot-up Time Problem
JS Boot-up Time (Median) Desktop~0.4 seconds & Mobile~3.4 seconds
- That’s an 8x difference just to parse and execute JS — before the app renders anything meaningful
- This is a processing problem, not a network problem
- Even a fast-downloading bundle takes much longer to parse and compile on a low-end device
- Key techniques to address this: code splitting, lazy loading, tree shaking, reducing main thread work
- Build for the median user, not the best-case device
Performance Metrics: How We Measure the Web
The Two Kinds of Metrics
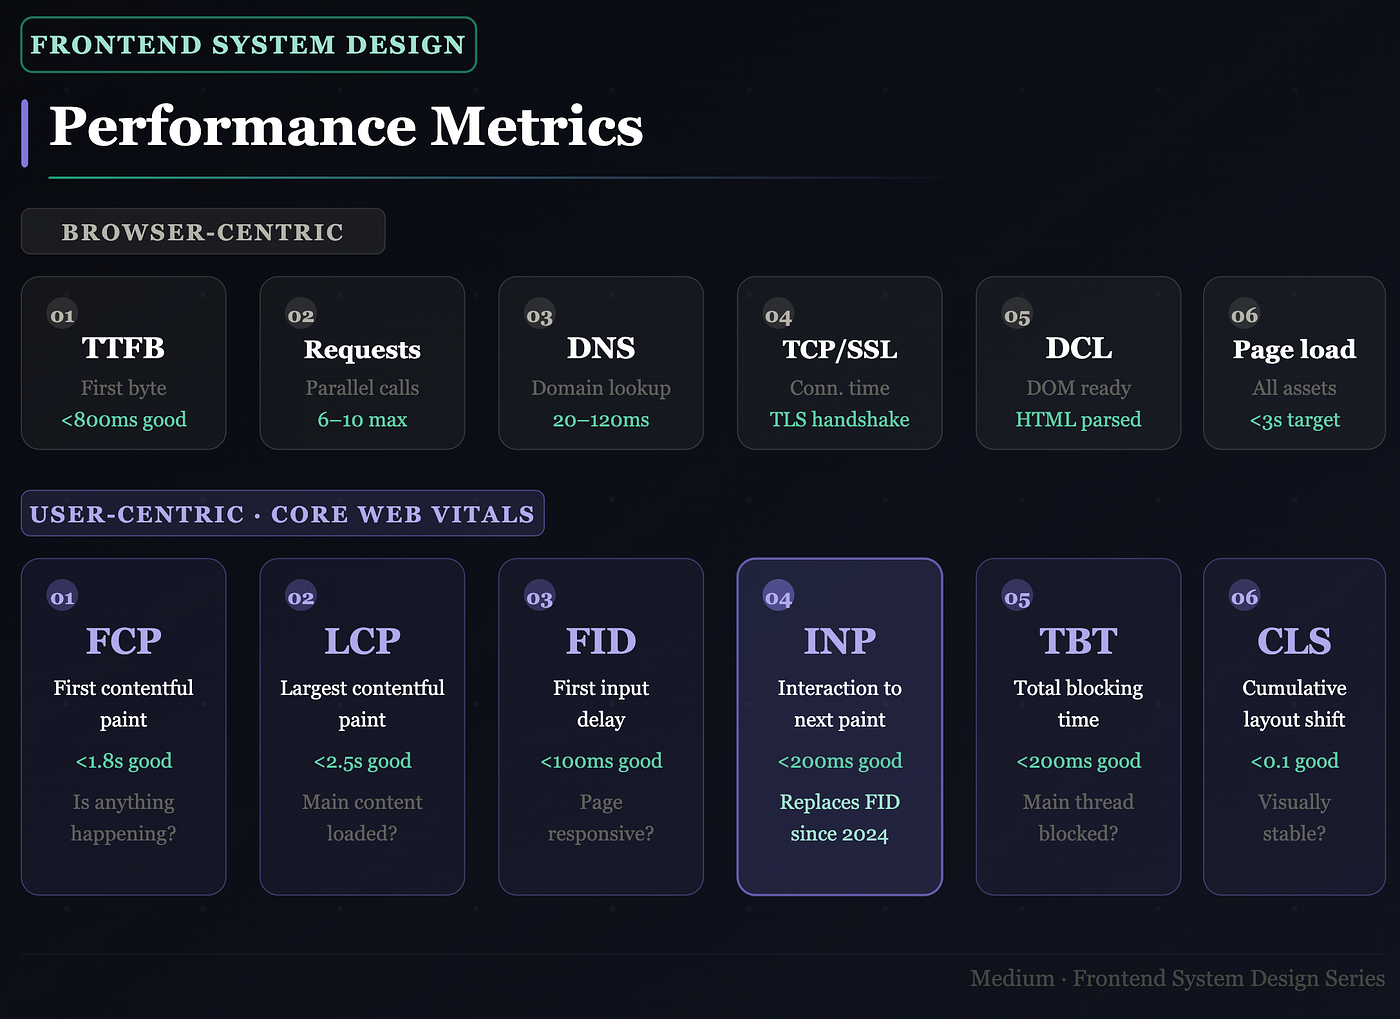
Before diving in, it helps to understand why there are two categories. Browser-centric metrics tell you what’s happening under the hood — the raw technical pipeline. User-centric metrics tell you what the user actually feels. Most of the time, user-centric metrics are what you should optimize for — because your users don’t care about DNS resolution time, they care about whether your page feels fast.
-> Browser-Centric Metrics
These are low-level signals measured at the network and browser infrastructure level.
1. Time to First Byte (TTFB)
- Measures the time from when the browser sends a request to when it receives the first byte of a response from the server
- Includes DNS lookup + connection time + server processing time
- A high TTFB usually means your server is slow to respond — could be a slow database query, no caching, or a distant server
- Example: if a user in Mumbai hits your server in the US without a CDN, TTFB could be 800ms+ before a single byte arrives
- Good TTFB: under 800ms. Above 1800ms is poor
2. Network Requests
- The total number of HTTP requests the browser makes to fully load a page — HTML, CSS, JS, fonts, images, API calls
- Browsers have a limit on parallel connections per domain (typically 6 for HTTP/1.1)
- More requests = more round trips = slower page
- Example: a page loading 12 separate JS files blocks rendering far longer than one bundled file
- Target: reduce requests via bundling, sprites, inlining critical CSS, using HTTP/2 multiplexing
3. DNS Resolution
- When a user types a URL, the browser first resolves the domain name to an IP address via DNS
- This lookup can take 20–120ms and happens before any content is fetched
- Example: if your page loads resources from 10 different domains (CDN, analytics, ads, fonts), each one needs a DNS lookup
- Fix: use
dns-prefetchandpreconnecthints to resolve third-party domains early
<link rel="dns-prefetch" href="//fonts.googleapis.com">
<link rel="preconnect" href="//cdn.example.com">
4. Connection Time
- Time taken to establish a TCP connection + TLS handshake (for HTTPS)
- TLS adds an extra round trip — on mobile or high-latency networks this is noticeable
- Example: a mobile user on a 200ms latency network may spend 400–600ms just establishing a secure connection before any data flows
- Fix: enable HTTP/2 (persistent connections), use TLS 1.3 (faster handshake), leverage keep-alive
5. DOM Content Loaded (DCL)
- Fires when the HTML is fully parsed and the DOM tree is built — but before images and stylesheets finish loading
- Render-blocking JS and CSS delay this event significantly
- Example: a
<script>tag in the<head>withoutdeferorasyncpauses HTML parsing entirely until that script downloads and executes - Fix: move scripts to the bottom, use
defer/async, inline critical CSS
6. Page Load
- Fires when everything on the page has loaded — HTML, CSS, JS, images, fonts, iframes
- This is the traditional “page load time” metric, but it’s a poor proxy for user experience since a page can feel fast long before all resources finish
- Example: a news article may feel fully loaded at 2 seconds, but the page load event fires at 8 seconds because of lazy-loaded images and analytics scripts
- Still useful for catching bloated pages; target under 3 seconds on desktop
-> User-Centric Metrics
These metrics measure perceived performance — what the user actually experiences. Google’s Core Web Vitals are a subset of these.
1. First Contentful Paint (FCP)

- Measures the time from navigation start to when the first piece of content appears on screen — text, image, SVG, or canvas
- Answers: “Is anything happening?”
- Example: on the screenshot above, FCP is the moment the headline text first appears — even before images load
- Good: under 1.8s | Needs improvement: 1.8–3s | Poor: above 3s
- Fix: reduce render-blocking resources, use server-side rendering, preload critical fonts
2. Largest Contentful Paint (LCP)
- Measures when the largest visible element in the viewport finishes rendering — usually a hero image, banner, or large heading
- Answers: “Has the main content loaded?”
- Example: on the page, LCP is when the full article image and headline are both visible and rendered
- Good: under 2.5s | Needs improvement: 2.5–4s | Poor: above 4s
- Common culprits: unoptimized hero images, slow server response, render-blocking JS
- Fix: preload hero images (
<link rel="preload">), use WebP/AVIF, serve images from a CDN
3. First Input Delay (FID)
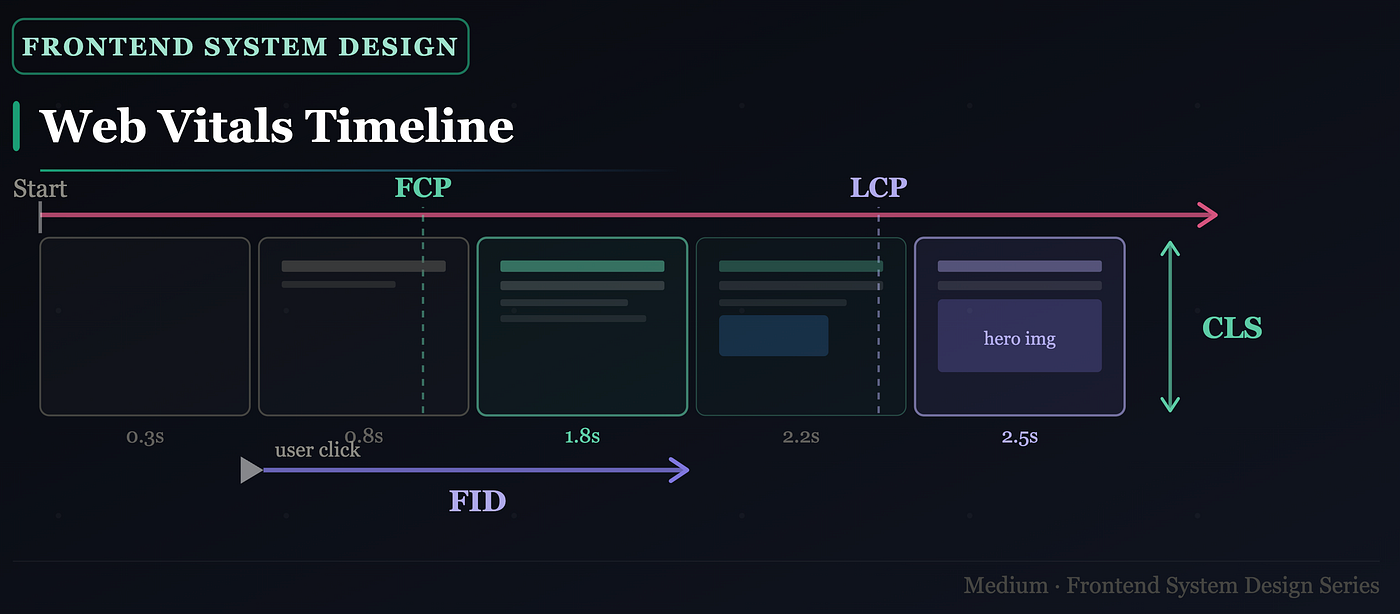
- Measures the time from when a user first interacts (click, tap, key press) to when the browser can actually respond
- Answers: “Is the page responsive?”
- Example: user taps a button 1 second after page load, but the main thread is busy parsing JS — the browser can’t respond for 300ms. That 300ms is the FID
- Good: under 100ms | Needs improvement: 100–300ms | Poor: above 300ms
- Note: FID has been replaced by INP as a Core Web Vital since March 2024
- Fix: break up long tasks, use web workers for heavy computation, defer non-critical JS
4. Interaction to Next Paint (INP)
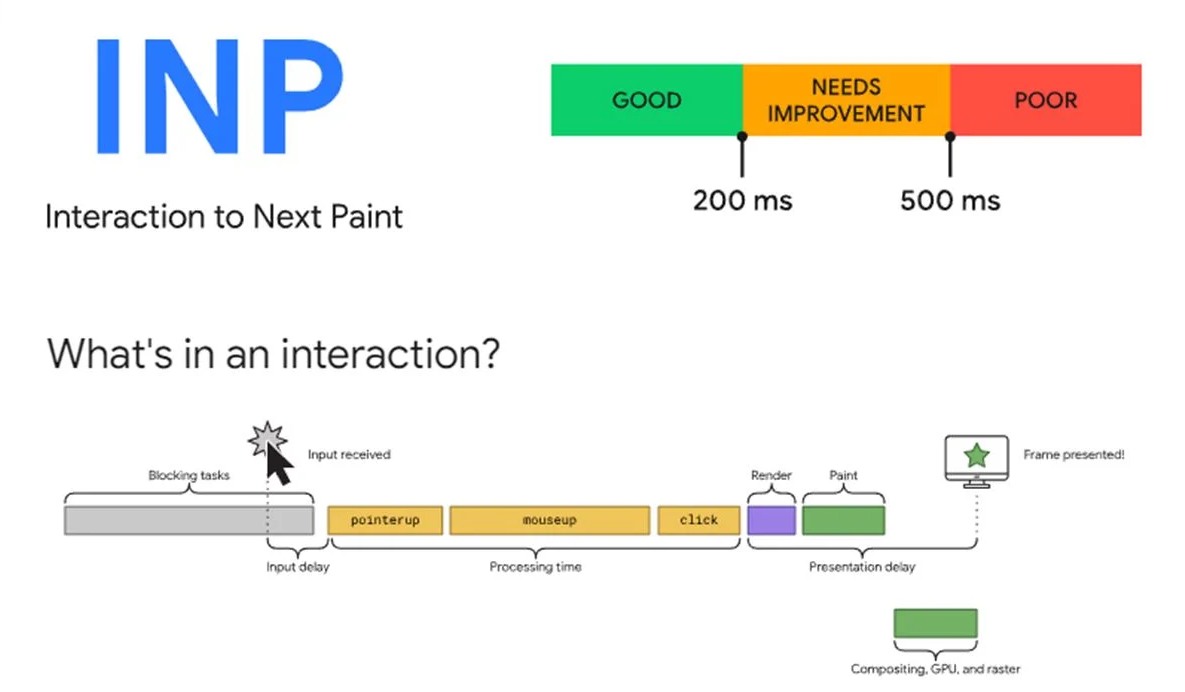
- The successor to FID — measures the overall responsiveness of a page across all interactions during a session, not just the first one
- Answers: “Does the page stay responsive throughout use?”
- As shown in the diagram above, INP captures: Input delay + Processing time + Presentation delay
- Example: a user filters a product list. The click registers instantly, but re-rendering 500 items takes 400ms before the updated list paints — that’s a poor INP
- Good: under 200ms | Needs improvement: 200–500ms | Poor: above 500ms
- Fix: avoid heavy re-renders, virtualize long lists, defer non-visual work off the main thread
5. Total Blocking Time (TBT)
- Measures the total time the main thread is blocked between FCP and TTI (Time to Interactive) — any task taking longer than 50ms is counted as “blocking”
- Answers: “How much time is the page frozen?”
- Example: if your page has three long tasks of 200ms, 150ms, and 100ms, TBT = (150 + 100 + 50) = 300ms (only the portion over 50ms per task counts)
- Good: under 200ms | Needs improvement: 200–600ms | Poor: above 600ms
- TBT is a lab metric (not measurable in the field) but strongly correlates with FID/INP
- Fix: split large JS bundles, lazy load non-critical code, avoid synchronous XHR
6. Cumulative Layout Shift (CLS)
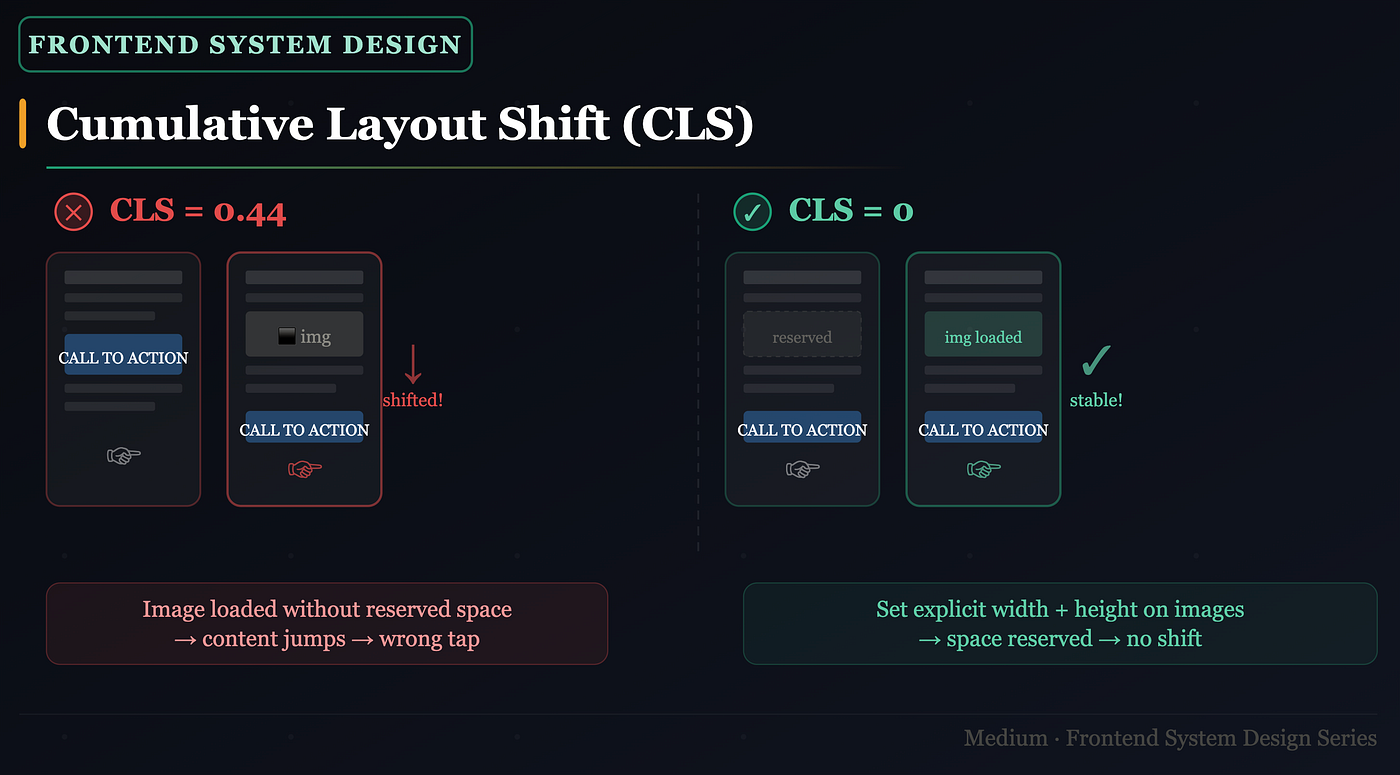
- Measures visual stability — how much the page layout unexpectedly shifts while loading
- Answers: “Is the page stable to read and interact with?”
- As shown in the image above: CLS = 0.44 means content is jumping around — the user tries to tap a button and it moves. CLS = 0 means perfectly stable
- Classic example: an ad loads and pushes the article text down, causing you to tap the wrong link
- Good: under 0.1 | Needs improvement: 0.1–0.25 | Poor: above 0.25
- Fix: always set explicit
widthandheighton images and iframes, reserve space for ads, avoid inserting content above existing content
Performance Budget
A performance budget is a set of limits you define and enforce — before shipping — for metrics that matter to your users.
- Example budget: LCP < 2.5s on 4G mobile TBT < 300ms JS bundle < 200KB (gzipped) CLS < 0.1
- Tools like Lighthouse CI, Bundlesize, and webpack-bundle-analyzer can enforce these in your CI/CD pipeline
- If a PR breaks the budget, it doesn’t ship — simple as that
- Think of it like a weight limit: you can add features, but not at the cost of performance
What’s next:
- Part 1 — [Performance Importance & Monitoring](https://ayushv.medium.com/website-performance-optimization-part-1-performance-importance-monitoring-5aad5b2cf180?postPublishedType=repub)
- Part 2 — Performance Tools (Lighthouse, DevTools, WebPageTest in depth)
- Part 3 — Network Optimization (Critical Rendering Path, HTTP/2, Caching, Compression)
- Part 4 — Build Optimization (Webpack, Vite, Tree Shaking, Code Splitting)
- Part 5 — Rendering Patterns (CSR, SSR, SSG, RSC, App Router vs Page Router)
If this article helped you think differently about web performance, share it with your team. The best performance wins happen when the entire team — not just one engineer — understands why it matters.
메타데이터
- post_id
- 5aad5b2cf180
- slug
- website-performance-optimization-part-1-performance-importance-monitoring-5aad5b2cf180
- url
- https://javascript.plainenglish.io/website-performance-optimization-part-1-performance-importance-monitoring-5aad5b2cf180
- canonical_url
- https://javascript.plainenglish.io/website-performance-optimization-part-1-performance-importance-monitoring-5aad5b2cf180
- author_url
- https://medium.com/@ayushv
- status
- ok
- fetched_at
- 2026-06-10 21:21:38