Measuring AI ROI in Retail: The Complete Practical Guide
Why This Matters: The Real Problem
Measuring AI ROI in Retail: The Complete Practical Guide

Why This Matters: The Real Problem
You’ve deployed an AI solution to your retail operation. The pilot looks promising. Leadership is excited. Then your CFO asks the question you’ve been dreading: “What’s the ROI?”
And that’s when things get messy.
Here’s the uncomfortable truth: Measuring AI ROI in retail is harder than most people think. You’ve got seasonal fluctuations that make March completely different from February. You’ve got a new marketing campaign running at the same time you deployed the AI. Your inventory system doesn’t talk to your POS system. Your customer data is fragmented across five platforms.
Add all that together, and suddenly you can’t tell if improvements came from the AI or from external factors. A retailer I know deployed an inventory optimization AI in November and saw great results but Black Friday also had higher traffic than the previous year, and a competitor went down during the same period. Was it the AI? Or just luck?
The CFO asked for evidence. They didn’t have it. Project lost credibility.
This guide shows you how to avoid that trap. It’s based on what actually works not theoretical best practices, but what real retailers have done to measure AI ROI credibly.
Where AI Actually Creates Money in Retail
AI doesn’t help everything equally. There are three main domains where it generates measurable ROI:
- Customer-Facing AI (The Revenue Lever)
This is where customers directly interact with your AI: smart search, personalized recommendations, 24/7 support chatbots, and frictionless checkout.
Why it works: Customers are impatient. A 70% cart abandonment rate isn’t mysterious it’s friction. Your search is confusing. Your recommendations feel random. Your support team can’t help at 2am. Customers leave and shop elsewhere.
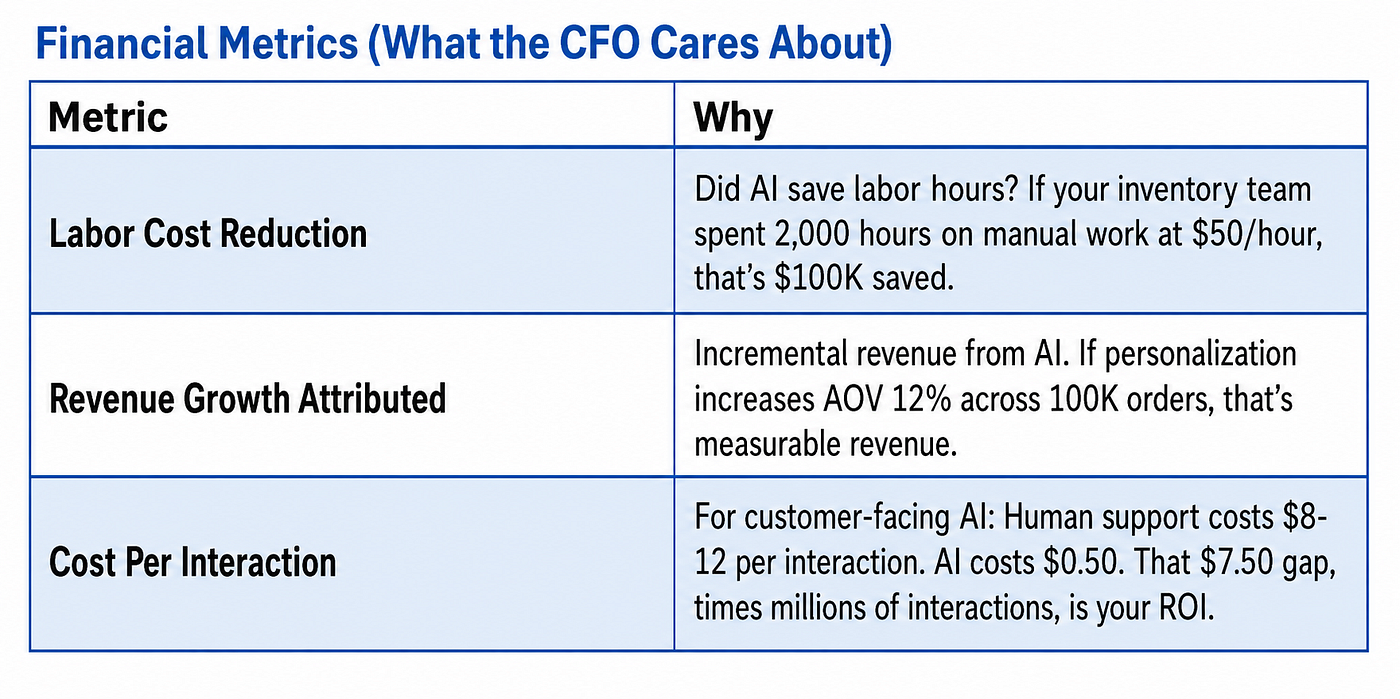
AI fixes this. Smart search interprets natural language so customers actually find what they want. Research shows 69% of consumers are already satisfied with AI recommendations. Virtual assistants handle repetitive questions in seconds. The result: 8–15% average order value lift and 30–40% support volume deflection.
Key insight: Customer-facing AI only works if customers actually use it. A beautiful recommendation engine that 5% of customers see is decoration, not a business lever.
- Operations AI (The Cost Lever)
This is the unglamorous stuff running in the background: inventory optimization, demand forecasting, automated replenishment, logistics routing.
Why it works: Inventory sitting in the wrong warehouse is dead capital. Demand forecasts that miss by 20% mean either stockouts or markdown losses. Manual processes consume 30% of your operations team’s time.
AI fixes this. Real-time demand forecasting prevents both stockouts and excess inventory. Inventory systems automatically trigger replenishment based on smart thresholds. Logistics algorithms find the most efficient routing, cutting delivery costs 15–25%.
The impact is real: 95% of retailers report decreased annual costs after deploying operational AI, and 89% report increased revenue.
Key insight: Operations AI requires clean data and system integration. If your inventory and order systems don’t talk to each other, you’ll hit a wall fast.
- Personalization AI (The Long-Term Lever)
This is the “know your customer so well you seem psychic” category: smart segmentation, dynamic pricing, real-time campaign optimization.
Why it works: Broad marketing campaigns reach everyone and resonate with nobody. AI-driven personalization means different customers get different messages at different times through different channels based on actual behavior, not guesses.
The mechanics: Customer segmentation based on behavior patterns (not just demographics). Dynamic pricing that adjusts based on demand elasticity and inventory levels. Campaign optimization that tests thousands of combinations and shifts budget to what works in real time.
Why it compounds: A customer who gets great personalized experiences comes back more often, buys more, tells friends. Customer lifetime value increases exponentially.
Key insight: Personalization builds long-term value. The impact takes time but compounds over years.
What to Measure: Keep It Simple
Here’s where most retailers go wrong: they measure everything. Fifty metrics on a dashboard nobody looks at. And guess what happens? Nothing. You can’t act on fifty things.
Pick ONE primary metric that matters for your business. Everything else is secondary.
Operational Metrics (Early Warning Signals)
· Automation Rate: % of tasks AI completes without human review. If it’s declining, you’ve got a quality issue.
· Error Rate: % of outputs requiring human correction. 2% error rate means 1 in 50 customers got bad info. That’s churn risk.
· System Uptime: Is it available when you need it? 95% uptime = 36 hours downtime per month. During holiday season, that’s $250K in lost sales.
· Cycle Time Reduction: How much faster is the AI version? 24-hour process becoming 4-hour process is a real win.
Customer Satisfaction Metrics (Long-Term Health)
Here’s a fact that surprised me: Up to 72% of AI initiatives fail to deliver value without measuring customer satisfaction. That’s because accurate AI can still destroy your brand if customers hate the experience.
Track NPS and CSAT directly. If satisfaction goes up, revenue follows. If it goes down, you’ve got a problem even if other metrics look good.
The Attribution Problem: Is It the AI or Just Luck?
Your revenue went up 25%. Great! But why? Was it the AI you deployed? The new marketing campaign running simultaneously? The competitor who raised prices? Seasonal demand?
Without proper attribution, your ROI claim is just a guess. And when the CFO asks for evidence, you’re stuck.
There are three ways to solve this:
A/B Testing (Gold Standard): Split users randomly 50% get AI, 50% don’t. Measure the difference. This directly answers “What would have happened without the AI?” The catch: You need volume. Thousands of customers in each group for statistical confidence. Timeline: 2–4 weeks minimum.
Holdout Groups (Pragmatist’s Choice): Roll out AI to most customers, but keep a control group untouched for measurement. Less rigorous than A/B testing but practical for production scale. Timeline: 3–6 months to see clear differences.
Uplift Modeling (For Data People):Use machine learning on historical data to estimate AI’s incremental impact while controlling for other variables. Powerful but complex. Only use if you have data science expertise.
Pilot to Production: The 78% Problem
Here’s the gap that kills most AI projects: 78% of retailers have AI pilots. Only 14% successfully scale them.
Why? Because pilot and production measure different things.
In a pilot, you have clean data (you manually cleaned it), enthusiastic users (you hand-picked them), and 24/7 engineering support. You measure accuracy and adoption.
In production, you have messy real-world data, users who find workarounds, and support spread thin. You measure whether you can afford to run this profitably.
A pilot system that needs humans to approve 40% of decisions looks great at small scale. At production scale with millions of transactions, that becomes 4 million human reviews per month. That’s unsustainable.
This is why autonomy level matters. It’s the best predictor of whether something scales: • Level 1: Humans approve everything (high cost, low scale) • Level 2: AI handles routine cases; exceptions to humans (balanced, sustainable) • Level 3: AI autonomous with periodic audits (most profitable, requires monitoring)
If your pilot system is stuck at Level 1 or has a 40% exception rate, it won’t scale. Fix it before rolling out.
Your 6-Step Checklist Before Deployment
-
Write a one-page ROI hypothesis: current baseline, target improvement, cost, timeline. Get stakeholder sign-off. This prevents moving goalposts.
-
Establish baseline metrics from 3–6 months of historical data. You cannot measure improvement without knowing where you started.
-
Identify your control group (who won’t get AI). Commit to keeping them untouched during measurement. This enables attribution.
-
Audit data quality. Fix obvious problems: missing values (>20% = problem), duplicate records, inconsistent formats. One week of cleanup prevents six months of bad measurement.
-
Pick ONE primary metric. Cost savings? Revenue lift? Customer satisfaction? Pick one. Everything else is secondary.
-
Plan for seasonality. Either control for it statistically or use a control group. Never compare March to February in retail.
Three Real Stories: How It Actually Works
Story 1: The Inventory Manager Who Convinced the CFO
Baseline: 14% of inventory was excess or out of stock, costing $12M per year. Pilot: Deployed AI to 50 stores, kept 50 as control for 3 months. Result: AI stores improved to 11% (3% gain), control stores unchanged. Extrapolation: 3% × $12M = $360K annual savings. Minus infrastructure costs, that’s $160K net year one benefit. CFO approved scaled rollout because methodology was airtight. Payback: Year 2.
Story 2: When Segmentation Matters
Pilot showed 12% AOV lift from personalization. Looked great. Scaled to all traffic. Reality: 8% average (5% for mobile users, who were underrepresented in pilot). Why? Pilot was mostly web users (higher engagement baseline). Lesson: Test across all customer segments in pilot, not just high-value ones.
Story 3: The Support AI That Just Worked
Baseline: 110K support conversations/month at $12 each = $1.32M monthly cost. AI deployed: Handled 65% autonomously at $0.50 each, escalated 35% to humans. New cost: $498K monthly. Year 1 savings: $9.86M. Payback: 7 days. Why it worked: Clear baseline, realistic model assumptions, proper pilot with metric tracking.
5 Mistakes That Destroy Credibility
· Measuring 50 metrics instead of focusing on one primary metric → No clear signal
· Comparing seasonal periods (March vs. February) → False attribution
· Deploying without establishing baseline → Can’t measure improvement
· Deploying to all users (no control group) → Can’t isolate AI’s impact from market factors
· Stopping measurement after launch → Missing model drift and performance degradation
7 Questions Retail Leaders Actually Ask
Q1: Where should we start?
High-volume (1,000+ transactions/week), painful (costing money or losing customers), measurable (clear success criteria), with clean-ish data. Avoid complex autonomous workflows first. Start with operational wins before consumer-facing ones.
Q2: How do we convince the CFO?
Use control groups (hard to argue with randomization). Be conservative with estimates. Show your work so every number is auditable. Acknowledge limitations. CFOs fund AI when you’ve measured it rigorously.
Q3: What if we deployed without a control group?
Establish one now for future measurement. Past data is ambiguous, but future data can be clean. Or use statistical controls if you have enough data.
Q4: How often do we measure?
Daily: operational health (is it working?). Weekly: adoption/volume. Monthly: primary business metric. Quarterly: deep review. Annual: comprehensive audit. Continuous measurement catches problems before they become crises.
Q5: Typical payback period?
Support AI: 6–12 months (labor savings are immediate). Inventory/Operations: 10–18 months (margin-based savings are slower). Personalization: 8–15 months (revenue lift takes time to compound). Retailers achieving faster payback focused on high-volume, feasible use cases.
Q6: Team doesn’t trust the AI?
Start with easy cases (routine questions, obvious automation opportunities). Demonstrate value. Build trust gradually. Never force adoption without demonstrated quick wins that creates resistance, not adoption.
Q7: Managing multiple AI projects?
Standardize your measurement framework across all projects (baseline → target → timeline → control group). Sequence projects if possible. Deploy Project A, learn from it, then deploy Project B. Multiple concurrent projects almost always fail at measurement.
Bottom Line: Five Things You Need
AI ROI in retail is measurable. You don’t need perfect data or complex mathematics. You need:
- A Clear Hypothesis (written down, stakeholder sign-off, locked
- A Baseline (measured before deployment, 3–6 months of data)
- A Control Group (so you know what would’ve happened without AI)
- One Primary Metric (the one metric that matters most)
- Continuous Tracking (daily/weekly/monthly to catch problems early)
Do these five things and your ROI will be defensible. Your CFO will believe it. Your next AI project will get approved faster. Your team will trust the system because they can see it working.
Start today. Write your hypothesis. Establish your baseline. Then deploy.
Sources & Citations
· Riseup Labs (2026) — How AI Delivers Real ROI for Your Business: https://riseuplabs.com/how-ai-delivers-real-roi-for-your-business/
· Softermii (2026) — How to Measure ROI from AI Projects: https://www.softermii.com/blog/artificial-intelligence/how-to-measure-roi-from-ai-projects-kpis-frameworks-and-templates
· Naitive (2026) — AI ROI Metrics: Top 10 KPIs: https://blog.naitive.cloud/metrics-ai-roi-evaluation/
· Straive (2026) — 10 Essential KPIs for Measuring AI ROI: https://www.straive.com/blogs/kpi-for-measuring-the-roi-of-ai-operations/
· Agility at Scale (2026) — AI Business Impact Metrics: https://agility-at-scale.com/ai/strategy/ai-business-impact-metrics/
· Digital Applied (2026) — AI Agent Scaling Gap March 2026: https://www.digitalapplied.com/blog/ai-agent-scaling-gap-march-2026-pilot-to-production
· RingCentral (2026) — How to Implement and Scale Retail AI Solutions: https://www.ringcentral.com/us/en/blog/retail-ai-solutions/
· Druid AI (2026) — AI Use Cases in Retail: A Practical Guide: https://www.druidai.com/blog/ai-use-cases-in-retail-guide
메타데이터
- post_id
- 5bd3daa3d3f7
- slug
- measuring-ai-roi-in-retail-the-complete-practical-guide-5bd3daa3d3f7
- url
- https://medium.com/@rsatech/measuring-ai-roi-in-retail-the-complete-practical-guide-5bd3daa3d3f7
- canonical_url
- https://medium.com/@rsatech/measuring-ai-roi-in-retail-the-complete-practical-guide-5bd3daa3d3f7
- author_url
- https://medium.com/@rsatech
- status
- ok
- fetched_at
- 2026-06-24 04:09:36