Oil prices rose before the OPEC monthly report
WTI oil prices today recorded a small increase of 1.17% before the OPEC monthly report which will be delivered today. Last month’s report…
Oil prices rose before the OPEC monthly report
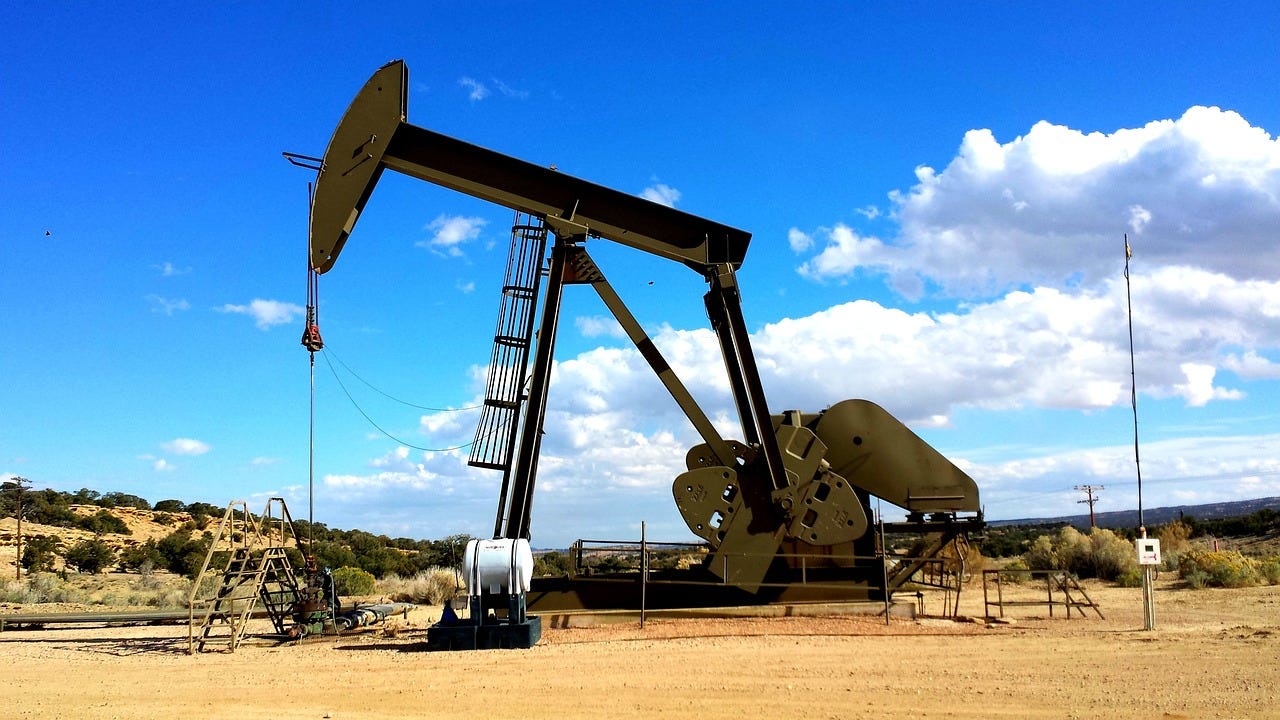
WTI oil prices today recorded a small increase of 1.17% before the OPEC monthly report which will be delivered today. Last month’s report from OPEC expected global demand to increase in anticipation of rising transportation fuel consumption and holiday driving.
Even though it still failed to reach the 80 price level on Monday, the increase in oil prices from a low of 77.37 to a high of 79.03 provided a positive impetus to the oil market.
Tensions in the Middle East have not shown any signs of a ceasefire and there could even be a more serious escalation of war.
The market is currently looking forward to US Consumer Price Index (CPI) data on Wednesday to see whether the higher-than-expected inflation recorded in the first quarter continues into April. This data is important for estimating the possibility of the Fed cutting interest rates or holding interest rates high.
Technical analysis of oil today

US crude oil prices are still trading below the 80 price level. The lowest level recently occurred on May 8 at 76.68 price level. Even though at the end of last week oil prices fell, on Monday’s trading, oil prices tried to recover even though they were still below the previous high.
On the daily timeframe, oil prices are currently moving between the middle and lower band lines. Prices tend to be in a range for several days with a swing high of around 79.70 and a swing low of 76.90.
Here the Bollinger bands draw a descending channel with the bands appearing to be starting to narrow, indicating a downtrend, market volatility is decreasing.
MA 50 near the middle band draws a flat channel, the indicator structure has not changed much indicating a sideways market.
The RSI indicator points to level 41, which means the price is moving below the downtrend level.
H1 timeframe

Price seems to be consolidating after yesterday’s increase. Oil prices are now between the upper and middle band lines.
MA 50 draws a flat channel indicating a flat signal. Bollinger bands draw an ascending channel with wide spaced bands reflecting an uptrend with high volatility.
The RSI indicator points to level 56, which means the price is moving above the uptrend level.
Support and resistance
S3: 79 S2: 79.06 S1: 79.13 PP: 79.19 R1: 79.26 R2: 79.32
메타데이터
- post_id
- 5bed3e4ebd09
- slug
- oil-prices-rose-before-the-opec-monthly-report-5bed3e4ebd09
- url
- https://medium.com/@bagja7878/oil-prices-rose-before-the-opec-monthly-report-5bed3e4ebd09
- canonical_url
- https://medium.com/@bagja7878/oil-prices-rose-before-the-opec-monthly-report-5bed3e4ebd09
- author_url
- https://medium.com/@bagja7878
- status
- ok
- fetched_at
- 2026-07-23 20:58:20