Top products week after week — Analysis of purchasing behavior at Tchibo pilot stores
This project was carried out as part of the TechLabs “Digital Shaper Program” in Hamburg (summer term 2021) in cooperation with Tchibo.
Top products week after week — Analysis of purchasing behavior at Tchibo pilot stores
This project was carried out as part of the TechLabs “Digital Shaper Program” in Hamburg (summer term 2021) in cooperation with Tchibo.
Tchibo customers have a large selection of different non-food products every week — but which products do they prefer to buy and is there a connection between them? To gain an insight into customer preferences even before the launch of the weekly changing campaigns, Tchibo offers the respective product range in selected pilot stores four weeks ahead. To make these insights applicable for Tchibo, we applied association rules analysis to determine which product groups are frequently purchased together within these pilot stores.
Four weeks before the start of Tchibo’s weekly campaigns they offer their product range with different prices in selected pilot stores throughout Germany. So far, Tchibo has investigated how the different price levels of non-food products affect the likelihood of purchase in the pilot stores. In our project, we also took a deeper look at the composition of the shopping carts and the correlation between the various product groups. For our analysis, our partner Tchibo provided us with sales figures from 2019. This dataset is based on receipt data and, in addition to temporal and geographical information, also includes the item number with the associated product group, the campaign number, campaign day, number and price level of the purchased items per receipt. For data protection reasons, the data was anonymized.
First Steps — Data Understanding and Exploration
At the beginning of our project we dealt with data understanding and data exploration. To develop a first understanding of the data we used the Pandas Profiling Report. Further questions of our first data analysis were, for example, in which months the most products were sold, which campaign was the most successful or how many items were bought per receipt.
Methodology — Association Rules
After a detailed analysis of the receipt data, we decided to take a deeper look at the question of which product groups are frequently bought together in the pilot stores. To answer this research question, we applied association rules in the further course of the project. Association rules are a data science method that, as the name suggests, uncover the association of products with each other.
For our research question, only receipts containing items from two or more product groups are relevant. After we reduced our data set to the receipts that meet the requirements we could apply the Apriori algorithm for association analysis. To evaluate the association between the products there are three different metrics: support, confidence and lift. Assuming we have an itemset consisting of items A and B, the support describes how often this combination occurs in the total number of purchases. Confidence indicates how likely it is that A will be purchased if B is also in the shopping cart. The lift indicates how likely it is that A is bought together with B while controlling for how popular item A is.
Results of the project and data visualization
As a result of our initial analyses, we can state that an average of 1.05 items are purchased per receipt. Only 33.9% of the receipts contain more than one item per receipt and are therefore relevant for answering our research question. Of this share, 54.8% also contain more than one product group.
Applying the Apriori alogrithm, we considered the above-mentioned metrics support, confidence and lift. For the visualization of our results in a heat map, we selected itemsets with one antecedent, the independent variable and one consequent, the dependent variable. The results were sorted according to the number of receipts per assortment.
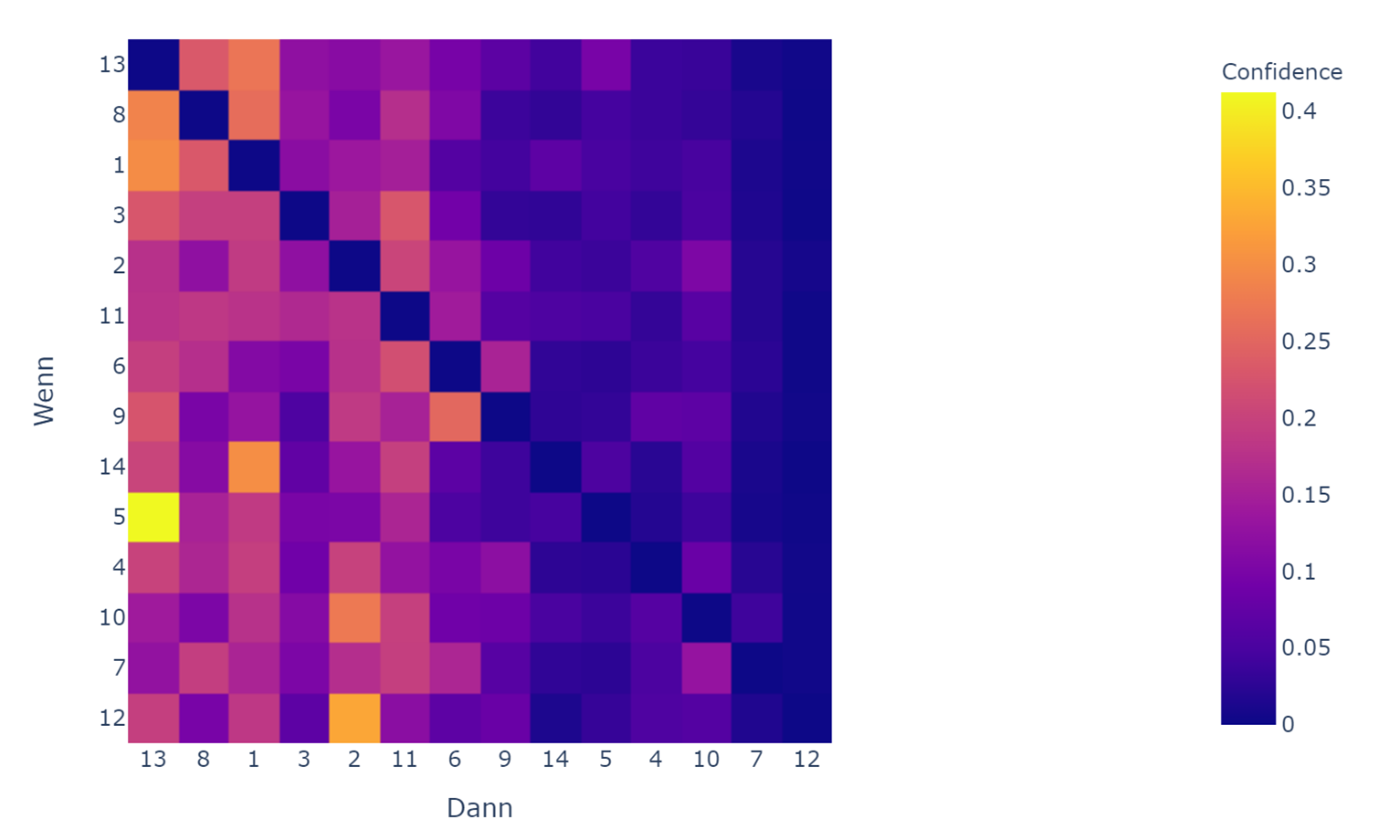
First, we took a closer look at the metrics confidence using the heatmap. In our analysis, we have a confidence range between 0 and 0.4. The colour gradient shows the popular products at the top left and the less popular ones at the bottom right. The diagonal line in the heat map shows the combination of the same product groups in each case which has accordingly — due to our adjustments — a confidence of 0.
The product groups that stand out in yellow/orange have a high confidence. The highest confidence has the case when product group 5 is bought, that also product group 13 is bought. The corresponding confidence of this rule describes that the relative proportion of having product group 5 and 13 in the shopping cart of the total number of having product group 5 in the shopping cart is around 40%.

To fully assess the validity of the analysis, it is essential to also examine the metrics lift. The lift is symmetric, this is due to the stochastic independence of the events, in our case the order of product selection.
Taking a closer look at the above-mentioned case of purchasing product group 5 and subsequently also product group 13 reveals that their lift is only about 1. However, a lift of 1 implies that there is no association between those product groups. Although the combinations of product groups 6 and 9 as well as 7 and 10 do not show a noticeably high confidence, they must be considered more closely due to their high lift of 1.4. A lift greater than 1 implies a positive correlation, in our case the lift of 1.4 means that one product group is 40% more likely to be purchased if the other product group is already in the shopping cart.
In conclusion, we see the Apriori algorithm as a suitable method to investigate dependencies between variables. To make these dependencies more comprehensible, visualizations are supportive. For our project, the representation in a heatmap proved to be particularly suitable. Despite some challenges along the way, we were able to gain some new knowledge in Data Science, especially the application of the Apriori algorithm to analyse correlations. The project was a good opportunity for us as a group to apply the theoretical knowledge from the self-study in a practical way.
Team: All Data Science track.
- Neele Baumann
- Jutta Dechant
- Tobias Kück
- Marie Prey
- Felix Steppack
Mentor: Dirk Klindworth
메타데이터
- post_id
- 5d3a1772e90d
- slug
- top-products-week-after-week-analysis-of-purchasing-behavior-at-tchibo-pilot-stores-5d3a1772e90d
- url
- https://medium.com/@TechLabs_Hamburg/top-products-week-after-week-analysis-of-purchasing-behavior-at-tchibo-pilot-stores-5d3a1772e90d
- canonical_url
- https://medium.com/@TechLabs_Hamburg/top-products-week-after-week-analysis-of-purchasing-behavior-at-tchibo-pilot-stores-5d3a1772e90d
- author_url
- https://medium.com/@TechLabs_Hamburg
- status
- ok
- fetched_at
- 2026-07-28 00:11:24




