I Ran a Multiple-Testing Audit on My Own Live Strategy. It Failed.
Deflated Sharpe and probability of backtest overfitting, applied to a sleeve I was already trading with real money. The math, the charts…
I Ran a Multiple-Testing Audit on My Own Live Strategy. It Failed.
Deflated Sharpe and probability of backtest overfitting, applied to a sleeve I was already trading with real money. The math, the charts, and the allocation cut that followed.
Photo by Berke Citak on Unsplash
One of the sleeves in my portfolio is a weekly momentum scanner. It ranks a stock universe every Monday, buys the top names, holds for five days, and exits on Friday. Backtested over a decade of weekly rebalances, its recent out-of-sample window looked genuinely good: 20.4 percent CAGR, 0.78 Sharpe, at 20 basis points of assumed trading costs.
It was live. It was earning. And a question kept bothering me: how many versions of this strategy did I try before settling on this one?
That question has a formal name, multiple testing, and quant finance has spent a decade building tools to answer it. Last week, I pointed those tools at my own live sleeve. This is what happened.
The Curve That Earned Its Slot
Here is the full backtest stream, 519 weekly returns:
One of the sleeves in my portfolio is a weekly momentum scanner. It ranks a stock universe every Monday, buys the top names, holds for five days, and exits on Friday. Backtested over a decade of weekly rebalances, its recent out-of-sample window looked genuinely good: 20.4 percent CAGR, 0.78 Sharpe, at 20 basis points of assumed trading costs.
It was live. It was earning. And a question kept bothering me: how many versions of this strategy did I try before settling on this one?
That question has a formal name, multiple testing, and quant finance has spent a decade building tools to answer it. Last week, I pointed those tools at my own live sleeve. This is what happened.
The Curve That Earned Its Slot
Here is the full backtest stream, 519 weekly returns:
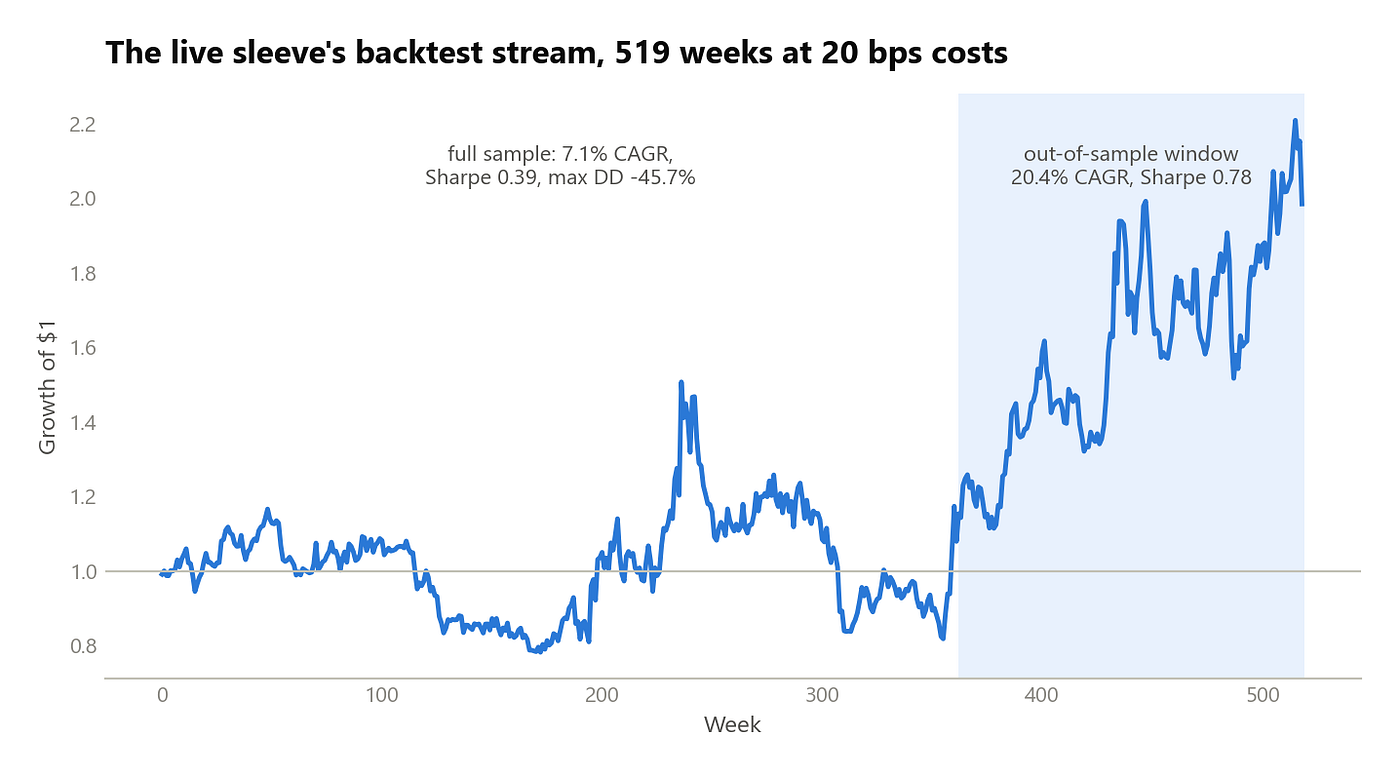
Growth of $1 in the sleeve’s backtest at 20 bps costs. The shaded region is the 157-week out-of-sample window that justified going live. Chart by author, from the audit’s raw data.
Notice the structure. The full decade compounds at 7.1 percent with a 45.7 percent max drawdown: mediocre. The recent three-year window compounds at 20.4 percent with a 0.78 Sharpe: attractive. The sleeve got funded on the strength of that recent window.
Every systematic trader recognizes this shape because every strategy that gets funded looks like this. The window that sold you is always the good one. The audit question is whether the good window is a signal or a selection.
Test One: the Deflated Sharpe Ratio
The Deflated Sharpe Ratio, from Bailey and Lopez de Prado (2014), answers a brutal question: given that you tried N strategy variants before picking this one, what is the probability that the winner’s Sharpe reflects real skill rather than being the luckiest draw of N?
The mechanism is simple. If you generate N random, zero-edge strategies, the best of them will have a positive Sharpe by pure order statistics. The more you try, the higher that phantom Sharpe hurdle rises. DSR asks whether your observed Sharpe clears the hurdle implied by your own trial count.
The honest problem: I do not know my exact N. Nobody does. Every parameter sweep, every discarded filter, every “let me just check one more lookback” is a trial, and most of them were never written down. So I computed DSR across the whole range of plausible N:

DSR for the sleeve’s out-of-sample Sharpe of 0.78, as a function of assumed prior trials N, at two cost assumptions. The shaded band is my honest estimate of the true trial count. Chart by author.
Read the blue line left to right and watch confidence evaporate:
- If this were the only strategy I ever tested (N=1): DSR 0.91. Already below the 0.95 bar.
- At N=5: 0.56. A coin flip.
- At my honest central estimate of N=20 to 40: DSR around 0.29 falling toward 0.17.
- At 60 bps of real-world costs instead of 20: DSR 0.04 at N=20. Statistically indistinguishable from noise.
The break-even is around N=3 to 5. I would need to believe I tried fewer than five variants in total, across years of iterating, for this edge to clear the bar. I know that is false.
Test Two: Probability of Backtest Overfitting
DSR has a sibling from the same research group: PBO, computed via combinatorially symmetric cross-validation. The idea: take the strategy's whole configuration family, split history into blocks, and repeatedly ask whether the configuration that wins in-sample keeps winning out-of-sample. If in-sample rank predicts nothing, your selection process is fitting noise.
My sleeve's configuration family is the grid of choices I actually swept at build time: how many names to hold, crossed with score-floor thresholds. Thirty-five siblings:

Full-sample Sharpe of all 35 configurations in the selection grid. The live configuration and the best in-sample sibling are within noise distance of each other. Chart by author.
Across 252 combinatorial splits of 519 weeks, the result:

CSCV results over the 35-configuration grid, 252 splits. A PBO of 0.5 means in-sample selection has zero predictive power for out-of-sample rank. Table by author.
A PBO of 0.51 with a median logit of exactly zero is what a coin flip looks like. My configuration selection process, the sweep I ran years ago and trusted since, carries no information about which configuration works out-of-sample.
One methodological note, because it matters for anyone replicating this: I deliberately used the conservative null variance for the DSR calculation. The empirical variance across my config grid is about 29 times smaller because the siblings are near-clones of each other, and using it would have flattered the strategy back above the bar. When a technical choice can rescue your own strategy, be suspicious of the version of you that wants to make it.
What I Did About It
Numbers this bad demand an allocation response, but the right size of that response is a portfolio question, not a purity question. So the last step was a correlation-aware simulation of the whole book with the sleeve at its current weight versus trimmed.
Three findings drove the decision:
- Keeping the full allocation beat trimming in only 1 of 12 cost-and-edge scenarios, and the win in that lone cell was 0.76 points of CAGR bought with 2 points of additional probability of a 30 percent book drawdown.
- The sleeve is positively correlated with my largest sleeve (+0.20 over the full sample, +0.37 recently). It was never buying me diversification.
- In the simulated 2022 stress window, this sleeve contributed 4.4 points of the book's 15.2-point drawdown, well above its weight.
Decision: the sleeve was cut from 15 percent of the book to 5 percent, with the freed capital parked in Treasury bills. Not killed, cut. My honest credence that the edge is real landed around one in three, and there is a pre-registered execution-cost checkpoint later this year that will either justify the remaining 5 percent or finish the job.
An audit that ends with "and I changed nothing" was not an audit. It was content.
What This Costs You to Ignore
Three takeaways from doing this to my own money instead of reading about it in a paper:
Your trial count is a debt ledger, and it compounds silently. Every variant you test raises the Sharpe your final pick must clear. If you cannot remember how many things you tried, the honest assumption is more, not fewer.
The out-of-sample window that convinced you is the most dangerous number you own. Mine said 20.4 percent CAGR. The full sample said 7.1 percent. The gap between those two numbers is exactly where selection bias lives.
The audit is cheap. The alternative is not. This entire exercise was a few days of work with published, open formulas. The alternative was discovering the same fact through a live drawdown at full weight, at the worst possible time, with real dollars paying the tuition.
Most people run these tests on strategies they are evaluating. The higher-value target is the strategy you already believe in, because that is where the unexamined trial count is hiding.
Until next time,
Lester
Disclaimer: This is not investment advice. All content is for informational and educational purposes only. Past performance does not guarantee future results. I may hold positions in the securities mentioned. The strategies discussed are personal and do not represent recommendations. Do your own research before making any investment decisions.
메타데이터
- post_id
- 5d8dcfd8cb44
- slug
- i-ran-a-multiple-testing-audit-on-my-own-live-strategy-it-failed-5d8dcfd8cb44
- url
- https://medium.com/gradient-growth/i-ran-a-multiple-testing-audit-on-my-own-live-strategy-it-failed-5d8dcfd8cb44
- canonical_url
- https://medium.com/gradient-growth/i-ran-a-multiple-testing-audit-on-my-own-live-strategy-it-failed-5d8dcfd8cb44
- author_url
- https://medium.com/@LesterLeong
- status
- ok
- fetched_at
- 2026-07-16 05:28:21