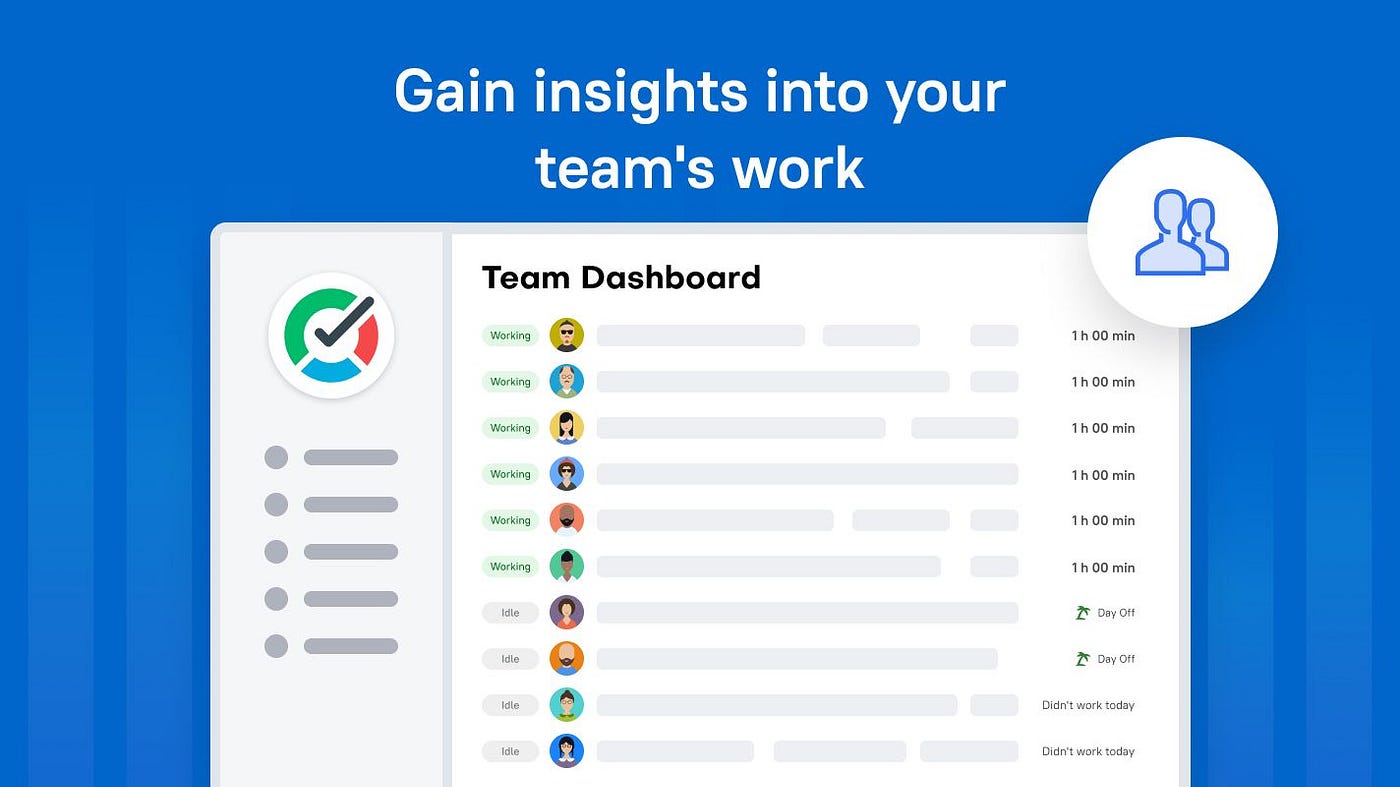
Team Dashboard: The Complete Guide to Tracking Team Performance and Productivity
Modern teams generate more data than ever before. Tasks, projects, timesheets, deadlines, workloads, and performance metrics are often…
Team Dashboard: The Complete Guide to Tracking Team Performance and Productivity
Modern teams generate more data than ever before. Tasks, projects, timesheets, deadlines, workloads, and performance metrics are often scattered across multiple tools. As a result, managers spend valuable time collecting updates instead of making decisions.
A team dashboard solves this problem by bringing the most important team data into a single visual workspace. It provides a real-time view of team performance, workload, project progress, and productivity, helping managers and employees stay aligned and focused on shared goals.
What Is a Team Dashboard?
A team performance dashboard is a centralized visual interface that displays key metrics, activities, and performance indicators related to a team’s work. Rather than digging through spreadsheets, reports, and emails, managers can instantly see how projects are progressing, how resources are being utilized, and where potential bottlenecks exist.
A well-designed dashboard typically includes:
- Project progress and status
- Team workload and capacity
- Time tracking data
- Task completion rates
- Goal and KPI performance
- Attendance and availability information
- Productivity trends and reports
By consolidating information into one place, dashboards enable faster decision-making and greater transparency across teams.
Why Teams Need a Dashboard
Without a centralized dashboard, managers often rely on manual updates and status meetings to understand what is happening across the team. This approach can lead to delays, communication gaps, and inefficient resource allocation.
A team dashboard helps organizations:
✅ Improve Visibility: Everyone can see project progress, priorities, and responsibilities in real time. This reduces the need for constant follow-ups and status requests.
✅ Balance Workloads: Dashboards reveal who is overloaded and who has available capacity, helping managers distribute work more effectively.
✅ Increase Accountability: When goals, tasks, and deadlines are clearly visible, team members have a better understanding of expectations and priorities.
✅ Support Data-Driven Decisions: Real-time performance metrics help leaders identify trends, solve problems faster, and make informed decisions based on facts rather than assumptions.
Key Metrics to Include in a Team Dashboard
The most effective dashboards focus on metrics that directly impact team performance.
☑️ Task Progress: Track completed, in-progress, and overdue tasks to understand project health at a glance.
☑️ Team Workload: Monitor capacity across employees to prevent burnout and ensure balanced resource allocation.
☑️ Time Tracking: Analyze where time is being spent and compare planned versus actual effort to improve productivity and project estimation.
☑️ Goal Achievement: Measure progress toward team objectives and KPIs to keep everyone focused on strategic priorities.
☑️ Attendance and Availability: Understand team availability, time off, and working schedules to improve planning and coordination.
☑️ Productivity Trends: Use historical data to identify performance patterns and opportunities for process improvement.
Characteristics of an Effective Team Dashboard
Not all dashboards deliver the same value. The best team dashboards share several important characteristics.
✅ Real-Time Data: Outdated information leads to poor decisions. Dashboards should update automatically and reflect current team activity.
✅ Clear Visualizations: Charts, graphs, and summaries should make insights easy to understand without requiring extensive analysis.
✅ Customizable Views: Different stakeholders need different information. Managers, team leads, and employees should be able to focus on the metrics most relevant to their roles.
✅ Actionable Insights: A dashboard should help users identify issues and take action, not simply display data.
How TMetric Helps Teams Build Better Dashboards
TMetric provides teams with a powerful dashboard that combines time tracking, project management insights, workload visibility, and performance reporting in one place.
With TMetric, teams can:
- Monitor project progress in real time
- Track billable and non-billable hours
- Analyze productivity trends
- Manage employee workloads
- Review attendance and time-off data
- Generate detailed reports for stakeholders
Instead of switching between multiple tools, managers gain a comprehensive view of team performance and project health from a single dashboard.
Whether you’re managing a remote team, a growing startup, or a large organization, TMetric helps transform raw work data into actionable insights that support smarter planning and better business outcomes.
Final Thoughts
A team dashboard is more than a reporting tool. It is a central hub for visibility, accountability, and performance management. By bringing key metrics together in one place, teams can collaborate more effectively, make faster decisions, and stay aligned with organizational goals.
The most successful teams don’t just collect data, they use it. A well-designed team dashboard gives them the clarity needed to turn information into action and consistently achieve better results.
메타데이터
- post_id
- 5e129dff810a
- slug
- team-dashboard-the-complete-guide-to-tracking-team-performance-and-productivity-5e129dff810a
- url
- https://medium.com/tmetric/team-dashboard-the-complete-guide-to-tracking-team-performance-and-productivity-5e129dff810a
- canonical_url
- https://medium.com/tmetric/team-dashboard-the-complete-guide-to-tracking-team-performance-and-productivity-5e129dff810a
- author_url
- https://medium.com/@tmetric
- status
- ok
- fetched_at
- 2026-06-10 08:17:25