Creating a Standalone and Deployable Dash App using PyQt5 WebEngine
Overview
Creating a Standalone and Deployable Dash App using PyQt5 WebEngine
Overview
Let’s see how we can create an interactive stock market dashboard using Dash and then embed it into a standalone PyQt5 application using QWebEngineView. This allows you to run the Dash app locally as a desktop application while still you can deploy it online as a web app (e.g., on Render or any other web hosting service).
Prerequisites
To follow along, ensure you have the following installed:
pip install dash plotly pandas requests dash-bootstrap-components PyQt5 PyQtWebEngineStep 1: Fetching Stock Data from Yahoo Finance
The app retrieves the most active stock symbols from Yahoo Finance and allows users to visualize stock price trends over a specified period.
import requests
import pandas as pd
from datetime import datetime
import warningswarnings.filterwarnings("ignore")headers = {
"User-Agent": "Mozilla/5.0 (Windows NT 10.0; Win64; x64) AppleWebKit/537.36 (KHTML, like Gecko) Chrome/91.0.4472.124 Safari/537.36"
}url_stocks = 'https://finance.yahoo.com/markets/stocks/most-active/?start=0&count=100'
stocks = pd.read_html(requests.get(url_stocks, headers=headers).text)[0]['Symbol'].to_list()Step 2: Setting Up the Dash App
We initialize a Dash application with Bootstrap styling for a responsive UI.
from dash import Dash, html, dcc, callback, Output, Input
import dash_bootstrap_components as dbc
import plotly.graph_objects as go
def common_layout(fig):
"""Applies a consistent layout to all figures."""
fig.update_layout(
title_x=0.5,
width=800,
height=600,
template="plotly_white"
)
return figdef empty_figure():
"""Creates a placeholder figure."""
fig = go.Figure()
fig.add_trace(go.Scatter(x=[], y=[], mode="lines"))
fig.update_layout(title="Loading Data...")
return common_layout(fig)app = Dash(__name__, external_stylesheets=[dbc.themes.JOURNAL])
app.layout = dbc.Container([
dbc.Row([dbc.Col(html.H1("Stock Market Dashboard", className="text-center mb-4"), width=12)]),
dbc.Row([
dbc.Col([
html.H4("Select a Stock"),
dcc.Dropdown(stocks, 'AAPL', id='dropdown-selection', className="mb-4"),
html.H4("Select Start Date"),
dcc.DatePickerSingle(id='start-date-picker', min_date_allowed=datetime(2000, 1, 1), max_date_allowed=datetime.today(), date="2020-01-01"),
html.H4("Select End Date"),
dcc.DatePickerSingle(id='end-date-picker', min_date_allowed=datetime(2000, 1, 1), max_date_allowed=datetime.today(), date=datetime.today().strftime("%Y-%m-%d"))
], width=3, className="bg-light p-3 rounded"),
dbc.Col([dcc.Graph(id="stock-graph", figure=empty_figure())], width=9)
], align="center")
], fluid=True)Step 3: Fetching Historical Stock Data
A callback function updates the graph based on user input:
@callback(
    Output('stock-graph', 'figure'),
    [Input('dropdown-selection', 'value'),
     Input('start-date-picker', 'date'),
     Input('end-date-picker', 'date')]
)
def update_graph(symbol, start_date, end_date):
    if not symbol or not start_date or not end_date:
        return empty_figure()

    period1 = int(datetime.strptime(start_date, "%Y-%m-%d").timestamp())
    period2 = int(datetime.strptime(end_date, "%Y-%m-%d").timestamp())
    url_history = f'https://finance.yahoo.com/quote/{symbol}/history/?period1={period1}&period2={period2}'

    data = pd.read_html(requests.get(url_history, headers=headers).text)[0]
    data.columns = ['Date', 'Open', 'High', 'Low', 'Close', 'Adj Close', 'Volume']
    data.iloc[:, 1:] = data.iloc[:, 1:].apply(pd.to_numeric, errors='coerce')
    data['Date'] = pd.to_datetime(data['Date'])

    fig = go.Figure(data=[go.Scatter(x=data['Date'], y=data["Adj Close"], mode="lines")])
    fig.update_layout(title=f"Stock Prices: {symbol}")
    return common_layout(fig)
Step 4: Embedding the Dash App in PyQt5 WebEngine
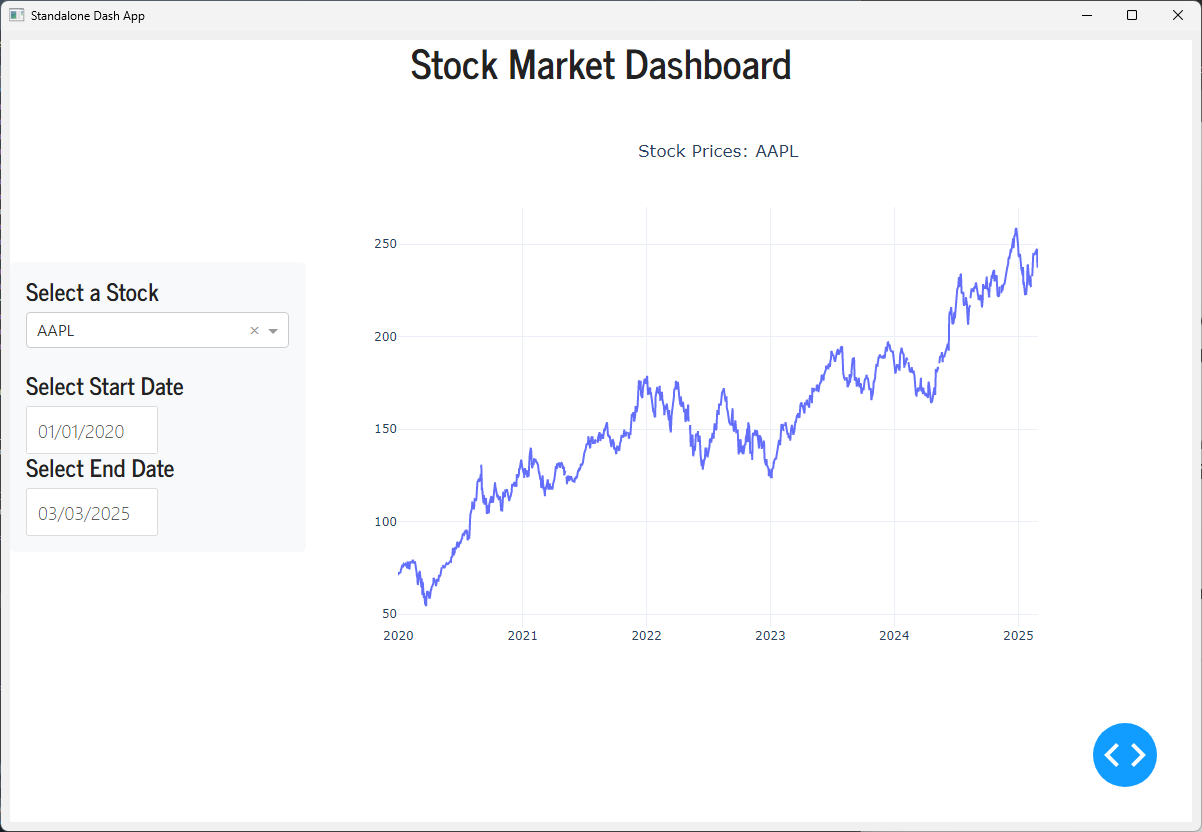
We use PyQt5’s QWebEngineView to create a standalone desktop application that runs the Dash server locally and loads the dashboard in a browser widget.
import sys
from PyQt5.QtCore import Qt, QUrl
from PyQt5.QtWidgets import QApplication, QMainWindow, QVBoxLayout, QWidget
from PyQt5.QtWebEngineWidgets import QWebEngineView
class DashWindow(QMainWindow):
def __init__(self):
super().__init__()
self.setWindowTitle("Standalone Dash App")
self.setGeometry(100, 100, 1200, 800)
self.browser = QWebEngineView()
self.browser.setUrl(QUrl("http://127.0.0.1:8050/"))
layout = QVBoxLayout()
layout.addWidget(self.browser)
container = QWidget()
container.setLayout(layout)
self.setCentralWidget(container)server = app.serverif __name__ == '__main__':
app.run_server(debug=True)
app = QApplication(sys.argv)
main_window = DashWindow()
main_window.show()
sys.exit(app.exec())Step 5: Running the Application
To run the application locally:
python app.pyThis will launch both the Dash web server and the PyQt5 application window displaying the dashboard, which looks like this:
Step 6: Deploying the Dash App Online
To deploy the Dash app on platforms like Render or Heroku:
- You can remove PyQt5 dependencies (they are only needed for the standalone desktop version). However, I kept it the way it is and deployed it on render. https://simple-dash-app-983p.onrender.com
- Add a
requirements.txtfile with necessary packages.dash pandas pyqt5 PyQtWebEngine requests datetime plotly dash-bootstrap-components gunicorn lxml - Deploy using the hosting service’s guide. I created a repository on my GitHub with app.py and requirements.txt here: https://github.com/ali-azary/simple-dash-app then deployed it on render. This is how you do it:
- Go to render.com and create an account.
- Then go to your dashboard and click “Add new” then choose “Web Service”
- Connect your GitHub Repo.
- Set Python runtime and enter:
- Build Command:
pip install -r requirements.txt - Start Command:
gunicorn app:server - And finally Click Deploy.
By following this guide, you can create a simple dash app that works as both a local standalone app and a web-hosted dashboard.
Taking Dash Apps to the Next Level
Beyond this basic tutorial, Dash allows you to build highly sophisticated and interactive applications. Here’s what you can explore next:
1. Advanced Data Handling
- Live Data Streaming — Use WebSockets or polling (
dcc.Interval) to fetch and display real-time stock or cryptocurrency data. - Big Data Integration — Connect to SQL databases, NoSQL (MongoDB), or cloud data warehouses (BigQuery, Snowflake).
- Multi-source APIs — Fetch and process data from multiple APIs (financial, weather, social media sentiment analysis).
2. Interactive & Complex UI Components
- Multi-page Dash Apps — Use
dash.Dash.pagesfor large-scale applications. - Custom Components — Create interactive UI elements using
dash.dcc.Storeand external JavaScript libraries. - Data Tables with Filtering & Sorting — Use
dash.dash_table.DataTablefor complex data manipulation.
3. High-Performance Visualization
- Advanced Plotly Charts — Candlestick, heatmaps, geospatial maps, 3D visualizations.
- Multi-axis and Subplots — Combine multiple chart types in a single figure.
- High-Frequency Financial Charts — Implement order book visualization, bid-ask spread, and time & sales data.
4. Machine Learning & AI Integration
- Predictive Analytics — Integrate scikit-learn, TensorFlow, or PyTorch models to make stock price predictions.
- NLP for Sentiment Analysis — Analyze financial news and social media sentiment to enhance decision-making.
- Reinforcement Learning in Trading — Build a backtesting dashboard using RL-based trading strategies.
5. Advanced Callbacks & State Management
- Client-side Callbacks — Optimize performance with JavaScript (
dash_clientside.callback). - Chained & Multi-Output Callbacks — Create dynamic dashboards with complex interactivity.
- Global State Management — Use
dcc.Storeor databases to maintain session states.
6. Multi-User & Authentication
- User Authentication — Implement login/logout with Flask-Login, Firebase Auth, or OAuth.
- Role-Based Dashboards — Display different content based on user permissions.
- Multi-user Collaborative Apps — Share live dashboards where multiple users can interact simultaneously.
7. Deploying & Scaling Dash Apps
- Containerization with Docker — Deploy scalable Dash apps in cloud environments.
- Microservices Architecture — Separate frontend (Dash) and backend (FastAPI, Flask).
- CDN & Load Balancing — Use cloud platforms (AWS, Azure, Google Cloud) for high-availability dashboards.
8. Embedding Dash in Desktop & Mobile Apps
- Standalone Desktop Apps — Use PyQt5/WebEngine (as we did in this tutorial).
- Mobile-Friendly UIs — Design fully responsive layouts with Bootstrap.
- Electron Integration — Package Dash apps inside an Electron.js wrapper for a true native feel.
Final Thoughts
By mastering these features, you can transform a simple dashboard into an enterprise-grade application with real-time analytics, AI-powered insights, and seamless interactivity. Whether you’re building a trading terminal, machine learning dashboard, or data analytics tool, the possibilities with Dash are limitless!
메타데이터
- post_id
- 5e8ee305c7b7
- slug
- creating-a-standalone-and-deployable-dash-app-using-pyqt5-webengine-5e8ee305c7b7
- url
- https://medium.com/@pyquantlab/creating-a-standalone-and-deployable-dash-app-using-pyqt5-webengine-5e8ee305c7b7
- canonical_url
- https://medium.com/@pyquantlab/creating-a-standalone-and-deployable-dash-app-using-pyqt5-webengine-5e8ee305c7b7
- author_url
- https://medium.com/@pyquantlab
- status
- ok
- fetched_at
- 2026-07-20 18:16:01