Mastering the JVM: From Architecture to Memory Leak Debugging
Hello viewers,
Mastering the JVM: From Architecture to Memory Leak Debugging
Hello viewers,
If you’ve been working with Java for more than a few months, you’ve likely heard the acronym JVM (Java Virtual Machine). It’s the engine that powers the world’s most popular enterprise language. But for many developers, the JVM remains a “black box.” We write code, run it, and hope it works. If it crashes with an OutOfMemoryError, we panic and restart the server.
To become a senior Java engineer or ace a technical interview, you must move beyond “hoping it works” to understanding how it works.
In this article, we’ll demystify the JVM architecture, dive deep into how Garbage Collection (GC) actually saves your application, and — most importantly — learn how to debug memory leaks like a pro.
Part 1: Under the Hood — The JVM Architecture
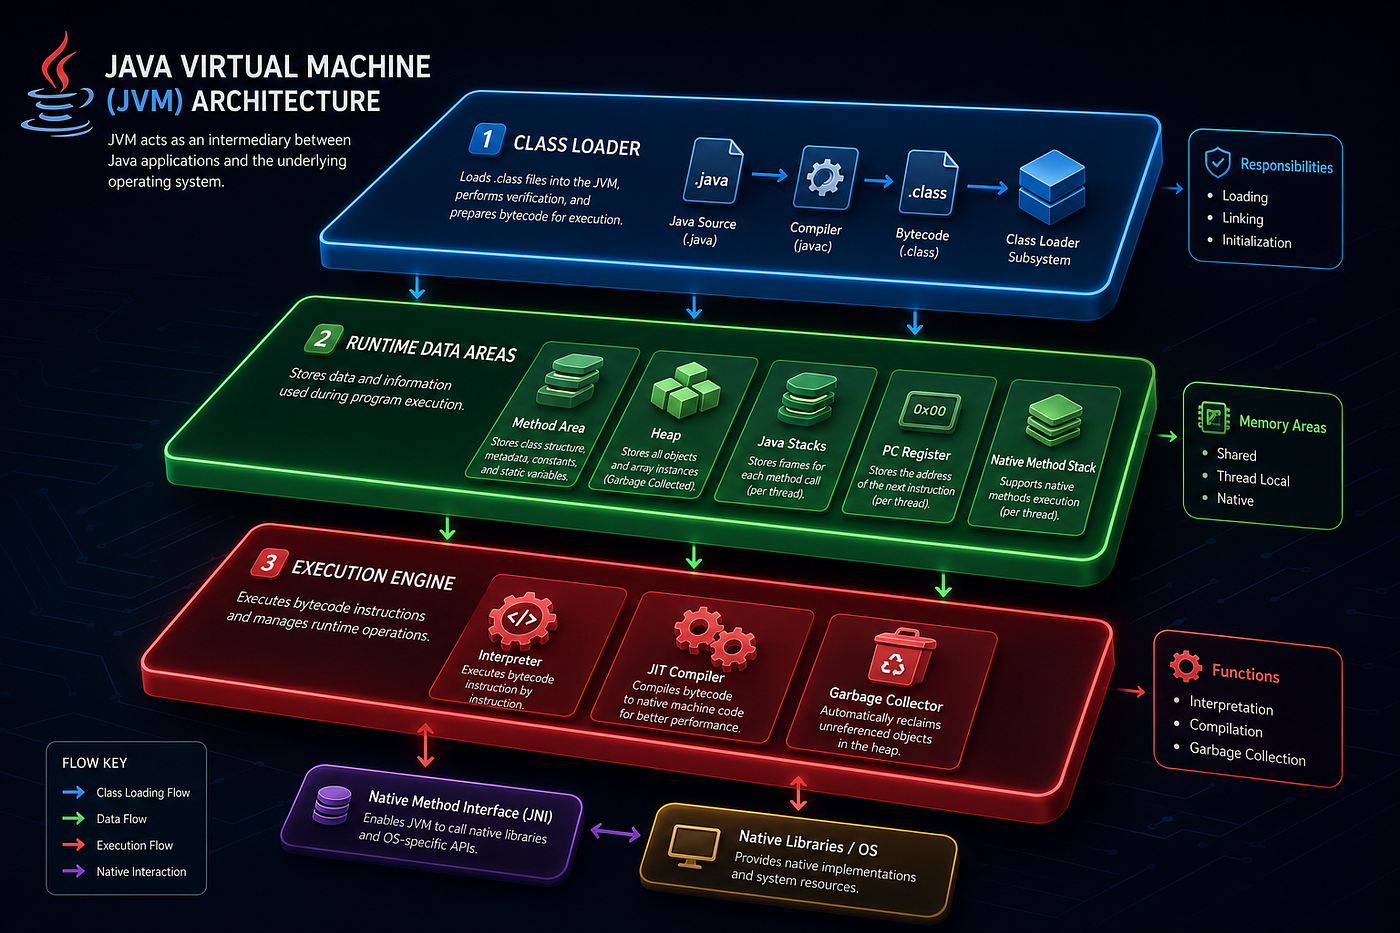
The JVM is an abstract machine that provides a runtime environment for executing Java bytecode. Its magic lies in its portability: “Write Once, Run Anywhere.” But what happens when you type java MyApp?
The Three Pillars of the JVM
The JVM consists of three main subsystems:
- Class Loader Subsystem: Loads
.classfiles into memory. - Runtime Data Areas (Memory): Where data lives during execution.
- Execution Engine: Where bytecode is executed.
The Memory Model: Stack vs. Heap
This is the #1 concept interviewers test.
FeatureJava StackHeapScopePer-threadShared across all threadsStoresLocal variables, method calls, return addressesObjects and instance variablesLifecycleCreated/destroyed with the threadManaged by Garbage CollectorErrorStackOverflowErrorOutOfMemoryError: Java heap space
Key Insight: When you create an object (
new User()), the reference is stored on the Stack, but the actual data is stored on the Heap.
The Execution Engine: Interpreter vs. JIT
Java bytecode is not executed directly by the CPU. The JVM uses two strategies:
- Interpreter: Reads bytecode instruction-by-instruction. Fast to start, but slow for repeated code.
- JIT (Just-In-Time) Compiler: Identifies “hot spots” (code executed frequently) and compiles them into native machine code. This is why Java gets faster over time.
Part 2: The Garbage Collector (GC) — Your Silent Hero
Java developers don’t manually free() memory. The GC does it for us. But how?
How GC Works: The “Reachability” Algorithm
The GC assumes that an object is alive if it is reachable from a GC Root.
GC Roots include:
- Local variables in active stack frames.
- Static variables.
- Active threads.
The Process:
- Mark Phase: The GC starts from GC Roots and traces all reachable objects.
- Sweep Phase: Any object not marked is unreachable and is eligible for collection.
Generational Hypothesis
Most GCs (like G1, Parallel, ZGC) rely on a key observation: “Most objects die young.”
- Young Generation (Eden + Survivor Spaces): New objects are created here. Minor GCs run frequently and quickly.
- Old (Tenured) Generation: Objects that survive multiple Minor GCs are promoted here. Major/Full GCs run here less frequently but take longer.
Interview Tip: Knowing which GC your application uses (G1, ZGC, Shenandoah) and why is a strong differentiator in senior roles.
Part 3: The Nightmare Scenario — Memory Leaks in Java
Java doesn’t have dangling pointers, but it does have memory leaks. A memory leak occurs when an object is no longer needed by the application, but the GC cannot reclaim it because a reference still exists.
Common Culprits
1. Static Collections
public class LeakExample {
    private static List<Object> cache = new ArrayList<>(); // Lives forever!

    public void addToCache(Object obj) {
        cache.add(obj); // Never removed!
    }
}- Why it leaks: Static fields live until the JVM shuts down. If you keep adding to
cache, the heap fills up. - Fix: Use bounded caches (e.g.,
LinkedHashMapwithremoveEldestEntry) orWeakReference.
2. Unclosed Resources
// Bad Practice
FileInputStream fis = new FileInputStream("data.txt");
byte[] data = fis.readAllBytes();
// fis is never closed!- Why it leaks: The
FileInputStreamholds a native file handle. If not closed, these handles accumulate, eventually causingOutOfMemoryErroror OS-level limits. - Fix: Use try-with-resources (Java 7+).
3. ThreadLocal Without Removal
private static ThreadLocal<Connection> tl = new ThreadLocal<>();
public void execute() {
    tl.set(connection);
    // Missing: tl.remove();
}- Why it leaks: In thread pools, threads are reused. If you don’t call
remove(), theThreadLocalvalue persists in the thread’s map, holding references to large objects. - Fix: Always call
threadLocal.remove()in afinallyblock.
Part 4: How to Debug a Memory Leak (Step-by-Step)
When your application starts crashing with OutOfMemoryError, don’t just restart it. Investigate.
Step 1: Monitor Heap Usage
Use VisualVM or JConsole (included in JDK). Look for a heap usage graph that climbs steadily without dropping. This indicates a leak.
Step 2: Take a Heap Dump
When the OOM occurs, capture a snapshot of the heap.
# Enable heap dump on OOM
-XX:+HeapDumpOnOutOfMemoryError
-XX:HeapDumpPath=/tmp/heap.hprof
Step 3: Analyze with Eclipse MAT
Open the .hprof file in Eclipse Memory Analyzer Tool (MAT).
- Go to Histogram: See which classes have the most instances.
- Go to Dominator Tree: See which objects are consuming the most memory.
- GC Roots: Trace the path from the GC Root to the leaked object. This reveals who is holding the reference.
Step 4: Fix the Code
Based on the MAT report, remove the unnecessary reference (e.g., clear the static list, close the stream, or remove the ThreadLocal).
Part 5: 6 Interview Questions on JVM Debugging
Here are 6 polished questions you might face in a senior Java interview, along with what the interviewer is looking for.
Q1: “How would you troubleshoot a java.lang.OutOfMemoryError: Java heap space?”
What they want to hear:
- First, check if the heap size (
-Xmx) is too small for the workload. - If not, suspect a memory leak.
- Explain the process: Enable heap dumps (
-XX:+HeapDumpOnOutOfMemoryError), reproduce the error, and analyze the dump using Eclipse MAT. - Mention looking for “GC Roots” to find the retention path.
Q2: “What is the difference between a Memory Leak and an OutOfMemory Error?”
What they want to hear:
- Memory Leak: A logical bug where objects are retained unnecessarily.
- OOM Error: The symptom/result. It can be caused by a leak, but also by simply having too much data for the allocated heap size.
- Emphasize that OOM is the effect, Leak is a possible cause.
Q3: “How does the Garbage Collector determine which objects to collect?”
What they want to hear:
- Mention Reachability from GC Roots.
- Explain the Mark-Sweep or Mark-Compact algorithms.
- Bonus points: Mention Generational GC (Young vs. Old generation) and the “stop-the-world” pauses.
Q4: “Why might a ThreadLocal cause a memory leak in a web application?”
What they want to hear:
- Web apps use Thread Pools (threads are reused).
- If you store a large object in
ThreadLocaland don’t callremove(), the object stays in the thread’s map. - The next request reuses the thread and sees the old object, or the object prevents GC because the thread (a GC Root) still references it.
Q5: “What is the purpose of the JIT Compiler, and how does it impact performance?”
What they want to hear:
- JIT (Just-In-Time) compiles bytecode into native machine code at runtime.
- It optimizes “hot spots” (frequently executed code).
- Impact: Java starts slower (interpretation) but runs faster over time (native code) compared to pure interpretation.
Q6: “How would you detect a memory leak in a production environment without restarting the server?”
What they want to hear:
- Use monitoring tools like VisualVM, JConsole, or APM tools (New Relic, Dynatrace).
- Look for a continuous rise in heap usage.
- Take a heap dump remotely (using
jmap) and analyze it offline to avoid impacting production performance. - Mention checking GC logs for frequent Full GCs with little memory reclaimed.
Conclusion
The JVM is not magic; it’s a complex, well-engineered system. Understanding its memory model, garbage collection, and debugging tools transforms you from a coder who writes Java into an engineer who masters Java.
Next time you see an OutOfMemoryError, don’t just restart. Take a heap dump, open MAT, and hunt down the leak. That’s where the real learning happens.
Did you find this guide helpful? Share it with your team or leave a comment with your favorite JVM debugging tip!
메타데이터
- post_id
- 5ec33992f6b0
- slug
- mastering-the-jvm-from-architecture-to-memory-leak-debugging-5ec33992f6b0
- url
- https://medium.com/@ananyarsingh/mastering-the-jvm-from-architecture-to-memory-leak-debugging-5ec33992f6b0
- canonical_url
- https://medium.com/@ananyarsingh/mastering-the-jvm-from-architecture-to-memory-leak-debugging-5ec33992f6b0
- author_url
- https://medium.com/@ananyarsingh
- status
- ok
- fetched_at
- 2026-07-19 11:18:54





