Common Pitfalls of Correlation Coefficient
In statistical analysis, we often use correlation (r) to decide how strongly two continuous variables are associated. However, when…
Common Pitfalls of Correlation Coefficient
In statistical analysis, we often use correlation (r) to decide how strongly two continuous variables are associated. However, when determining the association between two variables. It is better to plot it out than to calculate the correlation visually. Here’s why:
- Correlation only quantifies strength of linear relationships. If two variables are perfectly quadratically correlated, correlation could still be 0. Same pitfall for covariance matrix!!!
Solution: When in doubt, always plot out the variables! You can try non-linear dependence metrics such as RCOR (Spearman rank correlation)or DCOR (Distance Correlation) but no single metric is perfect for non-linear dependence so far. To find out why, check out examples in this article.
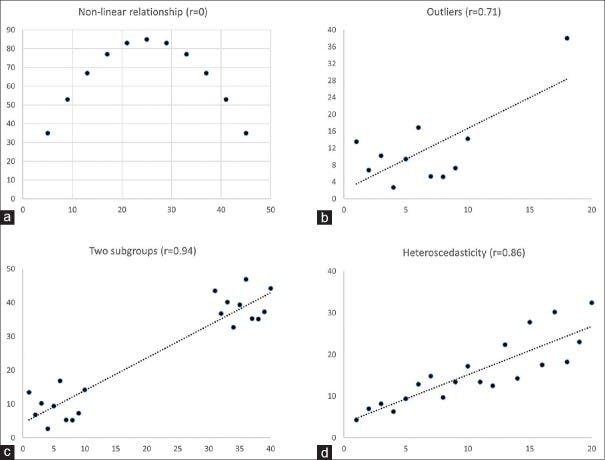
source: https://www.ncbi.nlm.nih.gov/pmc/articles/PMC5079093/
- Correlation assumes independence between observations within each variable. If observations within each variable are dependent, for example, time, it might confound with the effect of the other variable. Thus observations must be independent.
Solution: Stop using Pearson correlation. Check out auto-correlation which is the correlation of observations to its lagged version, and cross-correlation, which measures the similarity between two time series by comparing their respective lagged versions. Perform time-series analysis if necessary.

source: https://www.displayr.com/autocorrelation/
3. Correlation is heavily affected by outliers. As shown in the top right graph in the figure above, an otherwise unrelated pair of variables would have a strong positive correlation due to a single outlier. That is because correlation is calculated similarly to linear regression.
Solution: use Spearman’s Rank-Order Correlation if dependence is monotonic. Instead of using actual values, the metric uses rank which is robust to outliers (pro). However, it’s only good for linear trends (con).

Conclusion
When performing an analysis and determining dependence between variables, instead of using one metric such as the correlation coefficient, it is always a best practice to plot out the variables. Only where there are too many variables should you look at correlation coefficients or covariance matrix. But always be aware that both are only good for quantifying linear trends.
메타데이터
- post_id
- 5ec8e148c433
- slug
- common-pitfalls-of-correlation-5ec8e148c433
- url
- https://medium.com/@jiaop24/common-pitfalls-of-correlation-5ec8e148c433
- canonical_url
- https://medium.com/@jiaop24/common-pitfalls-of-correlation-5ec8e148c433
- author_url
- https://medium.com/@jiaop24
- status
- ok
- fetched_at
- 2026-06-29 01:02:39