Built To Scale [Pt.2]: Org Design & Value Streams — Defined + Mapping In Manufacturing
Whoa, title gore…but hang in with me.
Built To Scale [Pt.2]: Org Design & Value Streams — Defined + Mapping In Manufacturing
Whoa, title gore…but hang in with me.
The Built To Scale series is an attempt to examine how we can design an org to grow/optimize/whatever the definition of “scale” is to a given firm. In the broadest sense, a value stream is the order of activities needed to produce an end product or service, i.e., what a firm does and how it does it. It contains steps that can be readily identified to produce a widget, a piece of software, or a car. To scale, every step of the process must be understood and well-defined else you can’t design an organization to scale effectively.
The documentation of this process is called Value Stream Mapping (VSM) and there are many ways to tackle this endeavor with Six Sigma being one of the bigger brand names in terms of training/consulting. Still, I’m focusing on those VSM tactics/terms that are most widely adopted because they correlate to product management more closely than others.

Streams aspire to become rivers. Photo by Matthew Montrone: https://www.pexels.com/photo/landscape-photography-of-water-flowing-1272809/
[ED NOTE: What follows is a lengthy overview of the VSM process and this work is derived from the research my Master’s thesis partner Mallory Brooks and I conducted while co-authoring our paper “The Knowledge Work Revolution: Quantification and Beyond.” Many thanks to Mallory for supporting me in re-publishing this aspect and providing her experience therein. This series may touch on our paper, as an aside, but the paper itself is not for general consumption. This is a primer on Value Stream Mapping. If you are familiar with the process, skip this article. If you aren’t and really like long-form, proceed!]
Value Streams Flow From Value Stream Maps
Value Stream Mapping (VSM) is the business workflow endeavor of listing out all activities required in a manufacturing process or service to achieve a completed state from raw materials. The primary purpose of VSM is to identify each discrete action required in the process to fully understand the entire workflow to optimize productivity and quality. Value Stream maps are typically one-page diagrams visually representing the flow of work required from raw material to end product with each step broken out into a series of standardized measurements that can be readily identified by all parties involved. As such, Manos explains that the “[p]ictorial representations of VSM are easy ways to learn a language that anyone in your organization can understand — a key element when communicating with process maps” [1].
While the practice of mapping out manufacturing processes is not new and has been endeavored since the dawn of the industrial revolution, it is generally accepted that what we call VSM was originally devised by the Toyota Motor Corporation via their Operations Management division in Toyota City, Japan in the 1908s. Toyota referred to the practice as “material and information flow mapping” [2] and rose to prominence in the early 1990s as a point of evaluation for Toyota’s success in scaling and was soon adopted in different industries giving way to what has evolved to become the modern VSM practice which usually has the term “lean” attached to it.
According to Womack’s work “[a]ll value produced by an organization is the end result of a complex process, a series of actions that lean thinkers call a value stream. [3]”
Manos offers that the principal strategic thought driver behind VSM is that “[t]he value stream in VSM is the point at which value is actually added to the product or service…” (emphasis added) [1]. This value is added by materially changing functions in a measurable way to focus on aspects that add value. In manufacturing, these functions may fall in areas physically involved in an assembly line such the component building, welding, painting, etc. The exercise of evaluating the VSM focuses on the key concept that if you “…are not adding value, you are probably adding muda, (the Japanese word for waste)” [1].
With value as the primary driver in a VSM, the measurement of value is critical to evaluating process improvement and, all things being equal, the theory is that “[v]alue stream clarity equals competencies in measurement” according to Yasenchak [4]. Measurement is generally allocated to the realms of the effectiveness of each step (quality), efficiency (cost), and sustainability (people, equipment, or process).
VSMs, once created, behave as a “living document” in that they must often be revisited to evaluate against the prime directive of constant interactive improvement. As such, the creation of a VSM can be quite time-consuming when executed for the first time often starting with a several-day event typically referred to as the “kaizen event” (Japanese for “change for the better”). During the kaizen event, the team concentrates on the completion of four critical steps first and foremost [1]:
- Determine the process family
- Draw the current state map
- Determine and draw the future state map
- Draft a plan to arrive at the future state
Process Family
A firm’s process family — also referred to as a product group — “is a group of products or services that go through the same or similar processing steps” [1]. During this process, a matrix is created to expose elements that share attributes to identify where optimization may be possible. Typically, the process family exercise yields opportunities to have parts made by the same workstation for various uses or co-creation based on synergies in operation or, at the very least, efficiency gains in the station.
Of these opportunities realized, the team chooses which product family to focus on in the Current State mapping exercise based on the team’s (typical) goal of identifying the process family with the most potential for waste reduction and quality improvement, however, other factors may come into play such as the biggest bang for the buck, the largest reduction in lead time or inventory, the biggest impact to the customer, the highest probability for success, a process most visible to stakeholders, creating a new product line, and volume or quantity [1].
Current State Map
The current state mapping activity is to depict every process in the product family leaving no stone unturned. As such, it is necessary to understand where and how each process takes place via interviewing and observing workers via a process referred to as “gemba kaizen,” a combination of kaizen (change for the better) and “gemba” which is Japanese for “the actual place.” In practical terms, “the word gemba is widely used in manufacturing, where the gemba is the shop floor or the factory floor” [5]. The benefit of this approach is in the push to not define workflows away from where the “work” happens and, as a side effect, the VSM team will physically see the process end-to-run to garner a better understanding to look for waste and process improvements. Additionally, in interacting with those running the process, “[v]alue-adders-the people who actually perform the work (operators, assemblers, technicians, etc.) — can answer questions and clarify any misconceptions or preconceived notions on how tasks are performed” [1].
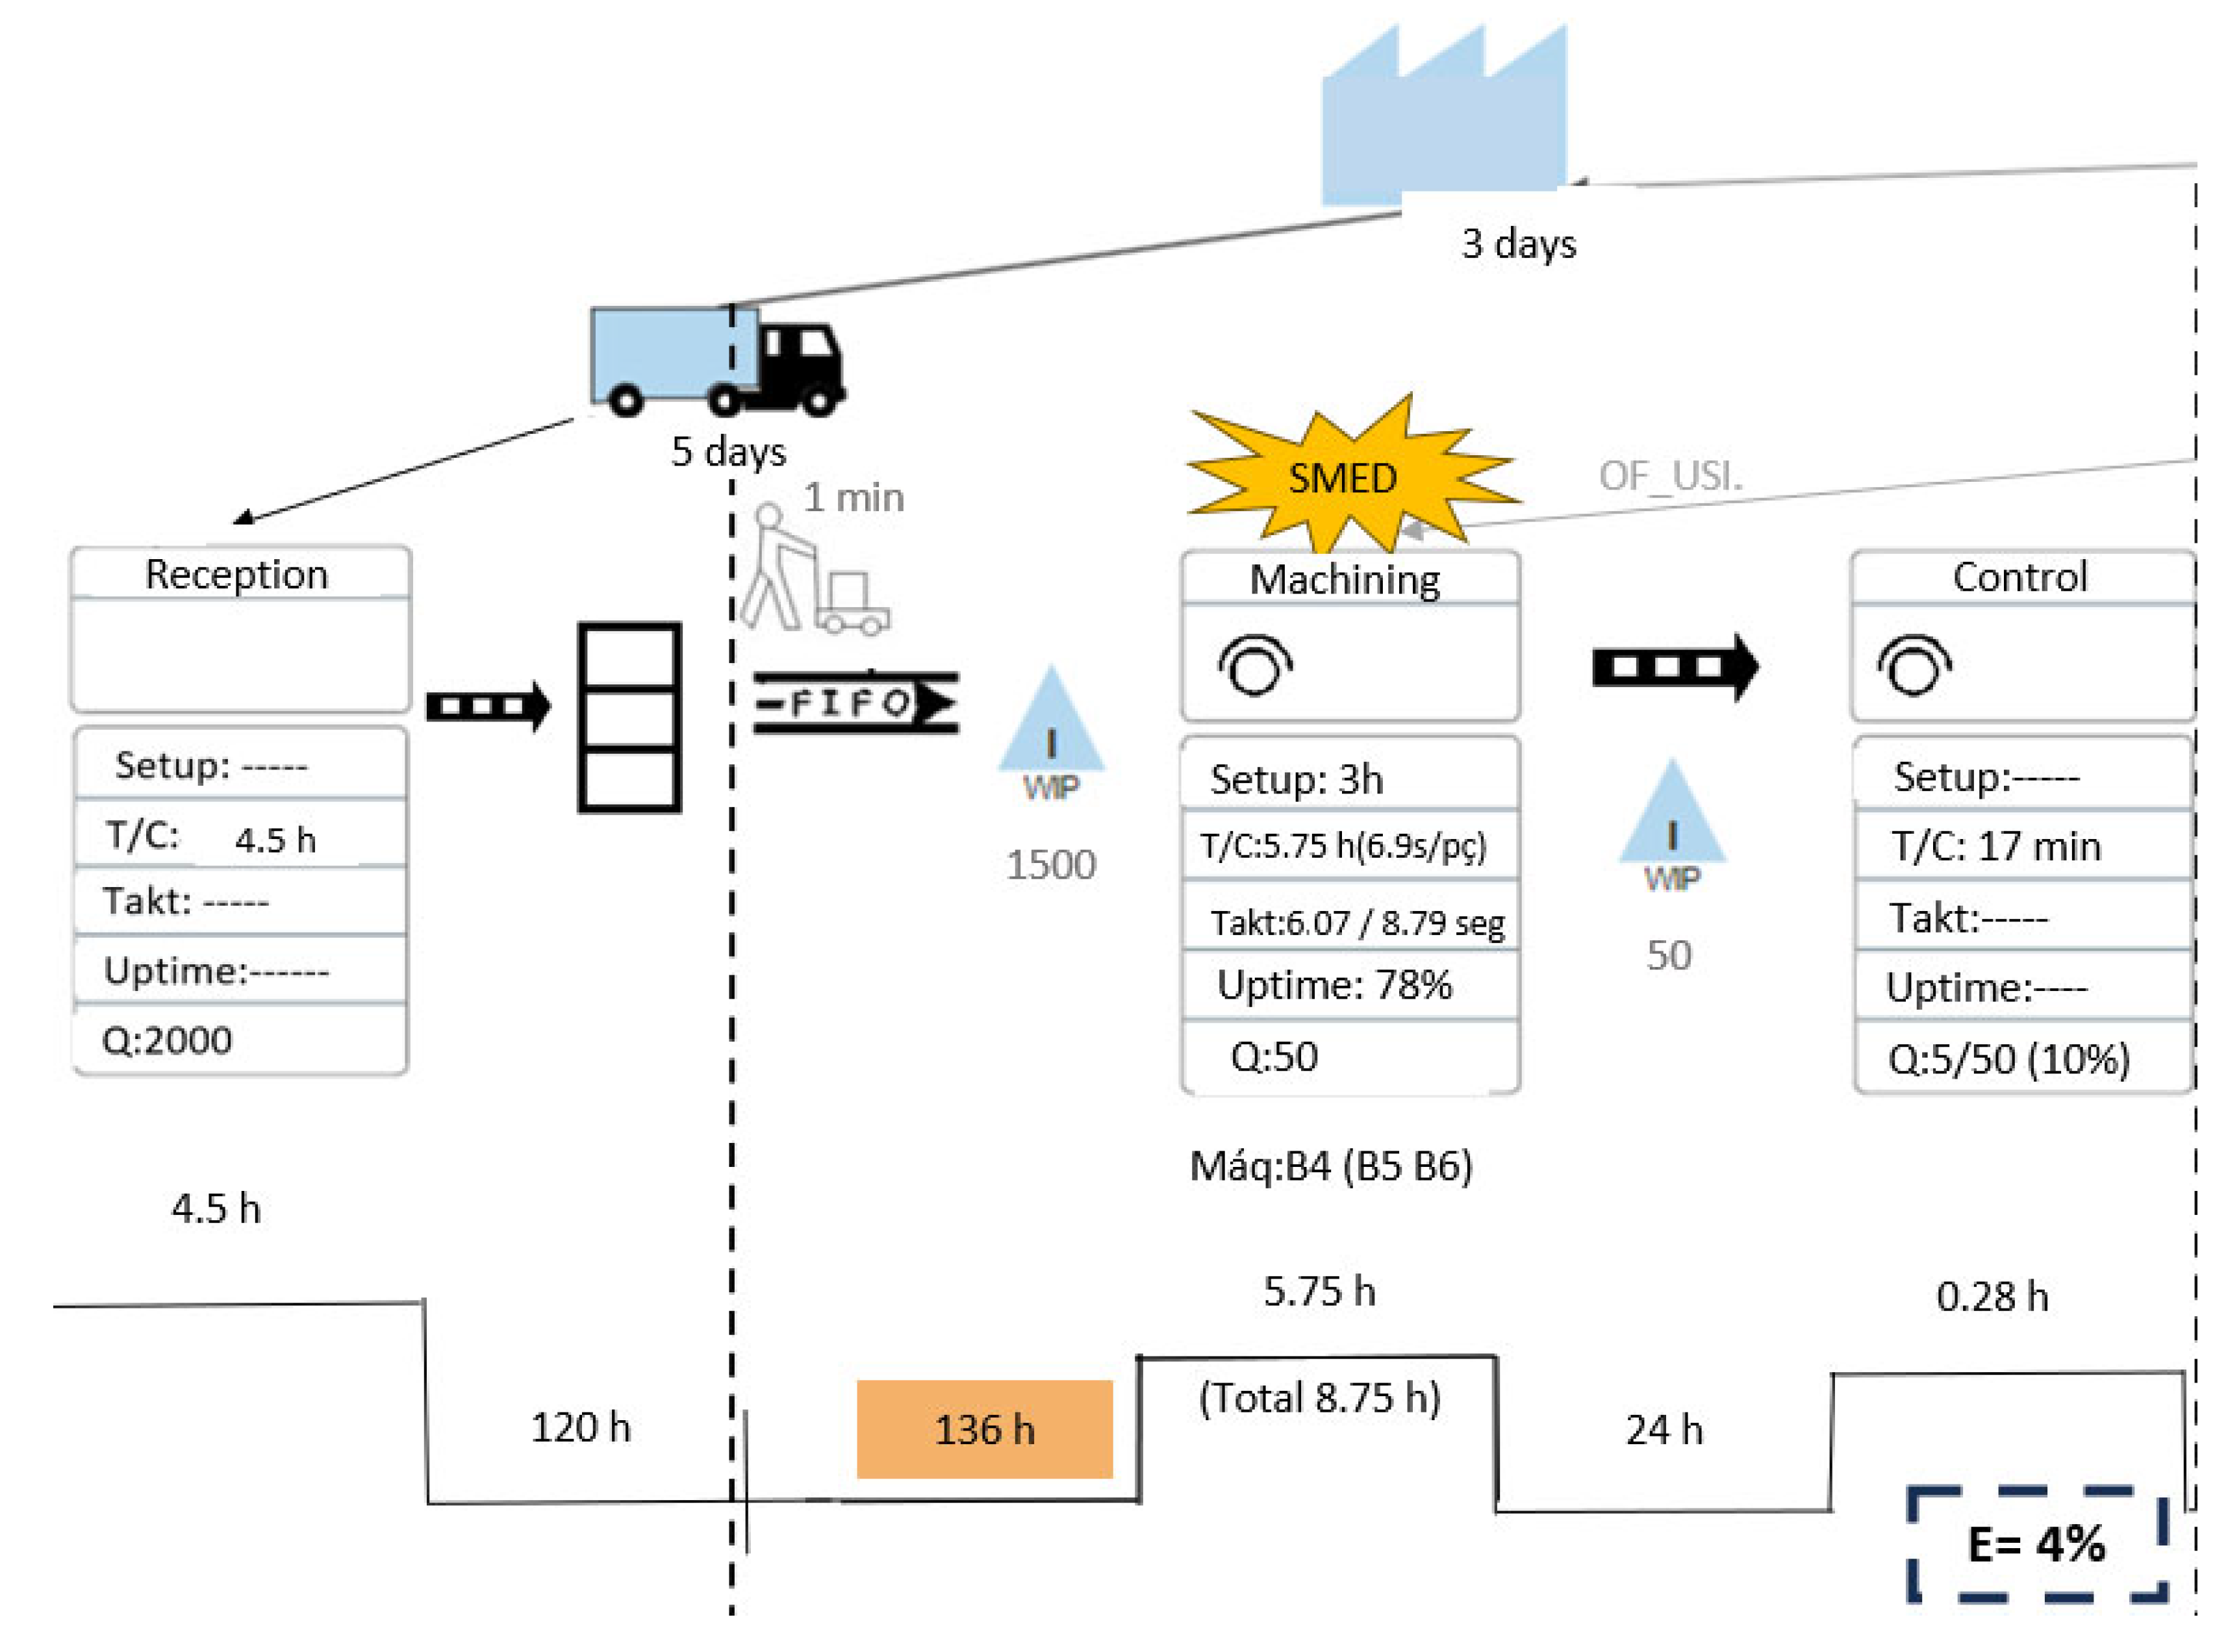
To build the Current State map, the team generally focuses on documenting the following most common aspects of the product family process for each station:
- Cycle time/processing time
- Changeover time/reset time
- Equipment uptime/reliability
- Station first pass yield (effectiveness)
- Quantities (output)
- Number of operators and shifts
- Hardcopy information and artifacts
- Electronic information and artifacts
- Inventory levels (station materials)
- Queue/wait/lead times

B. Costa, J. Varejão, and P. D. Gaspar, “Development of a Value Stream Map to Optimize the Production Process in a Luxury Metal Piece Manufacturing Company,” Processes, vol. 12, no. 10, p. 1612, 2024, Fig. 3. Available: https://www.mdpi.com/processes/processes-12-01612/article_deploy/html/images/processes-12-01612-g003.png.
[ED NOTE: the image above comes from this exceptional research paper offering a very deep dive into VSM: https://www.mdpi.com/2227-9717/12/8/1612]
Widely accepted formulas typically used in Current State mapping for manufacturing are as follows:
- Value-Added Time (VA): time spent adding value to a product or service. – Formula: VA = Total Processing Time — Non-Value-Added Time
- Non-Value-Added Time (NVA): amount of time spent on activities that do not directly add value. – Formula: NVA = Wait Time + Move Time + Inspection Time + Rework Time
- Lead Time (LT): total amount of time it takes to deliver a product or service from start to finish. – Formula: LT = Processing Time + Wait Time + Move Time + Inspection Time + Rework Time
- Cycle Time (CT): the time it takes to complete one unit of a product or service. – Formula: CT = Processing Time / Number of Units
- First Pass Yield (FPY): the percentage of units completed without any defects or rework. – Formula: FPY = (Number of Units Produced — Number of Defective Units) / Number of Units Produced
Data-wise, the goal for each aspect is to get as accurate information as possible at the time of inquiry. As such, quantification is not given the rigid tasks of baseline validation to the point of exhaustion, rather, data is taken on the surface level via hardcopy and electronic artifacts and interviews to establish a “best guess” effort. In this step, large gaps and deltas will become apparent enough to focus on in the Future State mapping exercise.
In terms of the physical VSM, “[t]he objective in drawing the map is to identify each significant action required to create the desired value. These are carefully written down, along with information about the performance of each action” [3]. As such, each step is typically viewed under the following headings to asses value with a ranking scale implemented by the team based on strategic imperatives [3]:
- Valuable (necessary)
- Capable (quality)
- Available (uptime)
- Adequate (demand)
- Flexible (multi-role)
![S. Kadambi, “Step 7 to making a current state value stream map: Map information,” Skilglobal, Fig. 3, [Online]. Available: https://www.skilglobal.com/step-7-to-making-a-current-state-value-stream-map-map-information/. [Accessed: 21-Oct-2024].](https://miro.medium.com/v2/resize:fit:924/1*6J5T-mi0_Kw708lYQgR-_Q.png)
S. Kadambi, “Step 7 to making a current state value stream map: Map information,” Skilglobal, Fig. 3, [Online]. Available: https://www.skilglobal.com/step-7-to-making-a-current-state-value-stream-map-map-information/. [Accessed: 21-Oct-2024].
The last step in the Current State mapping exercise is, typically, crafting a summary of the most critical aspect of the product family workflow to set the stage for improvements to identify in the Future State VSM. Product lead time is the most popular feature to focus on as it tends to be the best way to determine the effectiveness of the entire value stream, however, it is not the only area that can be the focus of process improvement. Issues such as material cost could be an element to optimize in totality, for instance.
Future State Map
Once the Current State map is complete, the team sets forth to create the Future State map with VSM exercise strategy imperative in mind. The most typical approach in creating the Future State map is to ensure that the new map addresses particular evaluation criteria that drive improvement in the process with the most widely used being [1]:
- Takt Time: Takt (German for an orchestra conductor’s baton) is a measurement of how frequently a part or component must be produced to meet your customers’ demand. The formula is the time available (per shift) divided by the demand (per shift). For example 22,000 seconds (time available) ÷ 200 pieces (demand) = 110 seconds/piece.
- Cycle Time Improvement: is it possible to increase the processing time of a step? If the cycle time is greater than Takt, a bottleneck most likely exists that must be addressed.
- Physical Inventory Reduction: can the amount of physical inventory be reduced via just-in-time systems and similar approaches and can artifacts be batch-processed to eliminate completion stops/starts?
- Flow Improvement: can the manner in which materials physically move be optimized?
- Other Improvement Factors: equipment reliability, first pass yield, quality levels, training, or even a new workstation layout.
Using the Current State map, the team draws “kaizen bursts” — the jagged idea clouds — to denote areas of improvement. The kaizen bursts are used to build the case items to focus on in the VSM optimization plan.
Future State Value Stream Map of Level (2–3) [6]
VSM Plan/Implementation
Once areas of improvement have been identified as the focus of the VSM exercise, an implementation plan is put into place. Depending on the length of the kaizen event, the planning may take place in person and onsite, however, it may take place after the initial VSM work is carried out. Using the data collected in the Current State aspect, baselines are identified and targets created to measure success or failure to impact the value stream according to a gated or time-boxed plan. The point of the plan is for all involved to have a visual representation of the process changes and where accountability falls for each component.
This plan to get to Future state has key objectives and looks a lot like OKRs. [Proposed value stream plan [7]]
Key Takeaway:
VSM is the process of identifying precisely where and when value is added to a manufacturing process or service and what accountability lies in each step. Additionally, VSM identifies the components that make up the value of a given component. While VSM as a practice was born of the desire to optimize manufacturing, VSM has applications in nearly any industry producing a product or service.
To scale (or optimize), you must understand every element comprising your current state to address your firm’s key objectives. This is intentional and requires a commitment to constantly iterate. No matter the state of the firm or the size, keeping a finger on the pulse of how the firm operates is central to the notion of Building To Scale.
Built To Scale series:
• Built To Scale [Pt. 1]: Org Design & Intentionality • Built To Scale [Pt.2]: Org Design & Value Streams — Defined + Mapping In Manufacturing • Built To Scale [Pt.3]: Org Design & Value Streams — Knowledge Work + Artifacts
[ED NOTE: References Accessed dates are from the original research paper work.]
References:
- T. Manos, “Value stream mapping-an introduction,” Quality Progress, vol. 06, pp. 64–69, 2006. Available: ProQuest. Accessed: Apr. 23, 2023.
- Atlassian, Value Stream Mapping. Available: https://www.atlassian.com/continuous-delivery/principles/value-stream-mapping. Accessed: Apr. 23, 2023.
- J. P. Womack, “Value stream mapping,” Manufacturing Engineering, vol. 136, no. 5, pp. 145, 146, 148, 150–156, 2006. Available: ProQuest. Accessed: Apr. 23, 2023.
- L. Yasenchak, “The value of value stream mapping,” MoldMaking Technology, pp. 54–55, Aug. 2016. Available: ProQuest. Accessed: Apr. 23, 2023.
- Gemba Walk. Available: https://gemba-walk.com/en/blog/article/what-is-gemba-kaizen/. Accessed: Apr. 23, 2023.
- N. Abeidi, A. Turkyilmaz, and O. Uysal, “A process improvement study in an emergency department using lean methodology,” 2018. Available: https://www.researchgate.net/figure/Future-State-Value-Stream-Map-of-Level-2-3_fig4_327602650. Accessed: Apr. 23. 2023.
- Value stream management for lean office — A case study — Scientific figure on ResearchGate. Available: https://www.researchgate.net/figure/Proposed-value-stream-plan_fig6_266483015. Accessed: Apr. 24, 2023.
메타데이터
- post_id
- 5f61df6ca4d9
- slug
- built-to-scale-pt-2-org-design-value-streams-defined-mapping-in-manufacturing-5f61df6ca4d9
- url
- https://medium.com/@ayukna/built-to-scale-pt-2-org-design-value-streams-defined-mapping-in-manufacturing-5f61df6ca4d9
- canonical_url
- https://medium.com/@ayukna/built-to-scale-pt-2-org-design-value-streams-defined-mapping-in-manufacturing-5f61df6ca4d9
- author_url
- https://medium.com/@ayukna
- status
- ok
- fetched_at
- 2026-06-10 22:22:12