Neural Networks for grayscale image classification
Neural networks (NNs) have a fundamental role in the development of machine learning solutions across diverse industries. They mimic the…
Neural Networks for grayscale image classification
Neural networks (NNs) have a fundamental role in the development of machine learning solutions across diverse industries. They mimic the complex processes of the human brain to identify patterns and make choices. For this article, various NN architectures were developed to categorize black-and-white images from the Fashion MNIST dataset. Each configuration was evaluated, and the results were contrasted. The solution was implemented with Python in a Jupyter Notebook, using Azure Machine Learning workspace.
Find the code for the solution here: ExOblivione/fashion-classification: Neural Networks for grayscale image classification (github.com)
Data Analysis
The dataset consists of 70,000 black-and-white images of clothing items, each measuring 28x28 pixels. These images serve as features, represented as 3D arrays, capturing the image count and pixel dimensions. The corresponding integer labels (ranging from 0 to 9) represent the target categories as a 1D array.

Example images for each label
The graph below shows the same number of examples for each label in the training dataset. Training on such an evenly distributed dataset results in a less biased model.

Distribution of labels
Feature visualisation
After reducing data dimensionality, the distinct or overlapping classes can be observed. Two algorithms were used to observe the data representation: Principal Component Analysis (PCA) and t-distributed stochastic neighbor embedding (t-SNE).
The first step is to reduce dimensionality of the images while preserving essential information with the use of PCA and t-SNE.
PCA
- identifies the most important axes along which the data varies the most
- computes the eigenvectors of the covariance matrix of the data, which represent the directions of maximum variance
t-SNE
- constructs a probability distribution over pairs of high-dimensional data points
- constructs a similar probability distribution over pairs of points in the low-dimensional space
- minimizes the divergence between these two distributions
By visualizing the reduced dimensionality data, it can be observed whether the different clothing categories form distinct clusters and whether there are overlapping classes.

High degree of resemblance between the pixel patterns of various clothing items
The different colors represent different clothing categories, which helps quickly identifying which examples belong to which category. By examining the clusters, the categories can be distinguished, or overlapping of distributions can be identified. The difference between the graphical representation comes from the fact that PCA preserves global structure, while t-SNE focuses on local neighborhoods.
The PCA visualization reveals patterns and relationships. Each point represents an example, similar items are clustered together. The principal components capture the most variance in the data. The t-SNE visualization reveals points that are close in the 2D space, which means that these are also likely to be close in the high-dimensional space.
Observations:
- Sneakers (label 7), ankle boots (label 9) and sandals (label 5) are very similar, the clusters are quite overlapping.
- Shirts (label 6), ankle boots (label 9), bags (label 8), and trousers (label 1) are easily distinguishable.
- Trousers (label 1) and dresses (label 3) are easily distinguishable from each other.
- Quite a similarity can be observed between T-Shirt/tops (label 0), pullovers (label 2), coats (label 3), and shirts (label 6).
Code for data analysis: fashion-classification/data_analysis.ipynb at main · ExOblivione/fashion-classification (github.com)
Model implementation
With comparative analysis, the effectiveness in class distinction is explored of various NN architectures. Instead of focusing only on dense layers, incorporation of convolutional layers enabled extraction of spatial features and patterns from image data. Connections are minimized compared to fully connected networks of equivalent neuron count which reduces the risk of overfitting and enhances the network’s performance in class distinction.

Architectures for comparing dense and convolutional neural networks
As loss function in each architecture the binary cross-entropy function was used. It compares the predicted probabilities with the actual distribution. The decision whether to continue the implementation with dense or convolutional NN was based on the models’ train and test accuracy and loss.

Conv2D layers perform better on image data than Dense layers
Code for the fully connected and convolutional architectures: fashion-classification/dense_vs_conv.ipynb at main · ExOblivione/fashion-classification (github.com)
Three convolutional network architectures have been observed, one was configured with sigmoid (cnn1), the other two with Rectified Linear Unit (ReLU) as activation functions (cnn2 and cnn3). ReLU is a preferred choice for image classification, as it allows the model to learn complex patterns, it also showed better performance. All three architectures used Stochastic Gradient Descent (SGD) as optimizer. The model with ReLU activation function was then enhanced with Dropout regularization to prevent overfitting, which allowed the model to generalize better (cnn3).
Enhance and evaluate model performance
Based on the analysis performed in the previous section, the cnn3 model was chosen for further enhancement. The following models (cnn4 and cnn5) use convolutional layers to extract features from the images similarly as the cnn3, but they are enhanced with max pooling to reduce the spatial dimensions, and batch normalization to normalize the inputs within each batch. The difference between the architecture of cnn4 and cnn5 is that cnn4 is compiled with SGD optimizer, while cnn5 used the ADAM optimizer, which is an adaptive learning rate optimizer.
Code for enhanced models with evaluation: fashion-classification/enhance_eval.ipynb at main · ExOblivione/fashion-classification (github.com)
Learning curves (training and validation loss/accuracy) and confusion matrices are plotted after training to monitor model performance over epochs.

Train and validation accuracy and loss for model cnn4 and cnn5
The best fitting model architecture for classifying images in the Fashion MNIST dataset with the highest accuracy was the cnn5, the one with the lowest risk of overfitting was the cnn4. Using ADAM increases accuracy, but shows higher risk of overfitting than models configured with SGD.
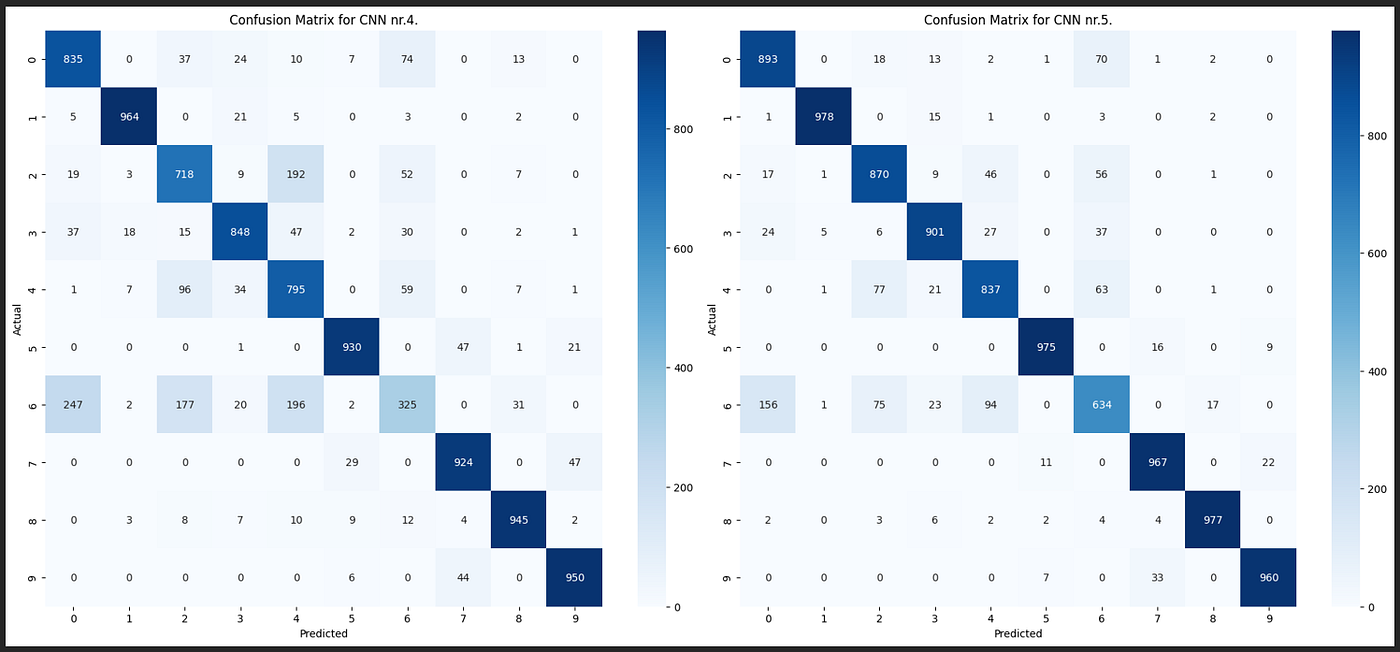
Confusion matrices for cnn4 and cnn5
As it is depicted by the confusion matrices, we can see less failed predictions in the case of cnn5 than of cnn4, which results can be originated from the choice of optimizer during compiling the model. Another observation that can be made is that the highest number of misclassification in case of both models is as expected during feature analysis.

After observing the confusion matrices, the above conclusion can be made
The t-SNE visualization and the observations made while analyzing the confusion matrices, the behavior of the models is as expected. Both cnn4 and cnn5 misclassified Sneakers (label 7) with Ankle boots (label 9), and T-Shirt/tops (label 0), pullovers (label 2), and coats (label 3) with shirts (label 6).
Future tasks
The models can be further optimized by further aligning hyperparameters, such as the dropout rate. The feature map or activation map allows understanding the important parts of the images. This information helps understanding which parts of the image contribute most to the predictions, or in other words, explain the model’s decision-making process.

Filter map of cnn4, conv2d_8 layer
The filters above are applied on the images during training. This helps the model to learn more of the slightly manipulated features (more contrast, highlights, etc.).

Filters are applied on an example image
The activation map highlights the regions of the input image that are most relevant for the chosen layer’s feature extraction.

Importance levels on the same image on different layers of cnn4
The early stopping mechanism could increase the chance of achieving convergence on non-linearly separable data.
Try out my code on GitHub, and let me know when you managed to achieve better scores! :)
메타데이터
- post_id
- 618adaf2af7f
- slug
- neural-networks-for-grayscale-image-classification-618adaf2af7f
- url
- https://medium.com/@evepardi/neural-networks-for-grayscale-image-classification-618adaf2af7f
- canonical_url
- https://medium.com/@evepardi/neural-networks-for-grayscale-image-classification-618adaf2af7f
- author_url
- https://medium.com/@evepardi
- status
- ok
- fetched_at
- 2026-06-20 20:29:01