Generational ZGC in Java 21 Explained
How It Works, Why It Matters, and How It Compares with G1GC and Classic ZGC
Generational ZGC in Java 21 Explained
How It Works, Why It Matters, and How It Compares with G1GC and Classic ZGC
Generational ZGC: Java 21’s GC Game Changer
TL;DR: The Executive Summary
If you are running latency-sensitive applications on Java 21+, the data is clear: Generational ZGC is the new standard.
In our “Flash Sale” stress test, we compared Generational ZGC against G1GC and the original (non-generational) ZGC.
The results were stark:
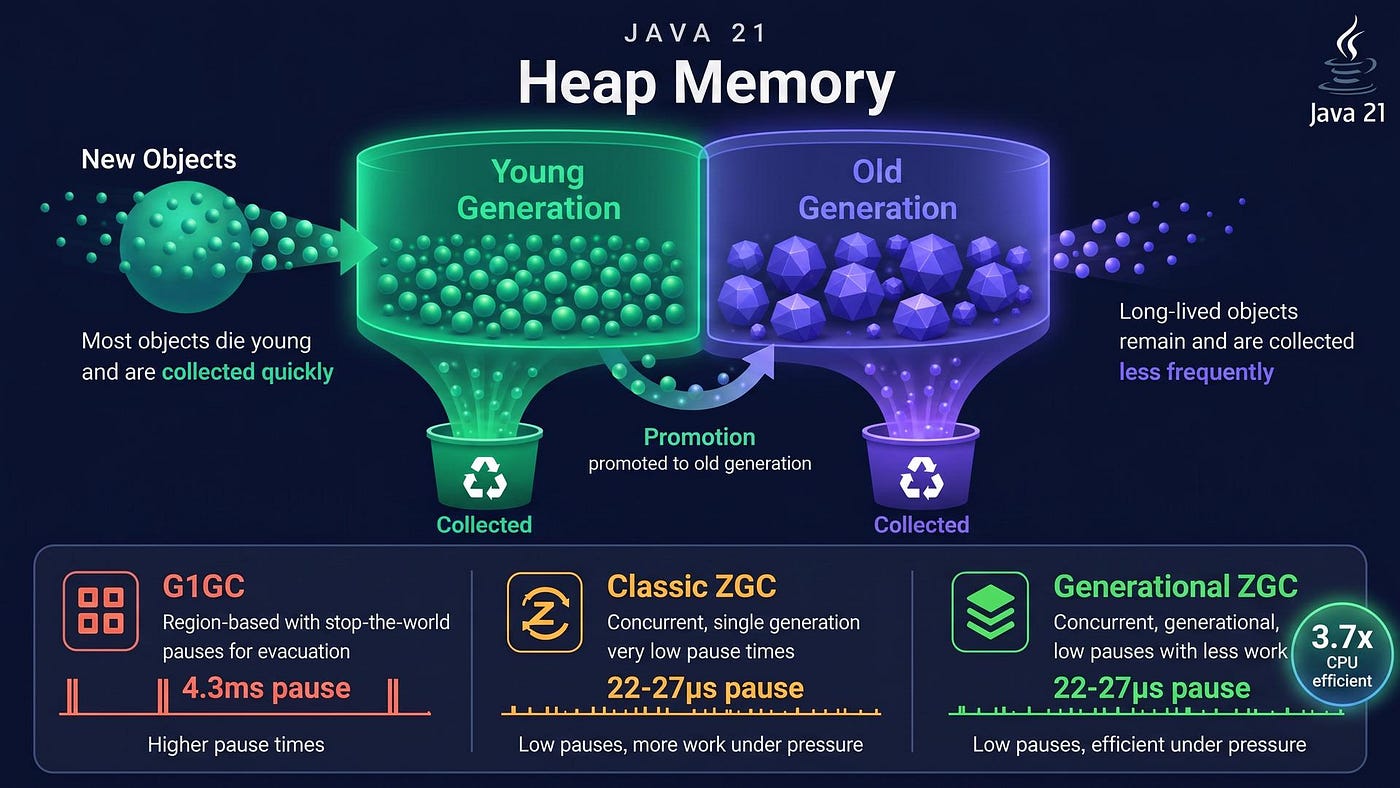
- Latency: Generational ZGC delivered 22–27µs pause times (vs 4.3ms for G1GC).
- Efficiency: Under normal load, it was 3.7x more CPU-efficient than non-generational ZGC.
- Resilience: Under extreme memory pressure (512MB heap), it reduced application stalls by 17.8x compared to non-generational ZGC.
Recommendation: Use -XX:+UseZGC -XX:+ZGenerational for web APIs, microservices, and real-time systems.
Java provides several garbage collectors because applications do not all have the same performance requirements. G1GC balances throughput and predictable pauses for general-purpose workloads, while ZGC performs most collection work concurrently to keep stop-the-world pauses extremely small.
Java 21 introduced Generational ZGC, which retains ZGC’s low-latency design while separating short-lived and long-lived objects.
From ZGC to Generational ZGC
Classic ZGC uses a single-generation heap: short-lived and long-lived objects are handled within the same generation.
Generational ZGC applies the generational hypothesis — the observation that most objects become unreachable soon after allocation. It divides the heap logically into:
- Young generation: newly allocated objects, collected frequently.
- Old generation: objects that survive young collections, collected less frequently.
This allows frequent collections to concentrate on the part of the heap where most garbage is created.
Why the Generational Design Matters
G1GC reclaims memory through evacuation work that includes stop-the-world phases. ZGC performs most of its work concurrently, keeping those pauses much shorter.
Generational ZGC adds another advantage: frequent collections can focus on recently allocated objects instead of processing long-lived objects with the same frequency. Under allocation pressure, this can reduce collection work and help memory become available sooner.
Allocation Stalls and Enabling Generational ZGC
An allocation stall occurs when an application thread needs to create an object but sufficient memory is not yet available. The thread must wait for the collector to reclaim space. This is different from a normal GC pause and becomes important in the 512MB experiment later in the article.
Enable Generational ZGC in Java 21 with:
-XX:+UseZGC -XX:+ZGenerationalEnable basic GC logging with:
-Xlog:gcHands-On Demo: G1GC vs ZGC vs Generational ZGC
Flash Sale Memory Stress Test
To make the differences visible, we’ll use a realistic flash-sale workload that closely resembles what happens in high-traffic retail systems.
The application has two distinct memory patterns:
1. Long-Lived Objects (Old Generation Pressure)
A static Product Catalog is loaded once at application startup and kept in memory for the entire runtime.
private static final List<Product> PRODUCT_CATALOG = new ArrayList<>();This catalog represents product metadata in a retail system, such as:
- Product IDs
- SKUs
- Static attributes
- Preloaded product information
In real-world applications, similar long-lived objects typically come from:
- In-memory caches
- Reference or lookup data loaded at startup
In this demo, all of these concepts are represented by the same Product objects.
They:
- Are created only once
- Remain strongly reachable
- Quickly promote to the Old Generation
- Are never reclaimed
2. Short-Lived Objects (Young Generation Pressure)
During the main workload phase, the application continuously creates Order objects.
Order order = new Order(ORDER_METADATA_SIZE);Each order:
- Allocates metadata
- Creates an internal
ArrayList - References multiple products from the catalog
- Becomes unreachable almost immediately after creation
These objects:
- Live for milliseconds
- Are ideal candidates for Young Generation collection
- Generate sustained allocation pressure
This closely models real-world scenarios such as:
- Checkout requests
- Shopping cart updates
- Session-scoped request objects
The Code
Here is the core logic of the simulation. Notice how we strictly separate the long-lived PRODUCT_CATALOG from the high-churn generateTraffic() method.
package org.example.concepts.zgc;

import java.util.ArrayList;
import java.util.List;
import java.util.Random;
import java.util.concurrent.atomic.AtomicLong;

public class RetailMemoryStress {

    // 1. Long-Lived Data (Old Generation)
    private static final int PRODUCT_CATALOG_COUNT = 400_000;
    private static final List<Product> PRODUCT_CATALOG = new ArrayList<>();

    // 2. Workload Configuration
    private static final int ORDERS_PER_ITERATION = 1;
    private static final int ITEMS_PER_ORDER = 50;

    public static void main(String[] args) {
        // Load the catalog (simulate cache warmup)
        for (int i = 0; i < PRODUCT_CATALOG_COUNT; i++) {
            PRODUCT_CATALOG.add(new Product(i, "SKU-" + i, new byte[512]));
        }

        // Start Worker Threads (simulate customers)
        int threads = Runtime.getRuntime().availableProcessors();
        for (int i = 0; i < threads; i++) {
            new Thread(RetailMemoryStress::generateTraffic, "Worker-" + i).start();
        }
    }

    private static void generateTraffic() {
        Random random = new Random();
        while (true) {
            // High Churn Allocation (Young Generation)
            for (int burst = 0; burst < ORDERS_PER_ITERATION; burst++) {
                Order order = new Order();
                for (int i = 0; i < ITEMS_PER_ORDER; i++) {
                    Product p = PRODUCT_CATALOG.get(random.nextInt(PRODUCT_CATALOG.size()));
                    order.addItem(p);
                }
                // Order goes out of scope immediately -> Garbage
            }
        }
    }

    record Product(int id, String sku, byte[] payload) {}

    static class Order {
        List<Product> items = new ArrayList<>();
        void addItem(Product p) { items.add(p); }
    }
}
Why This Workload is Realistic
The workload creates a clear generational boundary:
- Old Generation → Stable product metadata (the catalog)
- Young Generation → Burst-heavy transactional objects (the orders)
The Static Catalog (Old Gen): The PRODUCT_CATALOG list holds 400,000 products that consume approximately 250MB of heap space. These objects are created once and never removed. They represent the kind of cached data you'd find in real production systems.
The Traffic Loop (Young Gen): The generateTraffic method runs in an infinite loop across multiple threads. It creates Order objects at a blistering pace—each order references 50 products, gets used for a few microseconds, then becomes garbage. This mimics the allocation pattern of a high-traffic web application handling thousands of requests per second.
Collectors that exploit this generational separation handle the workload far more efficiently. This is exactly where we’ll see Generational ZGC shine.
Experiment 1: Comfortable Memory (1GB Heap)
Let’s start our first test with 1GB of heap memory. With our 400K product catalog consuming roughly 250MB, this gives us plenty of breathing room — about 750MB free for the high-churn order allocations. This represents a well-provisioned production environment.
Running the Tests
I ran the same workload three times, once with each garbage collector. Each test captures both detailed GC logs (for text analysis) and JFR recordings (for visual analysis in JDK Mission Control).
Preparation:
First, create directories for storing GC logs and JFR recordings:
Linux/Mac:
mkdir -p logs jfrWindows (Command Prompt):
mkdir logs
mkdir jfr
Why create these directories?
logs/— Stores detailed GC log files for post-run text analysisjfr/— Stores Java Flight Recorder (JFR) recordings for visual analysis in JDK Mission Control- The
-pflag in Linux/Mac creates parent directories if needed and doesn't error if directories already exist - Note: The application creates these automatically, but creating them manually ensures they exist before the first run
G1GC (1GB with GC Logs + JFR):
Linux/Mac:
java -cp target/classes \
  -Xmx1G -Xms1G \
  -XX:+UseG1GC \
  -Xlog:gc*:file=logs/g1gc-1g.log:time,level,tags \
  -XX:StartFlightRecording=duration=60s,filename=jfr/g1gc-1g.jfr \
  org.example.concepts.zgc.RetailMemoryStress
Windows (Command Prompt):
java -cp target/classes ^
  -Xmx1G -Xms1G ^
  -XX:+UseG1GC ^
  -Xlog:gc*:file=logs/g1gc-1g.log:time,level,tags ^
  -XX:StartFlightRecording=duration=60s,filename=jfr/g1gc-1g.jfr ^
  org.example.concepts.zgc.RetailMemoryStress
ZGC (1GB with GC Logs + JFR):
Linux/Mac:
java -cp target/classes \
  -Xmx1G -Xms1G \
  -XX:+UseZGC -XX:-ZGenerational \
  -Xlog:gc*:file=logs/zgc-1g.log:time,level,tags \
  -XX:StartFlightRecording=duration=60s,filename=jfr/zgc-1g.jfr \
  org.example.concepts.zgc.RetailMemoryStress
Windows (Command Prompt):
java -cp target/classes ^
  -Xmx1G -Xms1G ^
  -XX:+UseZGC -XX:-ZGenerational ^
  -Xlog:gc*:file=logs/zgc-1g.log:time,level,tags ^
  -XX:StartFlightRecording=duration=60s,filename=jfr/zgc-1g.jfr ^
  org.example.concepts.zgc.RetailMemoryStress
Generational ZGC (1GB with GC Logs + JFR):
Linux/Mac:
java -cp target/classes \
  -Xmx1G -Xms1G \
  -XX:+UseZGC -XX:+ZGenerational \
  -Xlog:gc*:file=logs/generational-zgc-1g.log:time,level,tags \
  -XX:StartFlightRecording=duration=60s,filename=jfr/generational-zgc-1g.jfr \
  org.example.concepts.zgc.RetailMemoryStress
Windows (Command Prompt):
java -cp target/classes ^
  -Xmx1G -Xms1G ^
  -XX:+UseZGC -XX:+ZGenerational ^
  -Xlog:gc*:file=logs/generational-zgc-1g.log:time,level,tags ^
  -XX:StartFlightRecording=duration=60s,filename=jfr/generational-zgc-1g.jfr ^
  org.example.concepts.zgc.RetailMemoryStress
Each test ran for approximately 60 seconds under full load, then terminated with Ctrl+C. This generates two outputs per run:
- Text logs in
logs/directory for detailed GC event analysis - JFR recordings in
jfr/directory for visual analysis
The Results
After running all three tests, open the JFR recordings in JDK Mission Control.
Navigate to Garbage Collections → GC Summary in the left panel to see the complete GC statistics.
The Results: JFR Analysis
Here’s what JDK Mission Control revealed about each garbage collector’s performance:
1. G1GC Performance

G1GC at 1GB: 107 young collections, no Full GCs, but pauses averaging 4.3ms and spiking to 18.6ms.
Key Metrics from JFR:

What the G1GC Log Shows:
Looking at specific GC events from g1gc-1g.log:
[info][gc] GC(0) Pause Young (Normal) (G1 Evacuation Pause) 51M->30M(1024M) 20.812ms
[info][gc] GC(1) Pause Young (Normal) (G1 Evacuation Pause) 75M->76M(1024M) 15.613ms
[info][gc] GC(135) Pause Young (Normal) (G1 Evacuation Pause) 865M->252M(1024M) 2.979ms
Analysis:
G1GC performed 107 Young Generation collections over 60 seconds, with zero Full GC events — a good sign that it never ran out of memory. The pauses averaged 4.3ms but spiked to 18.6ms at their worst.
The key observation: G1GC uses stop-the-world pauses for evacuation. During these pauses, all application threads are frozen. For a typical web application, 4–18ms pauses are acceptable, but for ultra-low-latency systems (trading, gaming, real-time bidding), these pauses are problematic.
2. Non-Generational ZGC Performance

Classic ZGC at 1GB: pauses drop to ~59µs, but 38.3s of total GC time shows the cost of re-scanning the full heap.
Key Metrics from JFR:

What the ZGC Log Shows:
Looking at specific GC cycles from zgc-1g.log:
[info][gc] GC(0) Garbage Collection (Warmup) 190M(19%)->312M(30%)
[info][gc,phases] GC(0) Pause Mark Start 0.019ms
[info][gc,phases] GC(0) Concurrent Mark 113.974ms
[info][gc,phases] GC(0) Pause Mark End 0.104ms
[info][gc,phases] GC(0) Concurrent Relocate 6.628ms
[info][gc,mmu] GC(0) MMU: 2ms/94.8%, 5ms/97.9%, 10ms/99.0%
Analysis:
Non-generational ZGC achieves stunning 59 microsecond average pause times — that’s about 73x faster than G1GC’s 4.3ms. The application threads are essentially never frozen from the user’s perspective.
However, notice the high “Average GC Time” (216ms) and “Total GC Time” (38 seconds). This is the total time ZGC spends working, not pause time. ZGC does almost all its work concurrently, so the application keeps running, but ZGC consumes significant CPU cycles.
The MMU (Minimum Mutator Utilization) line is important: It shows that over any 2ms window, the application (mutator) had 94.8% of the time to execute. Over 10ms windows, it had 99% uptime. This confirms ZGC’s ultra-low latency promise.
What about allocation stalls? With 1GB heap, there were zero allocation stalls during steady-state operation. The concurrent collection kept pace perfectly with the allocation rate.
3. Generational ZGC Performance

Generational ZGC at 1GB: the smallest pauses (~27.5µs) and a third of the CPU cost — 10.4s vs 38.3s.
Key Metrics from JFR:

What the Generational ZGC Log Shows:
Looking at specific cycles from generational-zgc-1g.log:
[info][gc] GC(0) Major Collection (Warmup)
[info][gc,phases] GC(0) Y: Young Generation
[info][gc,phases] GC(0) Y: Pause Mark Start (Major) 0.034ms
[info][gc,phases] GC(0) Y: Concurrent Mark 22.239ms
[info][gc,phases] GC(0) Y: Pause Mark End 0.029ms
[info][gc,reloc] GC(0) Y: Using tenuring threshold: 1 (Computed)
[info][gc,alloc] GC(0) Y: Allocation Stalls: 0
Analysis:
Generational ZGC delivers the best of both worlds:
- Even lower pause times: 27.5 microseconds average — twice as fast as non-generational ZGC’s 59µs
- Dramatically lower CPU overhead: Only 10.4 seconds of total GC time vs. 38.3 seconds for non-generational ZGC
- Zero allocation stalls: Perfect allocation throughput under load
Why is it so much more efficient?
The log reveals the answer: Y: Young Generation. Generational ZGC focuses its frequent collections on the Young Generation where the short-lived Order objects are created and discarded. It scans the 400K product catalog (Old Generation) far less frequently.
This targeted approach means:
- Less CPU time scanning long-lived objects
- Faster collection cycles
- Lower overall system overhead
Side-by-Side Comparison

What These Numbers Really Mean
Pause Time = Application Freeze
When G1GC pauses for 18.6ms, every single request in flight is frozen. No database queries complete. No HTTP responses are sent. No orders are processed. For 18.6 milliseconds, your application appears dead to the outside world.
ZGC’s sub-millisecond pauses are essentially imperceptible. At 0.027ms (27 microseconds), users cannot detect any hiccup.
Total GC CPU Time = Background Cost
This is the total CPU time the GC consumes doing its work. Think of it as the “tax” your application pays for automatic memory management.
- G1GC: 461ms total (low because it does simple stop-the-world cleanup)
- Non-Gen ZGC: 38,312ms (high because it scans all 400K objects repeatedly)
- Gen ZGC: 10,431ms (3.7x more efficient than non-generational ZGC!)
Why Generational ZGC Wins:
Generational ZGC combines:
- Ultra-low latency (best pause times)
- High efficiency (lowest CPU overhead among ZGC variants)
- Zero stalls (perfect allocation throughput)
It achieves this by exploiting the generational hypothesis: most objects die young. Instead of repeatedly scanning the 400K static products, it focuses on the continuously churning Order objects.
The Key Insight from 1GB Results
With 1GB of heap (comfortable memory), all three collectors succeed:
- G1GC: Reliable, proven, but pauses are 73–150x longer than ZGC variants
- Non-Generational ZGC: Ultra-low latency but consumes 3.7x more CPU than Generational ZGC
- Generational ZGC: Best pause times AND lowest CPU overhead
If you’re building a latency-sensitive application, Generational ZGC is the clear winner. It delivers sub-millisecond pauses while being more CPU-efficient than non-generational ZGC.
But here’s the critical question: What happens when memory gets tight?
Production systems don’t always have comfortable headroom. Traffic spikes happen. Memory leaks occur. Users deploy memory-hungry features. What happens when that 1GB heap shrinks to 512MB — leaving only 250MB of free space for the high-churn allocation?
That’s where the real test begins, and the differences become dramatic.
Experiment 2: Extreme Memory Pressure (512MB Heap)
Now let’s see what happens when we cut the heap in half. With only 512MB total memory and our 400K product catalog consuming ~250MB, we’re left with just 262MB of free space for the high-churn order allocations. This represents a production system under severe memory pressure — the kind of scenario you face during traffic spikes, after a memory leak, or when running on cost-optimized infrastructure.
Running the 512MB Tests
Use the exact same commands as the 1GB tests, but change -Xmx1G -Xms1G to -Xmx512M -Xms512M:
G1GC (512MB):
Linux/Mac:
java -cp target/classes \
  -Xmx512M -Xms512M \
  -XX:+UseG1GC \
  -Xlog:gc*:file=logs/g1gc-512m.log:time,level,tags \
  -XX:StartFlightRecording=duration=60s,filename=jfr/g1gc-512m.jfr \
  org.example.concepts.zgc.RetailMemoryStress
Windows (Command Prompt):
java -cp target/classes ^
  -Xmx512M -Xms512M ^
  -XX:+UseG1GC ^
  -Xlog:gc*:file=logs/g1gc-512m.log:time,level,tags ^
  -XX:StartFlightRecording=duration=60s,filename=jfr/g1gc-512m.jfr ^
  org.example.concepts.zgc.RetailMemoryStress
Non-Generational ZGC (512MB):
Linux/Mac:
java -cp target/classes \
  -Xmx512M -Xms512M \
  -XX:+UseZGC -XX:-ZGenerational \
  -Xlog:gc*:file=logs/zgc-512m.log:time,level,tags \
  -XX:StartFlightRecording=duration=60s,filename=jfr/zgc-512m.jfr \
  org.example.concepts.zgc.RetailMemoryStress
Windows (Command Prompt):
java -cp target/classes ^
  -Xmx512M -Xms512M ^
  -XX:+UseZGC -XX:-ZGenerational ^
  -Xlog:gc*:file=logs/zgc-512m.log:time,level,tags ^
  -XX:StartFlightRecording=duration=60s,filename=jfr/zgc-512m.jfr ^
  org.example.concepts.zgc.RetailMemoryStress
Generational ZGC (512MB):
Linux/Mac:
java -cp target/classes \
  -Xmx512M -Xms512M \
  -XX:+UseZGC -XX:+ZGenerational \
  -Xlog:gc*:file=logs/generational-zgc-512m.log:time,level,tags \
  -XX:StartFlightRecording=duration=60s,filename=jfr/generational-zgc-512m.jfr \
  org.example.concepts.zgc.RetailMemoryStress
Windows (Command Prompt):
java -cp target/classes ^
  -Xmx512M -Xms512M ^
  -XX:+UseZGC -XX:+ZGenerational ^
  -Xlog:gc*:file=logs/generational-zgc-512m.log:time,level,tags ^
  -XX:StartFlightRecording=duration=60s,filename=jfr/generational-zgc-512m.jfr ^
  org.example.concepts.zgc.RetailMemoryStress
The Results: When Memory Gets Tight
Here’s what happens when these collectors face extreme memory pressure:
1. G1GC: Struggles but Survives

G1GC under pressure: 122 Full GCs it never needed at 1GB, each freezing the app for 150–266ms.
Key Metrics from JFR:

What Happened:
G1GC performed 122 Old Generation (Full GC) collections — something it never needed at 1GB. Each Old Gen collection averaged 155ms and peaked at 266ms. These are expensive stop-the-world pauses where G1GC had to scan and compact the entire heap.
Despite the pressure, G1GC handled it. The average pause time actually decreased slightly (2.18ms vs 4.3ms at 1GB) because Young Gen collections became faster with less free space. However, those 122 Full GC events show the strain.
From the log (g1gc-512m.log):
[info][gc] GC(50) Pause Young (Normal) (G1 Evacuation Pause) 287M->243M(512M) 3.211ms
[info][gc] GC(150) Pause Full (G1 Compaction Pause) 450M->180M(512M) 155.323ms
[info][gc] GC(250) Pause Full (G1 Compaction Pause) 470M->190M(512M) 163.891ms
Notice the Full GC events compacting the heap to recover space. G1GC works, but the 122 Full GCs represent significant overhead.
2. Non-Generational ZGC: Complete Breakdown

Classic ZGC at 512MB — the summary looks calm until you open the Event Browser.
Key Metrics from JFR:

The Disaster Revealed: Allocation Stalls
Now let’s look at the Event Browser in JMC, which shows what’s really happening:

The breakdown: ~2,357 allocation stalls, ~39/sec, 30–80ms each — threads constantly blocked waiting for memory.
The Event Browser shows 2,112 ZGC Allocation Stall events. These are moments when application threads tried to allocate memory but had to block and wait because ZGC couldn’t keep up with the allocation rate.
From the log (zgc-512m.log):
[info][gc] Allocation Stall (Worker-0) 33.724ms
[info][gc] Allocation Stall (Worker-2) 43.512ms
[info][gc] Allocation Stall (Worker-5) 79.834ms
[info][gc] Allocation Stall (Worker-1) 81.623ms
[info][gc] Allocation Stall (Worker-7) 42.445ms
Sampling the log shows stall durations ranging from 30ms to 80ms, with many threads stalling simultaneously.
Why This Happens:
As explained earlier,Non-generational ZGC scans the entire heap on every GC cycle — including all 400K static product objects. With only 262MB of free space and rapid allocation, ZGC falls behind. The concurrent collector cannot free memory fast enough, forcing application threads to stall and wait.
This is the architectural flaw: treating all objects equally means wasting CPU cycles repeatedly scanning objects that will never be collected.
The Application’s Experience:
- 2,357 allocation stalls over 60 seconds ≈ 39 stalls per second
- Average stall duration: ~56ms
- During stalls, threads are completely blocked — no orders processed, no requests served
- The application appears to “hiccup” constantly under load
3. Generational ZGC: Handles Pressure Gracefully

Generational ZGC at 512MB: same pressure, far steadier behavior.
Key Metrics from JFR

Allocation Stalls in JMC:

JMC Event Browser showing far fewer ZGC Allocation Stall events on a 512MB heap, stalls of 2–12ms.
The Event Browser shows 711 ZGC Allocation Stall events — much better than non-generational ZGC’s 2,112 events.
From the log (generational-zgc-512m.log):
[info][gc] Allocation Stall (Worker-3) 2.314ms
[info][gc] Allocation Stall (Worker-1) 2.289ms
[info][gc] Allocation Stall (Worker-6) 3.612ms
[info][gc] Allocation Stall (Worker-2) 5.087ms
[info][gc] Allocation Stall (Worker-5) 12.156ms
Stall durations are dramatically shorter: 2–12ms compared to non-generational ZGC’s 30–80ms.
Why Generational ZGC Survives:
By focusing frequent collections on the Young Generation (where Order objects churn), Generational ZGC frees memory much faster. The 400K product catalog stays in the Old Generation and is scanned infrequently.
Result: 3.2x fewer stalls and 5–6x shorter stall durations compared to non-generational ZGC.
Side-by-Side Comparison: 512MB Results

The Dramatic Difference
Let’s put these numbers in perspective:
Non-Generational ZGC at 512MB:
- 2,357 allocation stalls
- ~39 stalls per second
- Average stall: 56ms
- Total blocked time: ~132 seconds (across all threads)
Generational ZGC at 512MB:
- 739 allocation stalls (3.2x fewer)
- ~12 stalls per second
- Average stall: 10ms (5.6x shorter)
- Total blocked time: ~7.4 seconds (across all threads)
The bottom line: Under extreme memory pressure, non-generational ZGC’s application threads spent 132 seconds blocked waiting for memory, while Generational ZGC’s threads only spent 7.4 seconds blocked — a 17.8x improvement.
What This Means for Real Applications
Imagine you’re running a flash sale:
With Non-Generational ZGC (512MB):
- Every second, ~39 requests stall for 56ms on average
- User experience: constant hiccups, timeouts, abandoned carts
- Your logs fill with “slow request” warnings
- Users complain about lag
With Generational ZGC (512MB):
- Stalls are 3x less frequent and 5x shorter
- Most users never notice any delay
- Your application maintains responsiveness
- Orders keep flowing smoothly
With G1GC (512MB):
- No allocation stalls, but 122 Full GC pauses
- Each Full GC freezes the entire application for 150–260ms
- Users see occasional but noticeable freezes
- Better than non-generational ZGC, but not as smooth as Generational ZGC
Conclusion: Why Generational ZGC Matters
The 1GB results showed Generational ZGC was more efficient. The 512MB results show it’s essential for survival under pressure.
When to Choose Each Collector:
G1GC:
- ✅ You can tolerate 2–20ms pause times
- ✅ Your application isn’t latency-critical
- ✅ You want proven, stable technology
- ❌ Ultra-low latency is required
- ❌ You face frequent memory pressure
Non-Generational ZGC:
- ✅ You need sub-millisecond pauses
- ✅ You have generous heap memory (>2GB)
- ✅ Memory pressure is rare
- ❌ You run on constrained memory
- ❌ You can’t afford allocation stalls
Generational ZGC (Recommended):
- ✅ You need sub-millisecond pauses (even better than non-gen ZGC)
- ✅ You need to handle memory pressure gracefully
- ✅ You want the lowest CPU overhead
- ✅ Your workload has generational characteristics (most do)
- ✅ You’re building latency-sensitive applications
Source Code and Video Tutorial
All Java 21 examples used in this article are available in this GitHub repository:
https://github.com/j2eeexpert2015/java21-features-showcase
I have also created a full video version of this lesson where I explain Java Generational ZGC step by step with code examples:
[embed]
Further Learning
This article is part of my broader Java 21 learning series. If you prefer a structured course format, I also cover Java 21 features, Spring Boot demos, Virtual Threads, JMeter performance testing, monitoring, and Java 21 migration in my Udemy course:
**Java 21 Features Deep Dive: Virtual Threads & Spring Boot**
Disclosure: This is my own Udemy course. If you enroll using the course link above, I may receive instructor revenue from Udemy.
Thanks for reading! If you enjoyed this article, please clap and share it.
If you found this article valuable and would like to read more of my work, consider following me on Medium for regular updates.
메타데이터
- post_id
- 64f7b4735dbb
- slug
- generational-zgc-in-java-21-explained-64f7b4735dbb
- url
- https://medium.com/javarevisited/generational-zgc-in-java-21-explained-64f7b4735dbb
- canonical_url
- https://medium.com/javarevisited/generational-zgc-in-java-21-explained-64f7b4735dbb
- author_url
- https://medium.com/@mrayandutta
- status
- ok
- fetched_at
- 2026-07-10 13:01:02