Formula 1 2026: Pre-Season Analysis, Predictions & PU Shenanigans
With Bahrain testing in our rear view mirrors and the first weekend of the year looming over our shoulders, there’s a lot to unpack when it…
Formula 1 2026: Pre-Season Analysis, Predictions & PU Shenanigans

With Bahrain testing in our rear view mirrors and the first weekend of the year looming over our shoulders, there’s a lot to unpack when it comes to the potential pecking order of a completely overhauled ruleset both inside-&-out, made more interesting this year by the introduction of an 11th team. So I figured I take a look at the telemetry data from the second Bahrain test, understand how these cars perform on their best laps, and maybe try to gauge the capabilities of each team, and which ones to keep a lookout for.
DISCLAIMER: TESTING TIMES DON’T MEAN SHIT. Teams put on sandbags weighing more than Max’s balls, and they use run plan simulations to understand the performance of the car without giving off much to rivals. What I have here is just a comparison between the fastest times set by each car across all 3 days of Test-2, allowing me to look through the sand (pun intended) and see if I can draw any conclusions about PU performance. Just make sure to take whatever you read here with an equally gargantuan bag full of salt, but I shall still try my best to substantiate everything I say here.
So, what are we doing here?
I’ve chosen the best laps set by every driver cross three days of Test-2, and used their corresponding telemetry data to do the analyses. Again, these aren’t representative enough, but they can provide kind of a good picture of which teams have how much potential by the virtue of sheer lap times. The lap times themselves don’t portray much, but by using these numbers we can actually get a really convincing picture of the teams’ preparedness/starting pace, as is consistent with most previous seasons.
Btw, just Google FastF1 python library to get access to all this, it’s all pretty easy & simple to just extract data and write code to manipulate visualizations as you want.
The Testing Times Leaderboard

Which data points are worth looking at:
Honestly, none.
But, just for funsies, I wanted to look at mainly 3:
- Aero Efficiency: Ratio of top speed to average speed, a very good and easy way to visualize which cars have an optimized aero package, a good balance between downforce and drag (or lack thereof). Represented here as a scatter plot.
- Apex Speed: Corner entry speed. While yes this is mainly governed by the downforce produced by these cars, tires, braking, driving style play almost as important of a role in this aspect. However, since we’re looking at data throughout three days of testing where teams were given 24 sets of tires to work with, I think it’s safe to assume at least their best laps were run with good enough tires. Although it’s really not the best comparator, at least it can provide an idea on the baseline performance, which is all I’m doing here.
- Speed traces: Good old speed traces through the track. Staple for head-to-head comparisons, although barely relevant now.
First off, Aero Efficiency.

Aero Efficiency for all the cars
How to read this: the higher a point is to the top right, the more efficient it is. Notice that this plot isn’t scaled to the origin.
First thing that pops out: that Leclerc Day 3 lap (apologies for not colour coding it properly; I’ve been too lazy. You’d just have to take my word for it that that’s Leclerc). This was in fact not with the “Macarena” wing. Medium top speed, but a very high average speed, means a very downforce-focused package but also very high drag.

Aero Efficiency: top 4 teams
Comparing the top contenders, the general observable trend is that the McLaren package seems to be most balanced, Red Bull & Mercedes & Ferrari have more of a downforce-focused setup. Meanwhile some of the outliers here are Haas & Alpine, outliers because look at those lap times. The newcomers Cadillac & Audi (this one’s maybe not that new) ran low drag setups. Cadillac did not have much to write home about in terms of outlandish designs, but Audi and its weird & small “sidewall” sidepods did turn some heads. Finally, of course, the great Adrian Newey’s now discovered problem child, the AMR 26 had the least efficiency amongst everyone, while also being the slowest amongst all from the whole of testing, that too with a considerable margin.
Apex entry speeds:

Overall top 4 teams
The logic behind that is to understand which teams have an aero head-start compared to others. Since cars can metamorphosize into B-specs dramatically in a span of even a singular week, the idea of all of these trace analyses is only to see which cars potentially have a higher starting point come Australia.
How to read this: This is pretty straightforward, the higher the speed, the faster the car.
Again, that Leclerc Day 3 lap sticks out like a haunted light house on a deserted death island called “Hope of the Tifosi”.
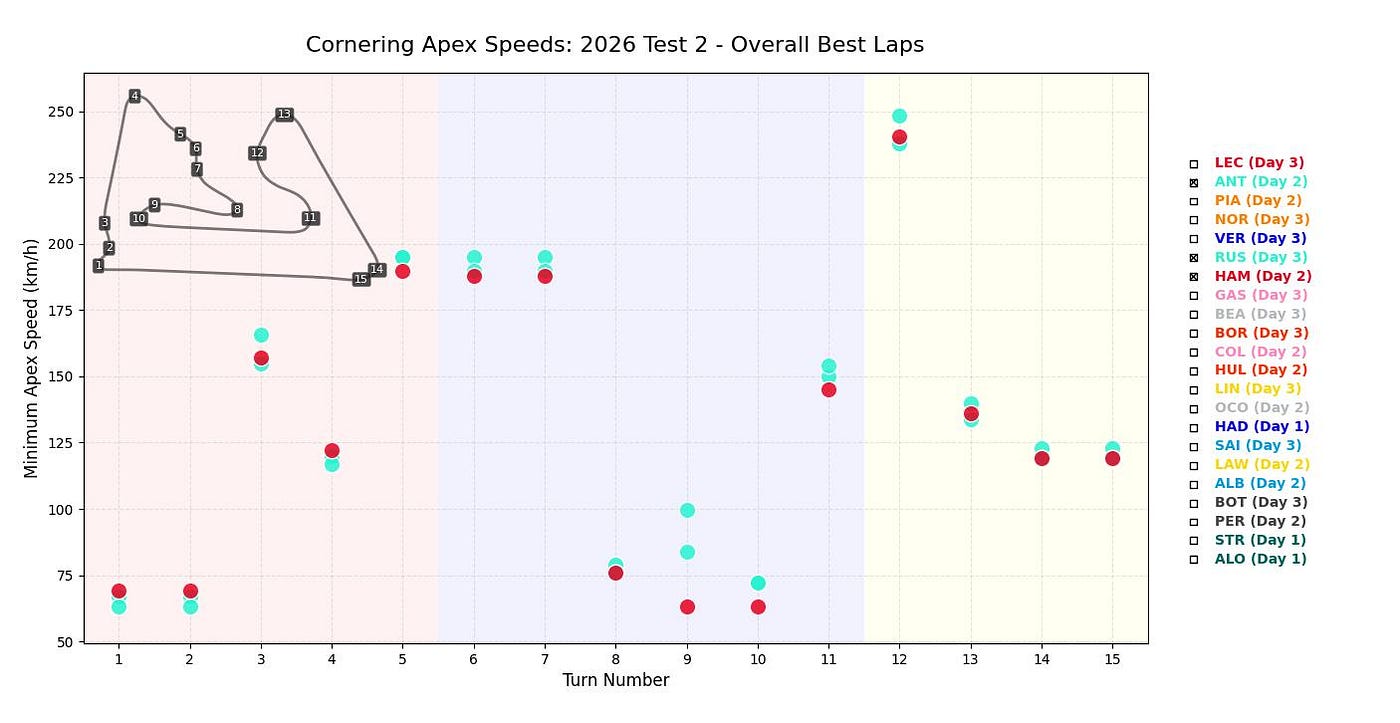
Apex speeds Ferrari vs Mercedes, excl. Leclerc’s fastest final day time
Ignoring that for a second, we can see that W17 is really is the one with the highest apex speeds in general. Not by much, and certainly not with a large enough margin of Leclerc’s fastest lap. Hamilton’s delta is just as significant in the first place. But, the Germans & the Italians are absolutely gunning neck-to-neck (unlike the 20th Century). Needs to be seen how do these numbers look for longer race runs, let me know if anyone wants a tire deg analysis.
With a moderately good efficiency and a very good medium to high downforce design, expect the W17 to start strong. (PS: in hindsight from the Saturday of Australian GP, that was actually be a pretty sane expectation.)
However, do not count Ferrari out at all. They’re strongly positioned in 2nd, and if that outlier Leclerc lap is anything to go by, plus maybe with the incorporation of their new wing, it should ideally be able to churn up way more than occasional fights for wins. Medium to low speed tracks, you can expect the Rosso Corsa to shine.
Red Bull are a strong third, if we’re to believe these numbers. The now-non-Newey-made chariot can haul itself to the podiums more often than not, regardless of how much Max Verstappen hates driving these cars.
The rest, well it’s all pretty evenly spread, but cherry picking amongst any of them would be shooting in the dark. Cadillac and Aston to compete for who has the worst car. And just by these numbers, the middle order will be ripped to shreds through the year, at least earlier on.
This whole set of regulations will reward whoever that reads the rulebook best and keeps up with the development game.
Finally, the speed trace

Speed trace; top 4
How to read this: the X-axis is just the distance of the lap, and the Y-axis is the speed of the car at that point in time. The faster, the better, as simple as that. Breakfast cereal is sometimes more complicated.
To very honest, again really non-representative. Which is why I kept this at the very end. At least it seems like McLaren has serious straight line pace, Mercedes has a higher top speed with Ferrari & Red Bull close behind, including McLaren. This sadly is really deceptive, because especially with all these new active aero, Bahrain telemetry is inconclusive, because one can only gauge so much looking at wing configurations. I’ll only get a proper picture of this once the races start, therefore I couldn’t care enough to deal with this right now.
My Predictions for the season
Now, for the world’s most accurate prediction of the 2026 Formula 1 season, one that I’ll guarantee you has absolutely zero possibility of being wrong by even the slightest …… Drumrolls please………
Look, these cars are just the spec A’s. Everything will change in the very recent future, maybe even in Australia. But based purely on the aforementioned data, I think we can make a pretty educated guess on the pecking order. Rather than just guessing on vibes, I’ll guess on data, lol.
Do keep in mind, even the PU regulations have the potential to be overhauled as soon as after the summer break (spoiler alert: maybe even sooner), simply because of how absolutely hopeless they are.
Let’s get this out of the way, Mercedes is taking the overall prize. Ferrari will have a 2022-esque start, and then maybe do Ferrari things later in the year, who cares if they have a good car, they’ll fuck things up regardless. But by raw pace, do not count them out and expect them to be a headache for Toto. Red Bull to be 3rd, albeit to a slow start. McLaren, if they manage to stick their modular approach, will start off the season as the best of the rest, but slowly creep up the order maybe displace RB by the end of the season.
Among the middle-benchers, Alpine with their new Mercedes PU could comfortably be at the top of the greater midfield. VCARB take up 6th, followed by a very strong showing of the new Schweizer-Deutsch outfit of Audi (HQ’d about 200kms away from me; definitely not biased), and Haas, the four of whom will basically be trading blows with each other throughout the year. That said, I expect Audi to have a pretty strong year, and it would be my choice for the biggest surprise.
Williams, riding on the back of a strong season, their lack of proper testing performance in conjunction with their current restructuring & the choice to forego the Barcelona test, I’d place them towards the tail end of the grid. Rounding up the final places, Aston Martin will surely manage to fix up their car and crawl up from a FIA certified sexual pleasure machine to a proper points contender, followed by Cadillac, who, and to every form of credit to them, will just gather experience and build up the team from the ground up. I am however expecting pretty less from them in the first place.
About those new PU’s……
Alright bear with me while I let out a rant about the new PU’s (I may or may not be slightly under the influence of a fine glass of scotch at the moment).
OH WHAT A DISASTER.
First off: I lament the loss of the great MGU-H. It was literally one of the greatest inventions of Formula 1 in the entirety of this millennia. Imagine harvesting energy from just the heat of the exhaust gases of the engine, shooting up the efficiency of these ICE engines to about 50% (2019 Merc data). And now, that extra exhaust energy literally just goes DOWN THE DRAIN (or tail pipe, for that matter), just so that Audi can create an engine on equal footing as everyone else.
What.
Tagging along the energy recovery concept, the cars this year heavily depend on quick discharge and recharge of the energy stores (batteries, basically). I mean cool, I have always been a proponent of hybridization in cars. But, and here’s the catch: while crafting these magnificent regulations, Tombazis & Co. fucking forgot that the ~50–50 balance of e-power and ICE power might not bode well for all the tracks.
And thus was heralded, the rise of Clipping & Superclipping.
What is that? It’s when drivers, while on full throttle, drastically lose speed because the energy of the ICE is being piped into the battery, by means of battery management software, just so that the car can deploy peak power it’s designed for further down the lap/subsequent lap. Not a good look, is it?
In Australia (apologies for the timeline mess up throughout this whole piece), the first quarter of the race was interesting, to say the least. However, that can only be attributed to the severe mismatch in power (rather in technical terms, energy) that either of any two battling cars had. So, there were 120 overtakes alright, yet none of those were out of pure racing.
One might say, well, DRS was also created to provide an “unfair” advantage to the following ca to facilitate an overtake. But, it was just a tool to give the car behind a chance at overtaking in the straights while keeping corner out-braking possible.
What’s happening now is overtaking has nothing to do with the driver. It’s just a matter of who has more ‘energy’, like in Formula E; everyone can overtake everyone everywhere and the deciding factor is nothing but the energy recovery and track config.
Number of overtakes can never mean better racing, in fact some of the greatest races in F1 came out of races that had very less overtaking. Especially considering the ease of these moves, wheel-to-wheel racing now is being minimized beyond what this sport should, and that’s pathetic.
They’ve always wanted to increase overtaking, and while DRS was built for an era of complex aero and dirty air, and it too faced a ton of criticism when it was conceived. Nevertheless, DRS never snatched away wheel to wheel racing: the straight line speed advantage was just an auxiliary addendum to classic late-brake racing.
This implementation of a 50–50 split nothing but reeks of virtue signaling tech that doesn’t align with what F1 is supposed to mean; they ditched MGU-H because of VW + Porsche and skipped front axle regen because every other team cried foul against them, thus creating a concoction of compromise and catastrophic chaos.
If you want high regen and fast deployment, might as well stay true to your cutting-edge ethos and use graphene supercaps instead of basic Li-ion chemistry. Heck, might even move to solid state if road relevance is priority, but that won’t provide enough energy density anytime soon. Further, if you want a 50–50 split, use NA engines to not handicap the ICE’s. Instead, they made a scaffolded a stupid Frankenstein PU with worse Carnot cycle efficiency by a LONG SHOT, and an energy regime fairly irrelevant to most road cars.
Looking at the math, a 4MJ capacity battery (which is equal to ~1.1kWh, smaller than the battery in a Renault Clio Hybrid btw, although I am aware this is an apples-to-pineapples comparison), a 8MJ/lap (normally speaking) recovery allowance, and a 250kW limit of regen power, this whole mandate of energy recovery is doing nothing but overcomplicate things, to put it non-complicatedly, as has been echoed by most of the drivers. 8MJ of recovery gives you the potential of around 29s of deployment at full e-power, BUT, that is possible only if the battery is fully charged at t0, AND if around 50% of the ~1000hp (~750kW) max power is dedicated to recouperation.
THIS IS THE PINNACLE OF MOTORSPORT???
Alright, I’m done here. Probably.
How to fix this, maybe?
Here’s just a suggestion from a lowly nanotech engineer who perhaps understands only like a wee bit of how all these work. It is important to consider that only a fraction of the PU concerns can be salvaged this season, at least if the total output power is to be maintained (rumors already going wild about a change as early as the Japanese GP, lol). Most of what I am writing here can only be achieved in the following seasons. So, here goes:
- First of all, get rid of the 50–50 split. Move to more ICE power with higher fuel flow rates, throttle mapping and/or higher boost psi.
- Complete freedom of energy recovery: cars should be allowed to use the entirety of 350kW to recoup energy, and can use as many battery cycles as they want (no more 8MJ per-lap limits). Yes this would mean high speed circuits remain energy starved, but that’s where the more ICE power and higher recovery rate comes in clutch.
- Limit clipping/superclipping, artificially: say, 8kph. That’s the max speed any car can lose on straights or swooping corners (just realized, a turn like the 130R at Suzuka will be a safety NIGHTMARE if a sudden delta in power/speed happens at that speed). Cars will have to deploy their energy keeping in mind the lowest speed they’re allowed to go, mapped correspondingly to engine RPM.
- And the most effective solution in my opinion, but something for later seasons, front axle regen (used the Audi representation here for obvious reasons). This would solve pretty much the majority of problems surrounding these regulations, but it would also necessitate a redo of PU + chassis + CE regulations.

(yes I am aware my handwriting is as disastrous as these PU regulations)
- A bit of napkin numbers from my side renders around 150–200kW of recouperation per braking point (depending upon the regen capability). PB&J that with maybe 60% frontal brake bias, and you have a car that claws back enough battery power at every braking point without draining the ICE, while also improving wheel to wheel racing because, well, there’s a lot more driver skill here at stake.
Off the top of my head, this is all that can I can conjure up now. I’ll keep on adding if I come up with any ideas, or when someone infinitely smarter than me designs something and posts on Reddit.
Post-Australian GP notes
The pecking order pretty much aligned with what the testing numbers showed, and Ferrari as usual managed to live up (rather, down) to my expectations. As for the racing itself, faster tracks like Albert Park, Jeddah, Monza, Baku are going to be hit hard, and next week’s Shanghai could end up being a tipping point with its long straights.
Something else that I saw was the inherent lack of overtaking ability of these cars, when Max engaged in a potential fight with Lando. Also, there seems to be very low tire degradation, but I haven’t checked out the data yet.
Overall, the race had a ton of its “fabricated” action through to about lap 15, after which it became a snoozefest of battery and tire management, culminating into a 15s gap to P3 & 51s to P5. I don’t even know what to make of it, honestly.
So yeah, that’s pretty much that I have to say when it comes to pre-season (and the first race) debrief of the the new and weird 2026 season and era of cars!
I am very much looking forward to criticisms from and discussions with anyone reading this, considering all of these analyses are merely from my own understanding of the sport, albeit after years of following the technical side very closely and a small stint at building a formula student car at my university. However, do let me know if there’s any fault in the math, logic, or if there’s something that doesn’t make sense, I’d love to get that corrected/clarified asap. Thanks for reading!
메타데이터
- post_id
- 654f0b9aeb3e
- slug
- formula-1-2026-pre-season-performance-analysis-predictions-pu-shenanigans-654f0b9aeb3e
- url
- https://medium.com/@chaudhuripriyam/formula-1-2026-pre-season-performance-analysis-predictions-pu-shenanigans-654f0b9aeb3e
- canonical_url
- https://medium.com/@chaudhuripriyam/formula-1-2026-pre-season-performance-analysis-predictions-pu-shenanigans-654f0b9aeb3e
- author_url
- https://medium.com/@chaudhuripriyam
- status
- ok
- fetched_at
- 2026-07-13 06:23:13