What Building Real Dashboards Taught Me About Real Systems
A reflection on messy data, broken connections, and the quiet complexity hiding behind every chart.
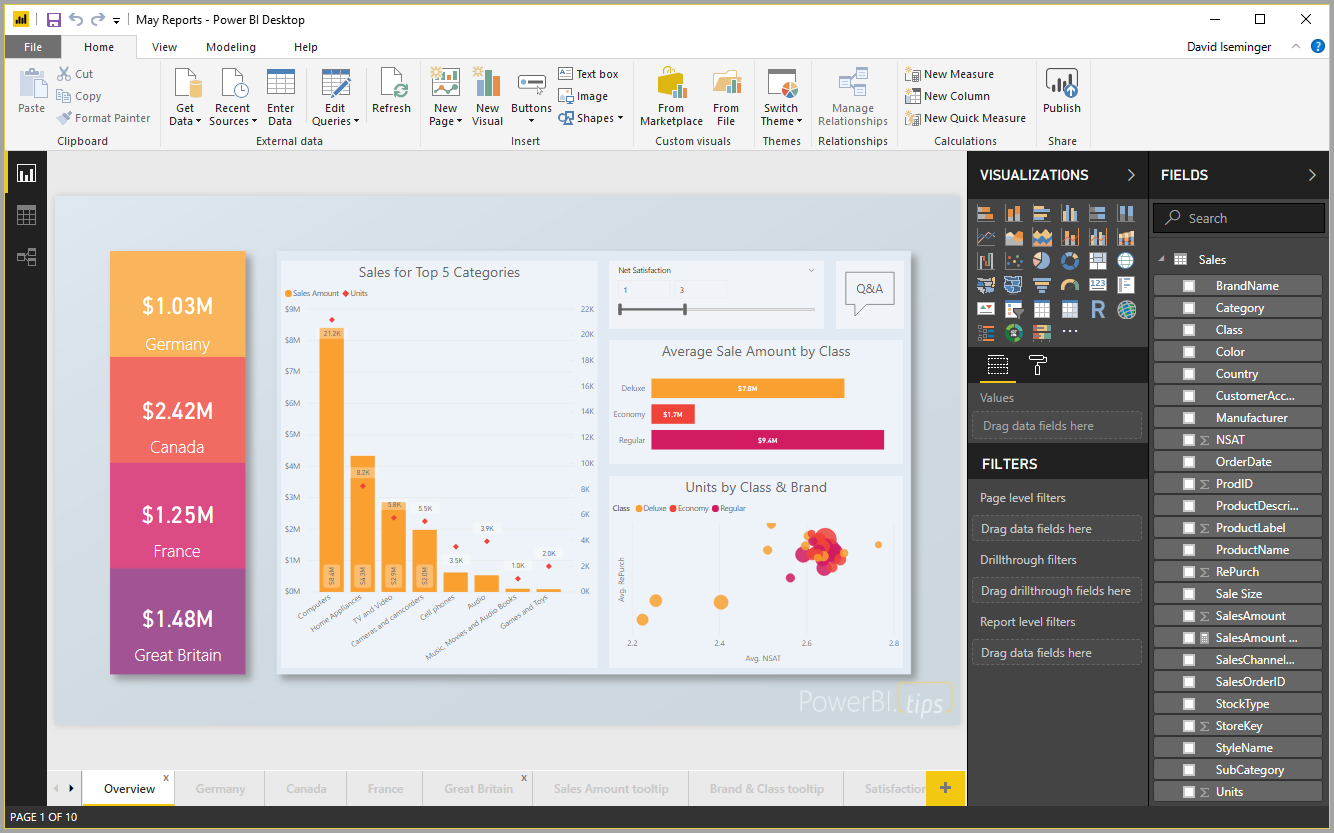
A random report, just because:)
What Building Real Dashboards Taught Me About Real Systems
A reflection on messy data, broken connections, and the quiet complexity hiding behind every chart.
I used to think dashboards were mostly about design decisions. Which chart type to use. How to arrange KPIs. Whether to go with a dark theme or a light one. I thought the hard part was making things look clear and communicating insights well. Everything else getting the data, cleaning it up, connecting the dots would just… work.
Then I got my first real assignment.
The Task Sounded Simple
I am working at Maersk, and I didn’t have much prior experience with data manipulation or visualisation. A few tools here and there, some basic understanding of databases but nothing remotely close to production-level data work. So when I was told to prepare a dashboard to monitor the KPIs and throughputs of one of their major warehouse sites something that would be presented to customers and reviewed regularly by stakeholders I felt a mix of excitement and quiet nervousness.
The brief was clean: keep it simple, follow a logical flow of representing data, make it easy to read. The ask felt manageable on the surface.
What was hidden behind the curtains, though, was a very different story.
Expectation vs. Reality
In my head, the process looked something like this: connect to a data source, write a few queries, drop some charts on a canvas, and ship it. Maybe spend a day or two polishing the visuals.
What it actually looked like was weeks of debugging connections, digging through undocumented schemas, staring at queries that returned results but somehow still felt wrong, and slowly piecing together a mental model of a system I had never worked with before.
The dashboard was often the easiest part.
That realization hit me gradually, not all at once. Each week something new revealed itself a new layer of complexity that I hadn’t anticipated. And looking back, I’m actually grateful for it.
The First Wall: Just Getting Connected
I started with Grafana. It seemed like the right tool for monitoring warehouse operations real-time, visual, purpose-built for operational data. The plan was to pull logs and metrics and build out a live view of throughput.
And for a while, it felt like it was working. I was getting data in, seeing some numbers populate, starting to structure the layout. Until…
Grafana has a log limit around 5,000 entries which means at a certain point, you simply cannot visualize beyond a week’s worth of data. Multiple meetings later, after going back and forth on workarounds and trying to push the limits of what was possible, it became clear: Grafana wasn’t the right fit for this use case. The tool wasn’t wrong it was just not built for what we needed.
So we pivoted to Power BI.
Power BI felt promising. Richer in terms of business-facing visualization, better support for longer time windows, more familiar to the stakeholders who’d be viewing the dashboard. The switch made sense. But now came a different problem: how do you get on-premise warehouse data into the cloud so Power BI can actually see it? The exact data that was being logged on Grafana and giving numbers easily was now a challenge.
I spent a significant amount of time trying to connect cloud-hosted data to Power BI. I didn’t know what ODBC drivers were at first. I didn’t even know that something like a connection string had this many moving parts. I tried configurations that looked right but failed silently. I questioned whether it was a permissions issue, a port issue, a credentials issue, or just something I was fundamentally misunderstanding.
Eventually, I figured out how to use ODBC drivers and got the connection string into a shape that looked correct. Then it turned out I wasn’t even a member of the right team on the cloud platform so the data simply wasn’t accessible to me, regardless of what I typed. Once that was resolved and I finally had data in front of me, there was a new question waiting: okay, now what do I actually do with this?
What surprised me wasn’t the difficulty of any single step. It was the sheer number of steps:
- Permissions access that looks granted but quietly isn’t
- Credentials tokens and secrets that need to align perfectly
- Gateways and ports environment-specific, rarely documented
- Environment mismatches configurations that work locally, fail elsewhere
- Unstable connections working one moment, broken the next
Each one is manageable in isolation. Together, they can quietly drain a week of work.
And at the time of writing this, the on-premise to cloud pipeline is still being figured out. The cloud-to-Power BI connection exists. The full picture is still being assembled. That’s real work ongoing, iterative, and never quite as finished as you’d like.
Dashboards Are Mirrors
Here’s the thing that took me the longest to appreciate:
A dashboard is basically a mirror held up to a system.
If the operational process behind it is inconsistent, the dashboard will show that immediately and honestly. Consider what that actually means:
- If data is entered differently by different teams, you’ll see it in the numbers
- If a pipeline occasionally drops records, you’ll see unexplained dips
- If naming conventions are inconsistent, you’ll have categories that should be one thing but look like five
The dashboard doesn’t lie. It just reflects what’s there. And sometimes what’s there is a process that hasn’t been fully standardized yet, or a system that’s grown faster than the infrastructure supporting it.
In a strange way, this is what makes dashboards genuinely useful not just for monitoring, but for surfacing things that need attention. Building one made me understand the system in a way that would have taken much longer through any other path.
What I Actually Learned
If I’m honest, I learned more about systems, data engineering, and operational complexity from this project than I did from most structured learning I’d done before it.
- Connectivity is not trivial. It’s often where the real work begins.
- Schemas carry organizational history inside them read them carefully.
- The same question “how many inductions were successful and how many had to be reinduncted and why?” can have five different answers depending on how you query be it first inductions or last or something in between.
- Pivoting is fine. Moving from Grafana to Power BI wasn’t a failure it was understanding the right tool for the right job.
- Spending weeks on a dead end isn’t wasted time if you came out knowing something you didn’t before.
And maybe most importantly: I learned to be comfortable with incompleteness. Not every connection is fully established. Not every schema question has a clean answer. Real work lives in that space between “mostly working” and “fully understood,” and the job is to keep moving through it with curiosity rather than frustration.
Closing Thought
If you’re just getting into data, analytics, or any kind of systems work don’t be discouraged when the simple parts turn out to be complicated. The visualization layer, the charts, the color schemes? That part genuinely is simpler. It’s everything underneath it that takes time.
The dashboards I eventually built weren’t perfect. But in building them, I learned what questions to ask, which assumptions to distrust, and how to read a system by looking at what its data reveals about it.
That, I think, is worth more than knowing which chart type to use :)
That’s all for now. Thanks a lot for reading! If you’ve had your own “wait, why won’t this connect” moment working with real data, I’d love to hear about it in the comments. If you found this useful or have anything to add, feel free to reach out on LinkedIn.
메타데이터
- post_id
- 65ec45ad4f3f
- slug
- what-building-real-dashboards-taught-me-about-real-systems-65ec45ad4f3f
- url
- https://medium.com/@adwitijha/what-building-real-dashboards-taught-me-about-real-systems-65ec45ad4f3f
- canonical_url
- https://medium.com/@adwitijha/what-building-real-dashboards-taught-me-about-real-systems-65ec45ad4f3f
- author_url
- https://medium.com/@adwitijha
- status
- ok
- fetched_at
- 2026-07-14 14:14:34





