💀 The Hikari Setting That Turned Slowness Into an Outage
(Spring Boot Production Reality + Code)

💀 The Hikari Setting That Turned Slowness Into an Outage
💀 The Hikari Setting That Turned Slowness Into an Outage
(Spring Boot Production Reality + Code)
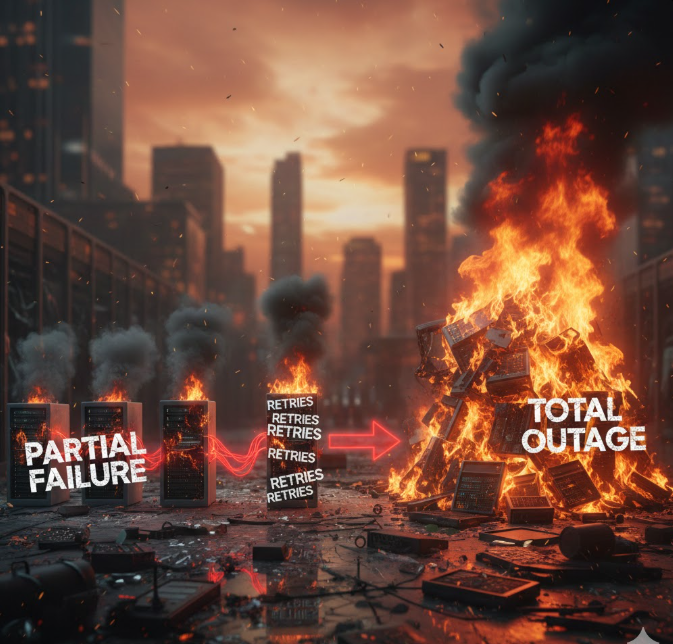
Our database didn’t go down. It just got… a little slower.
And that tiny slowdown was enough to take out every Spring Boot pod in the cluster.
Not because Postgres failed.
Because of one setting in HikariCP.
😌 The day started normal
At 8:55 AM:
- traffic rising
- dashboards green
- no deploys
- no incidents
At 9:03 AM:
- P95 latency jumped
- error rate spiked
- pods restarted
- thread pools filled
- Kafka lag rose
- on-call got paged
At 9:06 AM:
- total outage
And the weirdest part?
DB metrics looked… fine.
CPU wasn’t 100%. Memory wasn’t full.
So what happened?
🧠 The truth nobody tells you
Your DB doesn’t need to be down to kill your system.
It only needs to be slow enough that:
- DB connections stay busy longer
- new requests pile up
- Hikari pool runs out
- your app starts timing out
- retries multiply traffic
- everything collapses
This is not a DB outage.
This is a connection pool outage.
🧨 The setting: maximumPoolSize
Here’s what we had in production:
spring:
  datasource:
    hikari:
      maximum-pool-size: 200
We set it because:
“More connections = more throughput.”
That belief is how the outage happened.
🚨 Why this setting is dangerous
Because 200 connections per pod is not 200 connections.
It’s:
200 × number_of_pods
So if you have:
- 20 pods
- pool size = 200
Your DB sees:
4000 possible concurrent connections
That’s not scaling.
That’s a slow-motion DDoS.
💥 What happened at 9 AM
At 9 AM, traffic spiked.
Queries slowed slightly because:
- more users
- more cache misses
- more expensive queries
- maybe autovacuum
- maybe one slow index
Let’s say queries went from:
- 20ms → 150ms
Not terrible.
But here’s the trap:
When query latency increases…
connection occupancy increases.
So each connection stays busy longer.
So the pool fills.
🧠 The pool doesn’t protect the DB
It protects the app… until it doesn’t.
Once the pool fills:
- requests block waiting for a connection
- threads are stuck
- Tomcat threads fill up
- latency spikes
- clients retry
- more traffic arrives
And now your service isn’t slow.
It’s dead.
🔥 The fatal log line
This showed up everywhere:
HikariPool-1 - Connection is not available, request timed out after 30000ms.At that moment, your system enters a failure mode that looks like:
- DB issue
- network issue
- Kubernetes issue
- “maybe Redis?”
- “maybe Kafka?”
But the real issue is:
Your service ran out of DB connections.
☠️ Why “just increase pool size” makes it worse
This is the most common fix attempt.
Someone says:
“Hikari is timing out. Increase maximumPoolSize.”
So they change:
maximum-pool-size: 200to:
maximum-pool-size: 400And they feel like a hero.
But what they actually did was:
Allow the app to hit the DB even harder.
So the DB slows more.
So the outage becomes worse.
🧨 The hidden killer: connectionTimeout
Here’s our real config:
spring:
  datasource:
    hikari:
      maximum-pool-size: 200
      connection-timeout: 30000
30 seconds.
This seems “reasonable.”
But it’s not.
Because it means:
Threads will sit blocked for 30 seconds waiting for DB connections.
So instead of failing fast…
Your service becomes a thread graveyard.
😵 How it kills Tomcat
Default Tomcat max threads is often ~200.
So if:
- 200 threads block waiting for DB connection
- they block for 30 seconds
Then:
- your service stops accepting requests
- health endpoints get slow
- Kubernetes kills pods
- restarts increase cold cache misses
- outage spreads
🔥 The real villain: slow queries + oversized pool
A huge pool size hides slow queries.
It lets the system “keep working”…
until traffic spikes.
Then it collapses suddenly.
This is why the outage felt like:
“Everything was fine and then instantly dead.”
✅ The correct fix (Spring Boot production)
1️⃣ Reduce pool size per pod
Instead of 200, we moved to:
spring:
  datasource:
    hikari:
      maximum-pool-size: 30
Yes. 30.
And throughput improved.
Because:
- DB had fewer concurrent queries
- less lock contention
- better cache locality
- less CPU context switching
2️⃣ Lower connectionTimeout aggressively
We changed:
connection-timeout: 30000to:
connection-timeout: 1000Now, if the pool is exhausted:
fail fast in 1 second.
That sounds scary.
But it’s healthier.
Because it prevents:
- thread exhaustion
- request pile-ups
- cascading failure
3️⃣ Add query timeouts
Most teams don’t.
Which means slow queries can live forever.
In JPA:
@Query("select u from User u where u.id = :id")
@QueryHints({
        @QueryHint(name = "jakarta.persistence.query.timeout", value = "1000")
})
Optional<User> findByIdFast(@Param("id") String id);
Or globally:
spring:
  jpa:
    properties:
      jakarta.persistence.query.timeout: 1000
4️⃣ Add a DB bulkhead (hard limit)
Even with Hikari, you need a concurrency cap at service level.
Example:
@Component
public class DbBulkhead {
private final Semaphore semaphore = new Semaphore(40);
    public <T> T execute(Supplier<T> supplier) {
        boolean acquired = semaphore.tryAcquire();
        if (!acquired) {
            throw new RuntimeException("DB overloaded, rejecting request");
        }
        try {
            return supplier.get();
        } finally {
            semaphore.release();
        }
    }
}
Use:
public UserProfile getUser(String id) {
    return dbBulkhead.execute(() ->
            userRepository.findById(id).orElseThrow()
    );
}
Now your app won’t sacrifice itself.
5️⃣ Use circuit breaker for DB-heavy endpoints
You normally don’t circuit-break your DB.
But you should circuit-break DB-heavy features.
Like search.
Like analytics.
Like reporting.
Not login.
🧠 How to choose the right pool size (real rule)
Here’s the practical rule we now use:
Start with:
maximumPoolSize = (CPU cores * 2)per pod- cap total DB connections across all pods
- keep DB connections < DB max_connections
Example:
If:
- DB max_connections = 500
- pods = 20
Then per pod pool should be around:
500 / 20 = 25
Not 200.
🚨 The one graph that reveals this instantly
If you ever see:
- DB CPU not maxed
- but app latency exploding
- and Hikari timeouts rising
You are not in a DB outage.
You are in:
a connection pool collapse.
🧾 The production rule
Your DB pool is not a throughput knob. It’s a blast radius knob.
A bigger pool doesn’t increase capacity.
It increases how fast you can overload the DB.
❤️ Final takeaway
The outage wasn’t caused by Postgres.
It wasn’t caused by Kubernetes.
It wasn’t caused by Redis.
It was caused by this belief:
“If we increase maximumPoolSize, we’ll scale.”
In production, the truth is:
Pool size decides whether slowness stays local… or becomes a full outage.
메타데이터
- post_id
- 6625ea5e9eef
- slug
- the-hikari-setting-that-turned-slowness-into-an-outage-6625ea5e9eef
- url
- https://systemweakness.com/the-hikari-setting-that-turned-slowness-into-an-outage-6625ea5e9eef
- canonical_url
- https://systemweakness.com/the-hikari-setting-that-turned-slowness-into-an-outage-6625ea5e9eef
- author_url
- https://medium.com/@gangoladeepa
- status
- ok
- fetched_at
- 2026-07-15 03:35:51