Cold Start Hell: Load Testing AWS Lambda at Scale
Cold Start Hell: Load Testing AWS Lambda at Scale — AI Generated Image
Cold Start Hell: Load Testing AWS Lambda at Scale
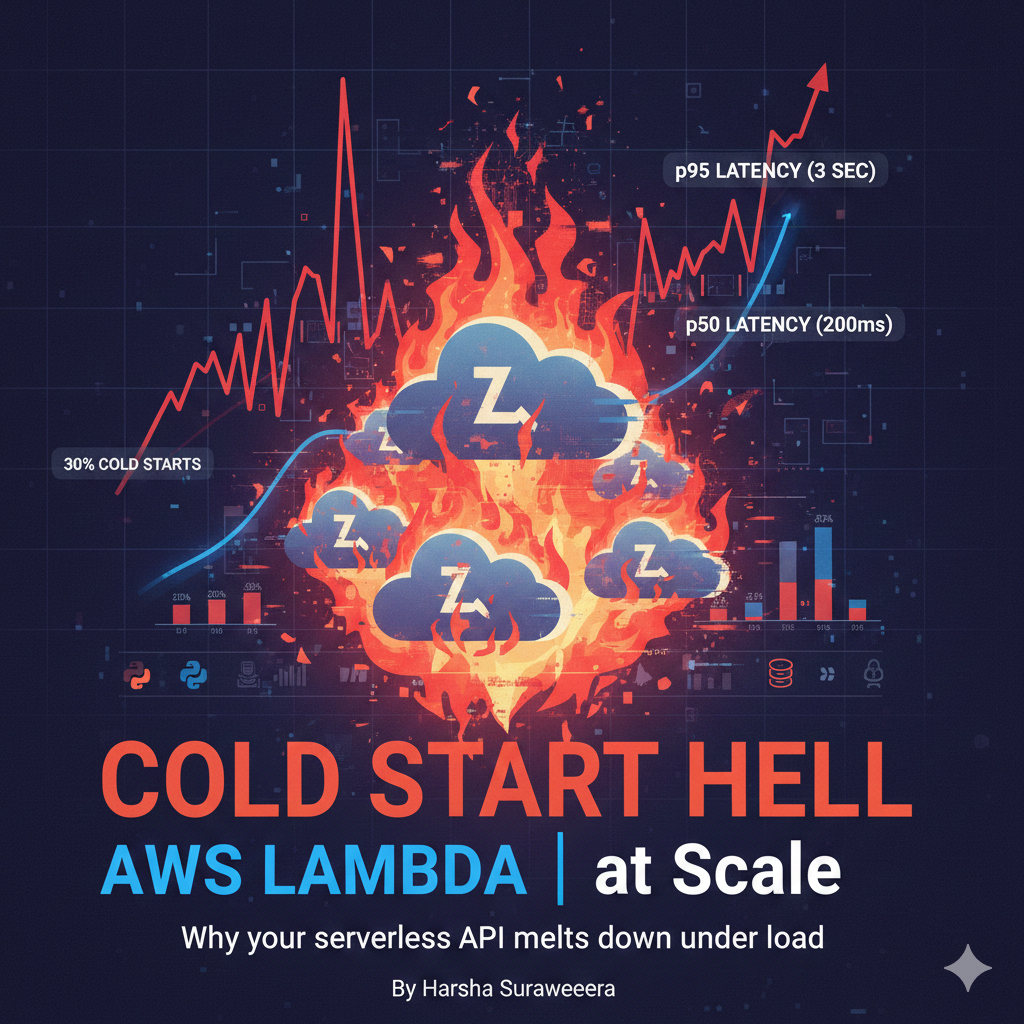
Cold Start Hell: Load Testing AWS Lambda at Scale — AI Generated Image
Cold starts are the thing everyone warns you about with Lambda, but nobody really explains how bad it gets until you actually try to load test the damn thing.
You build your serverless API. Local tests pass. Integration tests pass. Everything looks great. Then you run your first proper load test and watch your p95 latency shoot up to 3 seconds while your p50 sits comfortably at 200ms.
That’s “Cold Starts” destroying your final performance metrics.
What Actually Happens During a Cold Start
Lambda doesn’t keep your function running all the time. When a request comes in, and there’s no warm instance available, AWS has to spin up a new execution environment. That means:
- Downloading your deployment package
- Starting the runtime (Node.js, Python, whatever)
- Initializing your code
- Running everything outside your handler function
For a simple Node.js function, that’s maybe 200–500ms. Not terrible.
For a function with dependencies, database connections, and SDK initializations, you’re looking at 1–3 seconds easily. Sometimes more.
The tricky part is that this doesn’t happen consistently. Some requests hit warm instances, some hit cold ones. Your monitoring shows wildly inconsistent response times, and good luck explaining that to anyone who doesn’t understand serverless.
Why Standard Load Testing Falls Apart
Most load testing tools assume your system warms up. You ramp up gradually, let things stabilize, then measure steady-state performance.
Lambda doesn’t work that way.
I attempted to run a basic Gatling test against a Lambda API. Started with 10 requests per second, ramped up to 100 over a minute. Looked reasonable.
But here’s what happened: Lambda’s concurrency scaling is aggressive. As the load increased, it continued to spin up new instances. Each new instance meant another cold start. Even at a steady load, you’re constantly hitting cold instances because Lambda’s provisioning logic doesn’t match your traffic pattern perfectly.
My test showed 30% of requests hitting cold starts even during the “stable” phase. That’s not how steady-state performance is supposed to work.
The Concurrency Burst Problem
Lambda can scale really fast. Too fast, actually.
By default, Lambda has a burst concurrency limit. For most regions, that’s 3000 concurrent executions in the first minute. After that, it can scale by 500 per minute.
Sounds great until you realize what that means for load testing.
If you hit your API with 1000 requests per second for the first time, Lambda tries to provision 1000 concurrent instances nearly instantly. Every single one of those is a cold start.
Your load test sees complete garbage metrics because you just triggered the worst-case scenario.
The weird part is that in real traffic, this doesn’t happen as dramatically. Traffic usually grows more organically. But load tests by nature are sudden spikes, which is exactly what triggers maximum cold starts.
Testing Cold Starts Separately
The approach that actually worked was splitting load tests into two categories: warm performance and cold start overhead.
For warm performance, I pre-warmed the Lambda functions. Just hit them with low-volume traffic for 5–10 minutes before the real test. That kept instances alive and let me measure actual handler performance without cold start noise.
Then, separately, I tested the cold start impact. Killed all running instances (by waiting for them to expire or updating the function code), then immediately hit the API with realistic traffic patterns.
This gave me two distinct metrics: what performance looks like under normal conditions, and what happens when the system needs to scale from zero.
Both numbers matter. The first tells you how your code performs. The second tells you how bad the user experience gets during traffic spikes or after quiet periods.
Provisioned Concurrency Isn’t Always the Answer
AWS added Provisioned Concurrency to solve cold starts. You pay to keep N instances warm all the time.
It works, but it’s expensive and kind of defeats the point of serverless.
I tried it for one API. Set provisioned concurrency to 50 instances. Cold starts dropped to almost zero, which was great.
The bill wasn’t great. Provisioned concurrency costs significantly more than regular Lambda invocations. We were paying to keep instances warm even during low-traffic hours.
For APIs with consistent traffic, it makes sense. For bursty workloads, you’re paying for capacity you don’t need 80% of the time.
Measuring Cold Start Impact in Gatling
Gatling doesn’t have built-in cold start detection. Response time is response time.
I added custom checks in the simulation to flag likely cold starts:
val isColdStart = regex("Custom-Lambda-Cold-Start: true")

http("api_request")
  .get("/endpoint")
  .check(status.is(200))
  .check(isColdStart.saveAs("coldStart"))
  .check(isColdStart.saveAs("coldStart"))
AWS doesn’t include this header by default on cold starts. You’ll need to update the API code to detect cold starts and add the header to the response header. Once that’s in place, you can use it to clearly distinguish cold and warm invocations in your test results.
Then, in the report, I filtered metrics by cold start presence. Gave me separate percentiles for warm and cold requests.
Way more useful than looking at blended metrics and wondering why p95 is so high.
What Actually Reduces Cold Starts
After testing a bunch of different approaches, here’s what actually moved the needle:
Smaller deployment packages. Obvious but effective. I refactored one Lambda from 50MB to 8MB by removing unused dependencies. Cold start time dropped from ~2s to ~600ms.
Lambda has to download your package. Smaller package, faster download.
Lazy loading dependencies. Instead of importing everything at the top of your file, import only what you need when you need it. Or if you have to import heavy libraries, do it inside handler functions for endpoints that actually use them.
Reduced initialization time noticeably for functions with lots of imports.
Keeping connections alive. Database connections, HTTP clients, AWS SDK clients. Initialize them outside the handler, reuse them across invocations.
This doesn’t reduce cold start time, but it makes warm invocations much faster, which reduces the pain when cold starts do happen.
Setting a reasonable reserved concurrency. Lambda’s automatic scaling is aggressive. Sometimes too aggressive.
I set reserved concurrency limits on non-critical functions. Forces Lambda to reuse instances more, reducing total cold starts. You get more throttled requests if you set it too low, but for background jobs and async processing, it’s worth it.
The DynamoDB Throughput Connection
This isn’t strictly a cold start issue, but it shows up during load tests the same way.
When you scale Lambda aggressively, you’re also scaling database connections. If you’re using DynamoDB, sudden traffic spikes can exhaust your read/write capacity units faster than you expect.
I ran a load test that looked fine from Lambda’s perspective. No errors, reasonable latency. But DynamoDB was throttling like crazy because hundreds of Lambda instances were all hitting it simultaneously.
That throttling showed up as increased Lambda execution time, which looked like performance issues but was actually downstream capacity problems.
The fix was implementing exponential backoff in the Lambda code and increasing DynamoDB on-demand capacity. But the lesson was that load testing Lambda in isolation doesn’t tell you much. You need to test the whole stack.
Realistic Traffic Patterns Matter
Cookie-cutter load tests don’t work well with Lambda.
I started using traffic patterns that actually matched real usage:
- Morning traffic ramp-up (simulates users waking up)
- Lunch spike (brief high load)
- Afternoon steady state
- Evening taper-off
- Overnight low traffic with occasional spikes
This revealed different cold start patterns than a simple ramp-up test. Overnight, most instances expire. Morning traffic triggers mass cold starts. Lunch spike causes partial cold starts on top of warm instances.
Those are the scenarios you actually need to test, not a perfect linear ramp from 0 to 1000 RPS.
Cold Start Latency Distribution
One thing that surprised me: cold start time isn’t constant.
For the same function, I saw cold starts ranging from 800ms to 2.5 seconds. Mostly around 1.2s, but with a long tail.
Turns out Lambda is running on shared infrastructure. Sometimes you get a fast host, sometimes not. Network conditions vary. Package download speeds fluctuate.
This matters for SLAs. You can’t just say “we tolerate 1.5s for cold starts.” You need to account for the p95 or p99 of cold start time, which can be significantly worse than the median.
Using Layers to Pre-Load Dependencies
Lambda layers let you package dependencies separately from your code.
I moved large libraries (AWS SDK, database drivers, shared utilities) into layers. The deployment package went from 45MB to 3MB.
Didn’t reduce cold start time much, though. Lambda still has to load those layers during initialization.
What it did help with was deployment speed. Updating 3MB of actual code is way faster than re-uploading 45MB every time.
Small win, but it improved iteration speed during development.
Testing Memory Configuration Impact
Lambda lets you configure memory from 128MB to 10GB. More memory also means more CPU.
I tested the same function at different memory levels:
- 512MB: 2.1s cold start, 180ms warm
- 1024MB: 1.4s cold start, 120ms warm
- 2048MB: 950ms cold start, 80ms warm
- 3008MB: 800ms cold start, 65ms warm
More memory = faster cold starts and faster execution. Also more expensive per invocation.
For cost-sensitive workloads, 1024MB was the sweet spot. For latency-sensitive APIs, 2048MB+ made sense despite the cost.
There’s no universal right answer. You have to load test at different configurations and decide based on your priorities.
API Gateway Caching as a Buffer
API Gateway can cache responses for you. Cached responses bypass Lambda entirely.
For read-heavy APIs, this reduced Lambda invocations by 60–70%. Fewer invocations mean fewer cold starts.
Cache hit rate depends on your traffic patterns, but even modest caching helps smooth out Lambda’s scaling behavior.
The downside is stale data. You need proper cache invalidation. And caching doesn’t help with write operations or dynamic content.
Still worth considering for appropriate use cases.
What Good Metrics Actually Look Like
After running dozens of load tests, I settled on tracking these metrics:
Cold start percentage: How many requests hit cold instances? Target was under 5% during normal traffic, under 20% during scaling events.
P50 warm latency: Median response time for warm invocations. This is your baseline performance.
P95 cold latency: 95th percentile for cold starts. This is the worst-case user experience during scaling.
Time to scale: How long it takes to go from idle to handling peak load without errors. For us, that meant going from 0 to 500 RPS cleanly.
Cost per request: Total Lambda costs divided by the number of requests. Made sure optimization didn’t accidentally double the bill.
These metrics together gave a complete picture. Single numbers like “average response time” were useless because they hid the cold start impact.
The Annoying Reality
Lambda cold starts suck.
There’s no way around it. You can optimize, you can provision concurrency, you can architect carefully. But you can’t eliminate them without paying significantly more.
The question isn’t “how do I avoid cold starts” but “how bad are they for my use case, and what am I willing to do about it.”
For async background jobs, cold starts don’t matter much. For synchronous APIs serving users, they matter a lot.
Load testing helps you understand the actual impact. Not the theoretical worst case everyone talks about, but the real-world impact for your specific functions and traffic patterns.
And honestly, sometimes the answer is “cold starts are fine, actually.” If your p95 cold start is 800ms and it happens to 2% of requests during normal traffic, maybe that’s acceptable. Users won’t notice, and you save money.
Other times, the answer is “this is unacceptable” and you need to spend time optimizing or provisioning concurrency or even reconsidering Lambda for that particular service.
Load testing gives you the data to make that decision instead of guessing.
Getting Started
If you want to actually test this stuff:
Pick one Lambda function. Instrument it properly with X-Ray or CloudWatch Logs to track cold starts. Write a Gatling simulation with realistic traffic patterns, not just a linear ramp.
Run it multiple times. Lambda’s behavior varies. One test isn’t enough.
Look at cold start percentage, latency distribution, and cost. Don’t optimize for just one metric.
Try different memory configurations. Test with and without provisioned concurrency if the budget allows. See what actually makes a difference for your specific case.
Then decide what trade-offs you’re willing to make. Because that’s what serverless is: trading operational complexity for cost and scaling trade-offs.
At least now you’ll know what those trade-offs actually are instead of just reading blog posts about theoretical cold start times.
About Me
I’m Harsha Suraweera — a Full Stack Quality Engineer working with test automation, serverless testing, and AI-powered QA tools. I write about testing strategies, automation frameworks, and whatever technical problems I’m currently solving.
Connect with me: LinkedIn: linkedin.com/in/harsha-suraweera Website: harshasuraweera.com
If you found this useful, give it a clap or share it with someone who might need it.
메타데이터
- post_id
- 67e15bc4e366
- slug
- cold-start-hell-load-testing-aws-lambda-at-scale-67e15bc4e366
- url
- https://medium.com/@harshasuraweera/cold-start-hell-load-testing-aws-lambda-at-scale-67e15bc4e366
- canonical_url
- https://medium.com/@harshasuraweera/cold-start-hell-load-testing-aws-lambda-at-scale-67e15bc4e366
- author_url
- https://medium.com/@harshasuraweera
- status
- ok
- fetched_at
- 2026-08-06 10:19:58