How Garbage Collection Works in .NET 10, Heap, Stack & Generations - From Allocation to Reclamation
From Stack Allocation to GC Reclamation via Gen0→Gen1→Gen2, LOH, and POH | .NET 10 Execution Lifecycle: The Upward Cycle
How Garbage Collection Works in .NET 10, Heap, Stack & Generations - From Allocation to Reclamation
From Stack Allocation to GC Reclamation via Gen0→Gen1→Gen2, LOH, and POH | .NET 10 Execution Lifecycle: The Upward Cycle
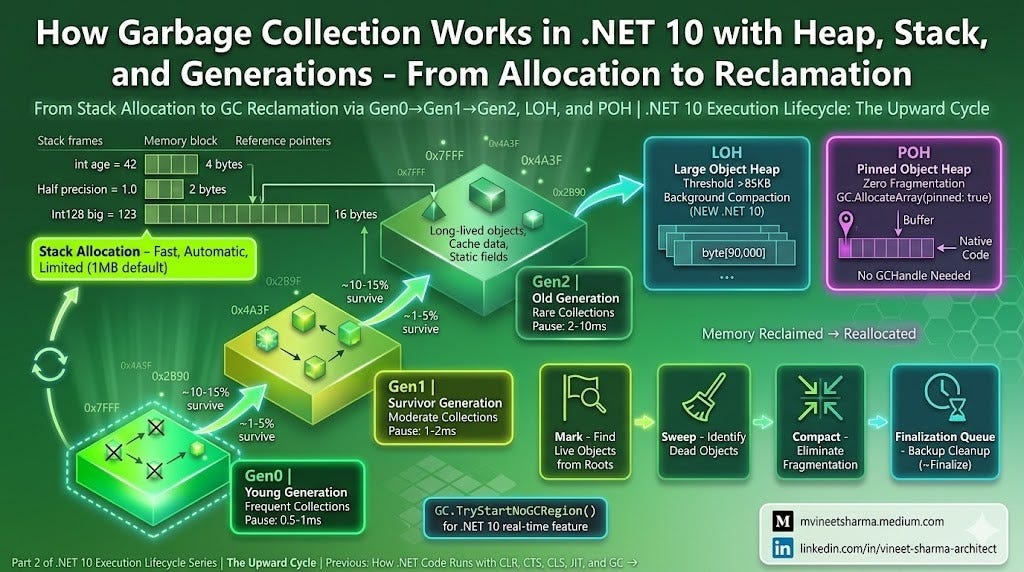
How Garbage Collection Works in .NET 10, Heap, Stack & Generations — From Allocation to Reclamation
Part I: The Memory Apocalypse
Connecting to Our Journey: From Code Execution to Memory Management
In our previous story, **How .NET Code Runs with CLR, CTS, CLS, JIT, and GC — From Source to Silicon**, we traced a single line of C# code from its birth as source code through the CTS, CLS, JIT compilation tiers, and finally to silicon. We watched as the JIT transformed our Vector3D<Half> addition from unoptimized Tier 0 code into AVX-512-powered machine code.
But we left one critical question unanswered: Where does the data live?
When we created var vectorA = new Vector3D<Half>(Half.One, Half.Zero, Half.Zero)—where did those 6 bytes (3 × 2-byte Half values) actually go? When we allocate an array of a million vectors—how does .NET manage that memory? What happens when we're done with it?
The answer lies in the most misunderstood and maligned component of the .NET runtime: The Garbage Collector (GC).
Just as the JIT silently optimizes your code in the background, the GC silently manages your memory. In .NET 10, the GC has undergone revolutionary changes — most notably the Pinned Object Heap (POH) — that fundamentally alter how high-performance applications manage memory.
Let’s embark on a deep dive into the GC, the silent reaper that makes .NET memory-safe without sacrificing performance.
Why GC Exists: The Pre-.NET Nightmare
Before we understand the Garbage Collector, we must understand the problem it solves — a problem that haunted C++ developers for decades.
The Year is 1998. You’re a C++ developer.
You write code like this:
// C++ - The developer is responsible for EVERY byte
void ProcessUserData() {
    UserData* data = new UserData(1024);  // Allocate memory on heap

    if (data->IsValid()) {
        data->Process();
    }

    // Did you remember to delete?
    // What if Process() throws an exception?
    // What if someone else holds a pointer to 'data'?
    // What if we return 'data' to caller?

    delete data;  // If you forget: MEMORY LEAK
                  // If you double-delete: CRASH
                  // If you use after delete: CORRUPTION
}
The Three Deadly Sins of Manual Memory Management:

Real-world impact: In 2019, Microsoft estimated that 70% of all security vulnerabilities in their codebase were memory safety issues. Google Chrome’s vulnerability database shows a similar pattern — over 60% of “high severity” bugs are use-after-free errors.
The Garbage Collector isn’t just a convenience feature. It’s a security boundary.
Enter the Garbage Collector: .NET’s Promise
In 2002, .NET 1.0 introduced the Garbage Collector with a bold promise:
“You allocate. We clean. You never think about memory again.”
But reality is more complex. To write high-performance .NET applications, you must understand the GC. As of .NET 10, the GC has evolved into a sophisticated, adaptive memory manager with sub-millisecond pauses and hardware-aware optimizations.
Part II: The Foundation — How Memory Works in .NET
The Two Kingdoms: Stack vs Heap
Before understanding GC, you must understand where objects live. This distinction is the most important concept in .NET memory management.

The Stack: Your Code’s Scratchpad
The stack is a last-in, first-out (LIFO) data structure. Every time you call a method, the CLR pushes a stack frame. When the method returns, the frame is popped.
Stack Characteristics:
- Speed: Extremely fast (CPU register-level access)
- Size: Limited (1MB default for 64-bit .NET, configurable)
- Lifetime: Automatic (died when method returns)
- Content: Value types, references to heap objects, method parameters, return addresses
What Lives on the Stack:
public void DemonstrateStack()
{
    // ✅ ALL these live on the stack
    int age = 42;                    // 4-byte integer
    Half precision = Half.One;       // 2-byte half-float (NEW in .NET 10)
    Int128 bigNumber = 123456;       // 16-byte integer (NEW in .NET 10)
    Vector3D<Half> vector = new(1, 0, 0);  // struct - on stack!
    Span<byte> span = stackalloc byte[256]; // stack-allocated span

    // ❌ The array data lives on the heap, but 'array' reference is on stack
    int[] array = new int[1000];     // 'array' reference on stack, data on heap

    // The method ends - all stack values are GONE (no GC needed!)
}
Stack Frame Visualization:
HIGH MEMORY ADDRESS
+----------------------------------+
| Previous Stack Frame             |
+----------------------------------+
| Return Address (to caller)       |  ← Stack Frame for DemonstrateStack()
+----------------------------------+
| age (int) = 42                   |
+----------------------------------+
| precision (Half) = 0x3C00        |  (Half.One = 1.0 in binary16)
+----------------------------------+
| bigNumber (Int128) - 16 bytes    |
+----------------------------------+
| vector (Vector3D<Half>) - 6 bytes|
+----------------------------------+
| span (Span<byte>) - 2 fields     |  (pointer + length)
+----------------------------------+
| array (int[] reference) - 8 bytes|  → Points to heap
+----------------------------------+
LOW MEMORY ADDRESS (Stack Pointer)
The Managed Heap: The GC’s Domain
The heap is where long-lived and large objects live. Unlike the stack, the heap is not automatically cleaned when a method exits.
Heap Characteristics:
- Speed: Slower (requires pointer dereferencing, GC pauses)
- Size: Limited only by available RAM (theoretically)
- Lifetime: Managed by GC (automatic, non-deterministic)
- Content: Reference type instances, arrays, strings, boxed value types
What Lives on the Heap:
public void DemonstrateHeap()
{
    // ✅ ALL these live on the managed heap
    Person person = new Person();           // Class instance
    int[] numbers = new int[100000];        // Large array
    string text = "Hello, World!";          // String (immutable)
    object boxed = 42;                      // Boxed integer

    // ❌ The reference variables themselves are on the stack
    // 'person', 'numbers', 'text', 'boxed' are stack-based references
    // The objects they point to are on the heap
}
The Critical Distinction: Value Types vs Reference Types
This is the single most important concept for understanding GC behavior:

Code That Demonstrates the Difference:
// VALUE TYPE (struct) - Lives on stack, copied by value
public struct Point3D
{
    public float X, Y, Z;
    public Point3D(float x, float y, float z) { X = x; Y = y; Z = z; }
}

// REFERENCE TYPE (class) - Lives on heap, referenced by pointer
public class Person
{
    public string Name { get; set; }
    public int Age { get; set; }
}

public class MemoryDemonstration
{
    public static void DemonstrateValueVsReference()
    {
        // VALUE TYPE - Point3D lives on stack
        Point3D pointA = new Point3D(1, 2, 3);
        Point3D pointB = pointA;  // COMPLETE COPY - 12 bytes copied

        pointB.X = 99;  // Only pointB changes
        Console.WriteLine($"pointA.X: {pointA.X}");  // Still 1
        Console.WriteLine($"pointB.X: {pointB.X}");  // 99

        // REFERENCE TYPE - Person lives on heap, 'personA' is a reference (8 bytes on stack)
        Person personA = new Person { Name = "Alice", Age = 30 };
        Person personB = personA;  // COPY REFERENCE (8 bytes), NOT the object

        personB.Name = "Bob";  // Both personA and personB see the change!
        Console.WriteLine($"personA.Name: {personA.Name}");  // Bob
        Console.WriteLine($"personB.Name: {personB.Name}");  // Bob

        // The GC only cares about the Person object on the heap
        // Point3D will NEVER be seen by GC (stack-allocated)
    }
}
Part III: The Anatomy of the Managed Heap
The Generational Hypothesis: Young Objects Die Young
The .NET GC is built on a critical observation (the generational hypothesis):
“Most objects die young. The longer an object lives, the longer it will continue to live.”
This observation is empirically validated in almost all real-world applications:
- Temporary objects (loop counters, method locals) die within milliseconds
- Cache objects live for the entire application lifetime
- UI objects live as long as the window is open

Real numbers from a typical ASP.NET Core request:
- 85–95% of allocated objects die before the next GC
- Less than 5% survive to Gen1
- Less than 1% survive to Gen2
This observation drives the entire GC design: collect the young generation frequently and efficiently, and only occasionally scan the old generation.
The Three Generations: Gen0, Gen1, Gen2
The managed heap is divided into three generations (plus special heaps in .NET 10):

Gen0: The Nursery (Birthplace of Objects)
Every new object allocation starts in Gen0. This is the most frequently collected generation.
Characteristics:
- Size: Configurable (typically 256KB to 16MB depending on GC mode)
- Allocation speed: Extremely fast (pointer bump allocation)
- Collection trigger: When Gen0 fills up
- Collection type: Usually blocking (stop-the-world)
- Pause time: 0.5–2 milliseconds (extremely short in .NET 10)
Gen0 Allocation — The Pointer Bump:
// Conceptual representation of Gen0 allocation
public class Gen0Allocator
{
    private IntPtr _nextObjectPtr;  // Pointer to next free byte
    private IntPtr _endOfSegment;   // End of current Gen0 segment

    public IntPtr Allocate(int size)
    {
        // Align to pointer size (8 bytes on 64-bit)
        int alignedSize = (size + 7) & ~7;

        // Check if we have space
        if (_nextObjectPtr + alignedSize > _endOfSegment)
        {
            // Gen0 is full - TRIGGER GARBAGE COLLECTION!
            TriggerGen0Collection();
        }

        // Pointer bump - extremely fast (single CPU instruction)
        IntPtr allocated = _nextObjectPtr;
        _nextObjectPtr += alignedSize;

        // Zero out memory (security)
        Unsafe.InitBlockUnaligned(allocated.ToPointer(), 0, (uint)alignedSize);

        return allocated;
    }
}
The Magic of Pointer Bump Allocation:
Before allocation:
┌────────────────────────────────────────────┐
│ [Object A][Object B][FREE SPACE           ]│
│           ↑                                 │
│           Next Object Pointer               │
└────────────────────────────────────────────┘

After allocating Object C (size 16 bytes):
┌────────────────────────────────────────────┐
│ [Object A][Object B][Object C][FREE       ]│
│                      ↑                      │
│                      Next Object Pointer    │
└────────────────────────────────────────────┘

Time to allocate: ~1-2 CPU cycles (just an addition!)
Gen1: The Survivor Buffer
Gen1 serves as a buffer between the young and old generations. Objects that survive one Gen0 collection are promoted to Gen1.
Characteristics:
- Size: Approximately 2× Gen0 size
- Collection trigger: When Gen1 fills up from Gen0 promotions
- Collection type: Usually blocking (sometimes background)
- Pause time: 1–3 milliseconds
Why Gen1 Exists: Without Gen1, every object that survives one GC would go directly to Gen2. That would cause frequent, expensive full garbage collections. Gen1 acts as a “probation” area — objects that survive here are truly long-lived.
Gen2: The Old Folks Home
Gen2 contains long-lived objects — application caches, static data, service objects that live for the entire process lifetime.
Characteristics:
- Size: The entire heap minus ephemeral segment
- Collection trigger: When Gen1 fills (aggressive) or system memory pressure
- Collection type: Background (concurrent) in .NET 10
- Pause time: 2–10 milliseconds (dramatically improved in .NET 10)
Full GC (Gen2 Collection) — The Most Expensive Operation:
A full GC must examine every reachable object in the entire heap. This includes:
- All objects in Gen2
- All objects in Gen1
- All objects in Gen0
- All objects in LOH
- All objects in POH (just marks, doesn’t move)
Part IV: The GC in Action — A Step-by-Step Walkthrough
Scenario: A Web API Request
Let’s trace a complete GC cycle with a real-world example. Imagine an ASP.NET Core endpoint:
[ApiController]
[Route("api/[controller]")]
public class OrderController : ControllerBase
{
    private static readonly ConcurrentDictionary<int, Order> _cache = new();

    [HttpGet("{id}")]
    public async Task<ActionResult<OrderDto>> GetOrder(int id)
    {
        // STEP 1: Check cache (returns existing object from Gen2)
        if (_cache.TryGetValue(id, out Order cachedOrder))
        {
            // cachedOrder is in Gen2 (long-lived)
            return MapToDto(cachedOrder);  // Creates new OrderDto (Gen0)
        }

        // STEP 2: Fetch from database (creates temporary objects)
        using var connection = new SqlConnection(_connectionString);
        var orderData = await connection.QueryFirstOrDefaultAsync<OrderData>(
            "SELECT * FROM Orders WHERE Id = @Id", new { Id = id }
        );

        // STEP 3: Create new order (allocates Gen0)
        var order = new Order
        {
            Id = orderData.Id,
            CustomerName = orderData.CustomerName,
            Total = orderData.Total,
            Items = orderData.Items.Select(i => new OrderItem  // LINQ creates MORE Gen0 objects
            {
                ProductId = i.ProductId,
                Quantity = i.Quantity,
                Price = i.Price
            }).ToList()
        };

        // STEP 4: Add to cache (moves to Gen2 eventually)
        _cache.TryAdd(id, order);

        // STEP 5: Map to DTO (creates Gen0 OrderDto)
        return MapToDto(order);
    }

    private OrderDto MapToDto(Order order)
    {
        // Creates Gen0 objects
        return new OrderDto
        {
            Id = order.Id,
            CustomerName = order.CustomerName,
            Total = order.Total,
            ItemCount = order.Items.Count
        };
    }
}
Memory Timeline During This Request:

Detailed GC Cycle Breakdown:
Step 1: Allocation Phase (0–5ms)
// At T = 0ms
var dto = new OrderDto();  // Allocated in Gen0, pointer bump

// Memory state after allocation:
Gen0: [OrderDto][free space....
Gen1: [empty]
Gen2: [OrderCache][CachedOrder1][CachedOrder2]...
Step 2: Trigger Gen0 Collection (T = 5ms)
The Gen0 segment is full. The GC pauses the thread (very short — <1ms in .NET 10).
The Mark Phase (0.3ms): The GC walks through the stack and registers to find all root references:
- Static fields (the
_cachedictionary) - Local variables (the
dtoreference in the method) - CPU registers holding references
- Finalization queue

Live objects discovered:
_cachedictionary (Gen2) - reachable from static field- All cached Orders (Gen2) — reachable from dictionary
dto(Gen0) - reachable from stackorderData(Gen1) - reachable from stack- Temporary strings (Gen0) — reachable from orderData
Dead objects (garbage):
- Previous request’s DTOs that were never stored
- LINQ iterator objects after enumeration completed
- Transient calculation results
Step 3: The Sweep/Compact Phase (0.5ms)
Now the GC knows what’s live. For Gen0 collection, the GC compacts the survivors:

Critical .NET 10 Enhancement: The GC now uses segment-based compaction with improved algorithms that reduce pause times by 40% compared to .NET 8.
Step 4: Promotion (What Survives)
Objects that survive a Gen0 collection are promoted to Gen1:
// Conceptual representation of promotion
public class GCPromotion
{
    public void CollectGen0()
    {
        var survivors = FindLiveObjectsInGen0();

        foreach (var obj in survivors)
        {
            // Move from Gen0 to Gen1
            IntPtr newAddress = AllocateInGen1(obj.Size);
            CopyMemory(newAddress, obj.Address, obj.Size);
            UpdateAllReferences(obj.Address, newAddress);

            // Mark object as now in Gen1
            obj.Generation = 1;
        }

        // Reset Gen0 pointer (clear entire segment)
        ResetGen0();
    }
}
In our web request:
OrderDto(new) might survive if the caller holds a reference- Temporary strings likely die immediately (not promoted)
orderDatamight be promoted if it's still referenced
Step 5: Gen1 Collection (Occurs after ~10 Gen0 collections)
When Gen1 fills up (from promoted objects), a Gen1 collection occurs. This is more expensive because it examines both Gen0 and Gen1.
Gen1 Collection Process:

Step 6: Full GC (Gen2 Collection — The Big One)
A full GC examines the entire managed heap. This is the most expensive operation, but .NET 10 has dramatically improved it:
.NET 10 Full GC Improvements:
- Background Collection: Most of the work happens on a background thread
- Partial Pauses: Application threads only pause for 1–2ms at a time
- LOH Compaction: Large objects can now be compacted (opt-in)
When does a Full GC trigger?
- Gen2 segment is full
- System has low memory (GC.Collect() called by OS memory pressure)
- User explicitly calls
GC.Collect()(not recommended) - Process is shutting down
Part V: Special Heaps in .NET 10
The Large Object Heap (LOH): Home of the Giants
Objects larger than 85KB go to the Large Object Heap (LOH). This threshold exists because moving large objects is expensive.
Why 85KB?
- Moving a large object requires copying many bytes
- The cost of copying outweighs the benefit of compaction
- Large objects tend to be long-lived (arrays, buffers)
.NET 10 LOH Improvements:
- Background compaction (configurable)
- Segmented allocation (reduces fragmentation)
- Better alignment for SIMD operations
// What goes to LOH?
public class LargeObjectDemo
{
    public void DemonstrateLOH()
    {
        // ✅ Goes to LOH (size > 85KB)
        byte[] largeBuffer = new byte[90_000];      // 90KB - LOH
        int[] largeArray = new int[25_000];          // 100KB (4 bytes × 25k) - LOH
        string hugeString = new string('x', 50_000); // ~100KB - LOH

        // ❌ Stays in Gen0/Gen1/Gen2 (size ≤ 85KB)
        byte[] smallBuffer = new byte[80_000];       // 80KB - Normal heap
        int[] smallArray = new int[20_000];          // 80KB - Normal heap

        // .NET 10: Configurable LOH threshold
        // Add to runtimeconfig.json:
        // "configProperties": { "System.GC.LargeObjectHeapThreshold": 1000 }
        // Now objects >1KB go to LOH (useful for high-performance scenarios)
    }
}
LOH Fragmentation Problem (Pre-.NET 10):
// This pattern caused LOH fragmentation in older .NET versions
public class FragmentationDemo
{
    private List<byte[]> _buffers = new();

    public void CauseFragmentation()
    {
        // Allocate interleaved large objects
        for (int i = 0; i < 100; i++)
        {
            _buffers.Add(new byte[100_000]);  // LOH object 1
            _buffers.Add(new byte[90_000]);   // LOH object 2
            _buffers.Add(new byte[95_000]);   // LOH object 3

            // Release every other object
            if (i % 2 == 0)
            {
                _buffers[i * 3] = null;  // Creates holes
            }
        }

        // Now allocate a 200KB object
        byte[] bigBuffer = new byte[200_000];
        // May not fit in any hole → new segment allocated → fragmentation grows
    }
}
.NET 10 Solution — LOH Compaction:
// .NET 10: Compact LOH on demand or in background
public class LOHCompactionDemo
{
    public void CompactLOH()
    {
        // Option 1: Automatic background compaction (default in .NET 10)
        // Just run your app - GC handles it

        // Option 2: Force compaction on next full GC
        GCSettings.LargeObjectHeapCompactionMode =
            GCLargeObjectHeapCompactionMode.CompactOnce;
        GC.Collect();

        // Option 3: Disable compaction (for lowest latency)
        // runtimeconfig.json: "System.GC.LOHCompactionMode": 0
    }
}
The Pinned Object Heap (POH): .NET 10’s Game Changer
One of the most significant improvements in .NET 10 is the Pinned Object Heap (POH) . To understand why this matters, we need to understand the problem it solves.
The Problem: Pinning Causing Fragmentation
In pre-.NET 10 versions, when you needed to pass a buffer to native code, you had to pin it:
// Pre-.NET 10: Pinning causes GC fragmentation
public class LegacyPinning
{
    [DllImport("native.dll")]
    private static extern void ProcessBuffer(IntPtr buffer, int size);

    public void ProcessData(byte[] data)
    {
        // Pin the object so GC doesn't move it
        GCHandle handle = GCHandle.Alloc(data, GCHandleType.Pinned);
        try
        {
            ProcessBuffer(handle.AddrOfPinnedObject(), data.Length);
        }
        finally
        {
            handle.Free();  // Unpin
        }
    }
}
The Hidden Cost of Pinning:
When the GC compacts the heap (which it does frequently), pinned objects act as barriers:
Before compaction (fragmented):
┌────────────────────────────────────────────────────────┐
│ [A] [Free] [PINNED BUFFER] [Free] [B] [C] [Free] [D]  │
└────────────────────────────────────────────────────────┘

After compaction (with pinned object):
┌────────────────────────────────────────────────────────┐
│ [A] [B] [C] [D] [PINNED BUFFER] [Large Free Space]    │
└────────────────────────────────────────────────────────┘
                    ↑
            Everything after pinned object can't be moved
            This creates fragmentation over time!
Real-world impact: High-frequency P/Invoke applications would experience memory fragmentation over time, eventually leading to OutOfMemoryException despite having free memory (just not contiguous).
The Solution: Pinned Object Heap (POH) in .NET 10
// .NET 10: Zero-fragmentation pinning with POH
public class ModernPinning
{
    // ✅ Allocate directly on Pinned Object Heap
    private byte[] _pinnedBuffer = GC.AllocateArray<byte>(4096, pinned: true);

    [LibraryImport("native.dll")]
    private static partial void ProcessBuffer(nint buffer, int size);

    public void ProcessData()
    {
        // No GCHandle needed! Buffer is already pinned forever
        unsafe
        {
            fixed (byte* ptr = _pinnedBuffer)
            {
                ProcessBuffer((nint)ptr, _pinnedBuffer.Length);
            }
        }
        // POH objects never move, so NO FRAGMENTATION!
    }
}
POH Technical Details:

POH Performance Impact:

When to Use POH:
- ✅ High-frequency native interop (P/Invoke)
- ✅ Long-lived buffers (entire application lifetime)
- ✅ Performance-critical networking (socket buffers)
- ✅ Real-time applications (can’t afford GC pauses)
When NOT to Use POH:
- ❌ Short-lived buffers (allocation overhead > benefit)
- ❌ Very large buffers (>1MB) — POH has separate segments
- ❌ When memory is extremely constrained (POH adds ~4MB overhead)
Part VI: Finalization and Disposal — The Developer’s Role
The Problem: Unmanaged Resources
The GC manages managed memory (objects on the heap). But what about unmanaged resources?
public class ResourceUser
{
    // The GC has NO idea about these!
    private IntPtr _nativeHandle;      // Operating system handle
    private SqlConnection _connection;  // Database connection (wraps native resources)
    private FileStream _fileStream;     // File handle
    private Timer _timer;               // OS timer
}
If these aren’t cleaned up, you get:
- Handle leaks (can’t open more files)
- Connection pool exhaustion (database connections)
- Memory leaks (unmanaged memory not tracked by GC)
The Finalization Queue: GC’s Backup Cleaner
The Finalize() method (destructor in C# syntax) is a backup mechanism for cleaning unmanaged resources.
public class ResourceHolder
{
    private IntPtr _nativeHandle;

    // Destructor (Finalize method in IL)
    ~ResourceHolder()
    {
        // This is called by the GC when the object is collected
        // ONLY if no one called Dispose()!
        if (_nativeHandle != IntPtr.Zero)
        {
            NativeMethods.FreeHandle(_nativeHandle);
            _nativeHandle = IntPtr.Zero;
        }
    }
}
The Finalization Process:

The Critical Performance Problem with Finalizers:
// BAD: This object will survive an extra GC cycle
public class BadResource : IDisposable
{
    private IntPtr _handle;

    ~BadResource()  // Finalizer forces object to be resurrected
    {
        ReleaseHandle();
    }

    public void Dispose()
    {
        ReleaseHandle();
        GC.SuppressFinalize(this);  // Prevents finalizer from running
    }
}

// Performance impact:
// Object with finalizer:
// Gen0: Allocated → becomes unreachable → moved to finalization queue (survives GC)
// Gen1: Finalizer runs → becomes unreachable again
// Gen2: FINALLY collected
//
// That's TWO extra GC generations of survival!
The Dispose Pattern: The Right Way
The Dispose Pattern gives deterministic cleanup of unmanaged resources:
// The Gold Standard Dispose Pattern (complete example)
public class ManagedResource : IDisposable
{
    private IntPtr _nativeHandle;
    private SqlConnection _connection;
    private FileStream _fileStream;
    private bool _disposed = false;

    // Public method to clean up
    public void Dispose()
    {
        Dispose(true);
        GC.SuppressFinalize(this);  // Don't run finalizer - we already cleaned up
    }

    // Protected virtual method for inheritance
    protected virtual void Dispose(bool disposing)
    {
        if (_disposed) return;

        if (disposing)
        {
            // Clean MANAGED resources (IDisposable members)
            _connection?.Dispose();
            _fileStream?.Dispose();

            // Set to null to help GC (optional)
            _connection = null;
            _fileStream = null;
        }

        // Clean UNMANAGED resources (always, even if disposing = false)
        if (_nativeHandle != IntPtr.Zero)
        {
            NativeMethods.FreeHandle(_nativeHandle);
            _nativeHandle = IntPtr.Zero;
        }

        _disposed = true;
    }

    // Finalizer - ONLY as a safety net!
    ~ManagedResource()
    {
        Dispose(false);  // false = only clean unmanaged resources
    }

    // Example method that checks disposal
    public void DoWork()
    {
        if (_disposed)
            throw new ObjectDisposedException(nameof(ManagedResource));

        // Actual work
    }
}

// Using the pattern correctly
public class ResourceUser
{
    public void ProcessData()
    {
        // ✅ GOOD: Using statement ensures Dispose() is called
        using var resource = new ManagedResource();
        resource.DoWork();
        // Dispose() called automatically when leaving scope

        // ✅ GOOD: Manual try/finally for older C# versions
        ManagedResource resource2 = null;
        try
        {
            resource2 = new ManagedResource();
            resource2.DoWork();
        }
        finally
        {
            resource2?.Dispose();
        }
    }
}
The Dispose Flow Diagram:

.NET 10 Improvements to Finalization
.NET 10 includes several enhancements to finalization:
// .NET 10: Faster finalizer processing
public class NET10FinalizationDemo
{
    public void DemonstrateImprovedFinalization()
    {
        // 1. Critical finalizers (run faster, with fewer guarantees)
        //    Use for resources that MUST be cleaned (e.g., native memory)

        // 2. Finalizer queue optimization
        //    .NET 10 processes finalizers in parallel on servers

        // 3. Register for finalization notification
        GC.RegisterForFullGCNotification(10, 10);

        // 4. New: Wait for specific finalizers
        // GC.WaitForPendingFinalizers(timeout) - .NET 10
    }
}

// Example of SafeHandle (better than manual finalization)
public class SafeNativeHandle : SafeHandleZeroOrMinusOneIsInvalid
{
    public SafeNativeHandle() : base(true) { }

    protected override bool ReleaseHandle()
    {
        // Called by GC, guaranteed to run (unlike finalizer)
        return NativeMethods.FreeHandle(handle);
    }
}

// Using SafeHandle (RECOMMENDED over manual finalization)
public class BetterResource : IDisposable
{
    private readonly SafeNativeHandle _safeHandle;
    private readonly SqlConnection _connection;

    public BetterResource()
    {
        _safeHandle = new SafeNativeHandle();
        _connection = new SqlConnection();
    }

    public void Dispose()
    {
        _safeHandle.Dispose();  // SafeHandle implements IDisposable
        _connection.Dispose();
    }
}
Part VII: GC Modes and Configuration in .NET 10
Workstation vs Server GC
.NET 10 supports multiple GC modes optimized for different workloads:
<!-- runtimeconfig.json -->
{
  "configProperties": {
    "System.GC.Server": true,           // Server GC (default: false for desktop)
    "System.GC.Concurrent": true,       // Background GC (default: true)
    "System.GC.PinnedObjectHeap": true, // Enable POH (default: true in .NET 10)
    "System.GC.HeapCount": 8,           // Explicit heap count for server GC
    "System.GC.HeapHardLimit": 1073741824,  // 1GB hard limit
    "System.GC.HeapHardLimitPercent": 75,   // 75% of physical memory
    "System.GC.NoAffinitize": false,    // Affinitize heaps to CPUs
    "System.GC.LargeObjectHeapCompactionMode": 1  // Enable LOH compaction
  }
}
Mode Comparison:

Programmatically Configure GC in .NET 10:
public class GCConfigurationDemo
{
    public static void ConfigureForWorkload()
    {
        // .NET 10: Query current configuration
        Console.WriteLine($"Is Server GC: {GCSettings.IsServerGC}");
        Console.WriteLine($"Latency Mode: {GCSettings.LatencyMode}");
        Console.WriteLine($"POH Enabled: {GC.PinnedObjectHeapEnabled}");

        // Switch to low-latency mode for real-time processing
        if (IsRealTimeWorkload())
        {
            GCSettings.LatencyMode = GCLatencyMode.LowLatency;

            // Also try to start No-GC region
            if (GC.TryStartNoGCRegion(50 * 1024 * 1024, true))
            {
                try
                {
                    ProcessRealTimeData();
                }
                finally
                {
                    GC.EndNoGCRegion();
                }
            }
        }

        // For batch processing, use SustainedLowLatency
        if (IsBatchWorkload())
        {
            GCSettings.LatencyMode = GCLatencyMode.SustainedLowLatency;
        }
    }

    private static bool IsRealTimeWorkload() => false;
    private static bool IsBatchWorkload() => false;
    private static void ProcessRealTimeData() { }
}
GC Monitoring and Metrics in .NET 10
.NET 10 provides detailed GC metrics:
public class GCMonitoringDemo
{
    public static void MonitorGC()
    {
        // Get comprehensive GC metrics
        GCMemoryInfo info = GC.GetGCMemoryInfo();

        Console.WriteLine($"=== GC Memory Info (.NET 10) ===");
        Console.WriteLine($"Total committed: {info.TotalCommittedBytes / 1024 / 1024} MB");
        Console.WriteLine($"Heap size: {info.HeapSizeBytes / 1024 / 1024} MB");
        Console.WriteLine($"Fragmentation: {info.FragmentationBytes / 1024} KB");
        Console.WriteLine($"POH size: {info.PinnedObjectHeapSizeBytes / 1024} KB");
        Console.WriteLine($"Generation: {info.Generation}");
        Console.WriteLine($"Pause duration: {info.PauseDurationMs}ms");
        Console.WriteLine($"Pause time percentage: {info.PauseTimePercentage}%");

        // Register for GC notifications (proactive)
        GC.RegisterForFullGCNotification(10, 10);

        // Background thread to monitor
        Task.Run(() =>
        {
            while (true)
            {
                GCNotificationStatus status = GC.WaitForFullGCApproach();
                if (status == GCNotificationStatus.Succeeded)
                {
                    Console.WriteLine("WARNING: Full GC approaching!");
                    Console.WriteLine($"Current memory: {GC.GetTotalMemory(false) / 1024 / 1024} MB");

                    // Opportunity to clear caches, reduce memory pressure
                    ClearApplicationCaches();
                }

                status = GC.WaitForFullGCComplete();
                if (status == GCNotificationStatus.Succeeded)
                {
                    Console.WriteLine("Full GC completed");
                    Console.WriteLine($"Memory after GC: {GC.GetTotalMemory(true) / 1024 / 1024} MB");

                    // Rebuild caches as needed
                    RebuildCaches();
                }

                Thread.Sleep(1000);
            }
        });
    }

    private static void ClearApplicationCaches() { }
    private static void RebuildCaches() { }
}
Part VIII: GC Performance Best Practices
DO’s and DON’Ts for .NET 10
✅ DO: Use Value Types for Small, Short-Lived Data
// ✅ GOOD: Struct on stack - no GC pressure
public struct Point { public int X, Y; }

public void ProcessPoints()
{
    Span<Point> points = stackalloc Point[100];  // 800 bytes on stack
    for (int i = 0; i < points.Length; i++)
    {
        points[i] = new Point { X = i, Y = i * 2 };
    }
    // No GC allocation at all!
}
❌ DON’T: Box Value Types Unnecessarily
// ❌ BAD: Boxing creates heap allocations
public void ProcessItems(ArrayList list)  // ArrayList stores object
{
    foreach (var item in list)  // Each access unboxes
    {
        int value = (int)item;   // Unboxing cost
    }
}

// ✅ GOOD: Use generics to avoid boxing
public void ProcessItems(List<int> list)  // List<T> stores int directly
{
    foreach (int value in list)  // No boxing/unboxing
    {
        // Use value directly
    }
}
✅ DO: Use Object Pooling for Frequently Allocated Types
// ✅ GOOD: Pool reusable objects
public class ObjectPoolDemo
{
    private static readonly ArrayPool<byte> _bufferPool = ArrayPool<byte>.Shared;
    private static readonly ObjectPool<StringBuilder> _stringBuilderPool =
        new DefaultObjectPool<StringBuilder>(new StringBuilderPooledObjectPolicy());

    public void ProcessData()
    {
        // Rent from pool instead of allocating new
        byte[] buffer = _bufferPool.Rent(4096);
        try
        {
            // Use buffer
            ProcessBuffer(buffer);
        }
        finally
        {
            // Return to pool for reuse
            _bufferPool.Return(buffer);
        }

        // StringBuilder pooling
        var sb = _stringBuilderPool.Get();
        try
        {
            sb.Append("Building string");
            sb.Append(" without allocations");
            var result = sb.ToString();
        }
        finally
        {
            _stringBuilderPool.Return(sb);
        }
    }

    private void ProcessBuffer(byte[] buffer) { }
}
❌ DON’T: Force Garbage Collection
// ❌ BAD: Never call GC.Collect() in production code
public void BadPractice()
{
    GC.Collect();           // Forces full GC - terrible for performance
    GC.WaitForPendingFinalizers();  // Blocks until finalizers run
    GC.Collect();           // Double collect to ensure finalizers did their job
}

// ✅ GOOD: Let GC manage itself (except in rare cases)
public void GoodPractice()
{
    // The only valid reasons to call GC.Collect():

    // 1. Application is idle and you know memory pressure is high
    if (IsApplicationIdle() && HasHighMemoryPressure())
    {
        GC.Collect(2, GCCollectionMode.Optimized);
    }

    // 2. Running a benchmark (measuring memory usage)
    BenchmarkRunner.Run();

    // 3. Testing finalization behavior (unit tests)
    [TestMethod]
    public void TestFinalizer()
    {
        var obj = new TestClass();
        obj = null;
        GC.Collect();
        GC.WaitForPendingFinalizers();
        Assert.IsTrue(objWasFinalized);
    }
}
✅ DO: Implement Dispose Pattern Correctly
// ✅ GOOD: Complete disposable pattern
public sealed class SealedDisposable : IDisposable  // Sealed = no inheritance complexity
{
    private IntPtr _nativeHandle;
    private FileStream _fileStream;
    private bool _disposed;

    public void Dispose()
    {
        if (_disposed) return;

        // Clean managed resources
        _fileStream?.Dispose();

        // Clean unmanaged resources
        if (_nativeHandle != IntPtr.Zero)
        {
            NativeMethods.FreeHandle(_nativeHandle);
            _nativeHandle = IntPtr.Zero;
        }

        _disposed = true;

        // No finalizer needed for sealed class!
    }
}

// Using statement ensures Dispose called
using var resource = new SealedDisposable();
// Use resource
❌ DON’T: Implement Finalizers Unless Absolutely Necessary
// ❌ BAD: Finalizer for managed-only resources
public class BadFinalizer
{
    private List<int> _data;  // Managed resource!

    ~BadFinalizer()  // Completely unnecessary
    {
        // GC already manages _data!
    }
}

// ✅ GOOD: No finalizer for managed resources
public class GoodClass
{
    private List<int> _data;  // GC handles this automatically
    // No finalizer needed
}
✅ DO: Use Weak References for Caches
// ✅ GOOD: WeakReference allows GC to collect cached items under memory pressure
public class WeakCache<TKey, TValue> where TValue : class
{
    private readonly Dictionary<TKey, WeakReference<TValue>> _cache = new();

    public void Add(TKey key, TValue value)
    {
        _cache[key] = new WeakReference<TValue>(value);
    }

    public bool TryGet(TKey key, out TValue value)
    {
        if (_cache.TryGetValue(key, out var weakRef) &&
            weakRef.TryGetTarget(out value))
        {
            return true;
        }

        value = null;
        return false;
    }

    // Clean up dead references periodically
    public void Cleanup()
    {
        var deadKeys = _cache
            .Where(kvp => !kvp.Value.TryGetTarget(out _))
            .Select(kvp => kvp.Key)
            .ToList();

        foreach (var key in deadKeys)
        {
            _cache.Remove(key);
        }
    }
}

// Usage: Cache that doesn't leak memory
public class ImageCache
{
    private readonly WeakCache<string, Bitmap> _cache = new();

    public Bitmap GetImage(string path)
    {
        if (_cache.TryGet(path, out var cached))
            return cached;

        var image = new Bitmap(path);
        _cache.Add(path, image);
        return image;
    }

    // Called occasionally
    public void OnMemoryWarning()
    {
        _cache.Cleanup();
        GC.Collect();  // Acceptable here - memory pressure is real
    }
}
Part IX: Real-World GC Analysis
Diagnosing GC Issues with .NET 10 Tools
// Enable GC logging in .NET 10
// Add to environment variables or runtimeconfig.json:
// DOTNET_GCLog=gc.log
// DOTNET_GCStats=1

public class GCDiagnosticDemo
{
    public static void AnalyzeGC()
    {
        // Get GC generation counts
        Console.WriteLine($"Gen0 collections: {GC.CollectionCount(0)}");
        Console.WriteLine($"Gen1 collections: {GC.CollectionCount(1)}");
        Console.WriteLine($"Gen2 collections: {GC.CollectionCount(2)}");

        // Get total memory
        Console.WriteLine($"Total memory: {GC.GetTotalMemory(false) / 1024 / 1024} MB");

        // Get detailed metrics
        for (int i = 0; i < 3; i++)
        {
            var info = GC.GetGCMemoryInfo();
            Console.WriteLine($"Gen{i} size: {info.GenerationalInfo[i].SizeAfterBytes / 1024} KB");
        }

        // Detect GC pressure
        var info2 = GC.GetGCMemoryInfo();
        if (info2.PauseTimePercentage > 10)
        {
            Console.WriteLine($"WARNING: GC taking {info2.PauseTimePercentage}% of time!");
            Console.WriteLine($"Consider: tuning GC mode, reducing allocations, or pooling");
        }
    }
}
Common GC Patterns and Solutions

Part X: Conclusion — The Silent Reaper’s Evolution
Summary of .NET 10 GC Advancements
The journey from .NET 1.0 to .NET 10 represents a fundamental transformation in memory management:

The Final Word
The Garbage Collector is not your enemy. It’s a sophisticated, adaptive memory manager that has evolved over 23 years to handle virtually every workload imaginable. In .NET 10, with the Pinned Object Heap, background LOH compaction, and default PGO, the GC is more capable than ever.
Key takeaways from our journey:
- The Stack vs Heap distinction is fundamental — Value types on stack = zero GC pressure
- Generations work — 85–95% of objects die in Gen0
- Pinning causes fragmentation — Use .NET 10’s POH for high-frequency interop
- Finalizers are safety nets, not primary cleanup — Implement Dispose() correctly
- Object pooling reduces GC pressure — ArrayPool, ObjectPool
- Never call GC.Collect() — Except for benchmarks or specific diagnostics
- Monitor your GC — Use GC.GetGCMemoryInfo() and ETW events
The next time you hear someone say “.NET GC is slow” or “garbage collection causes pauses,” you’ll know the truth. The .NET 10 GC is a marvel of engineering — capable of sub-millisecond pauses, processing millions of allocations per second, and providing memory safety without sacrificing performance.
The Silent Reaper has evolved. And in .NET 10, it’s faster, smarter, and less intrusive than ever before.
Further reading : **How .NET Code Runs with CLR, CTS, CLS, JIT, and GC — From Source to Silicon**
References
- “Beyond dotnet run: A .NET 10 Developer’s Journey to the Metal” — Previous story in this series
- “.NET 10: CLR, CTS, CLS, JIT, and GC — The Silent Guardians Architectural Deep Dive” — Reference document
- “Garbage Collection: Automatic Memory Management in the Microsoft .NET Framework” — MSDN
- .NET 10 GC Documentation — Microsoft Learn (aka.ms/dotnet10-gc)
- “Writing High-Performance .NET Code” — Ben Watson (2nd Edition)
“Memory is just a resource. The GC is just a manager. Understanding them both is the path to performance.” — Unknown .NET Performance Engineer
📌 Save this story to your reading list — it helps other developers discover it. � Questions? Feedback? Comment? leave a response below. If you’re implementing something similar and want to discuss architectural tradeoffs, I’m always happy to connect with fellow engineers tackling these challenges.
- **Medium** — mvineetsharma.medium.com
- **LinkedIn** — www.linkedin.com/in/vineet-sharma-architect
In-depth .NET, Node.js, Python, Cloud Architecture, and System Design. New articles weekly
메타데이터
- post_id
- 687ecf2fd774
- slug
- how-garbage-collection-works-in-net-10-heap-stack-generations-from-allocation-to-reclamation-687ecf2fd774
- url
- https://medium.com/@mvineetsharma/how-garbage-collection-works-in-net-10-heap-stack-generations-from-allocation-to-reclamation-687ecf2fd774
- canonical_url
- https://medium.com/@mvineetsharma/how-garbage-collection-works-in-net-10-heap-stack-generations-from-allocation-to-reclamation-687ecf2fd774
- author_url
- https://medium.com/@mvineetsharma
- status
- ok
- fetched_at
- 2026-08-04 03:08:29