Why The Transatlantic Relationship Matters
The Scale of Trade, Depth of Mutual Integration, Innovation Strength, and Governance Present an Unmatched Source of Global Potential
Why The Transatlantic Relationship Matters
The Scale of Transatlantic Trade, Depth of Mutual Integration, Innovation Strength, and Governance Frameworks Present an Unmatched Source of Global Potential and Influence.
Not a Medium member, read here.
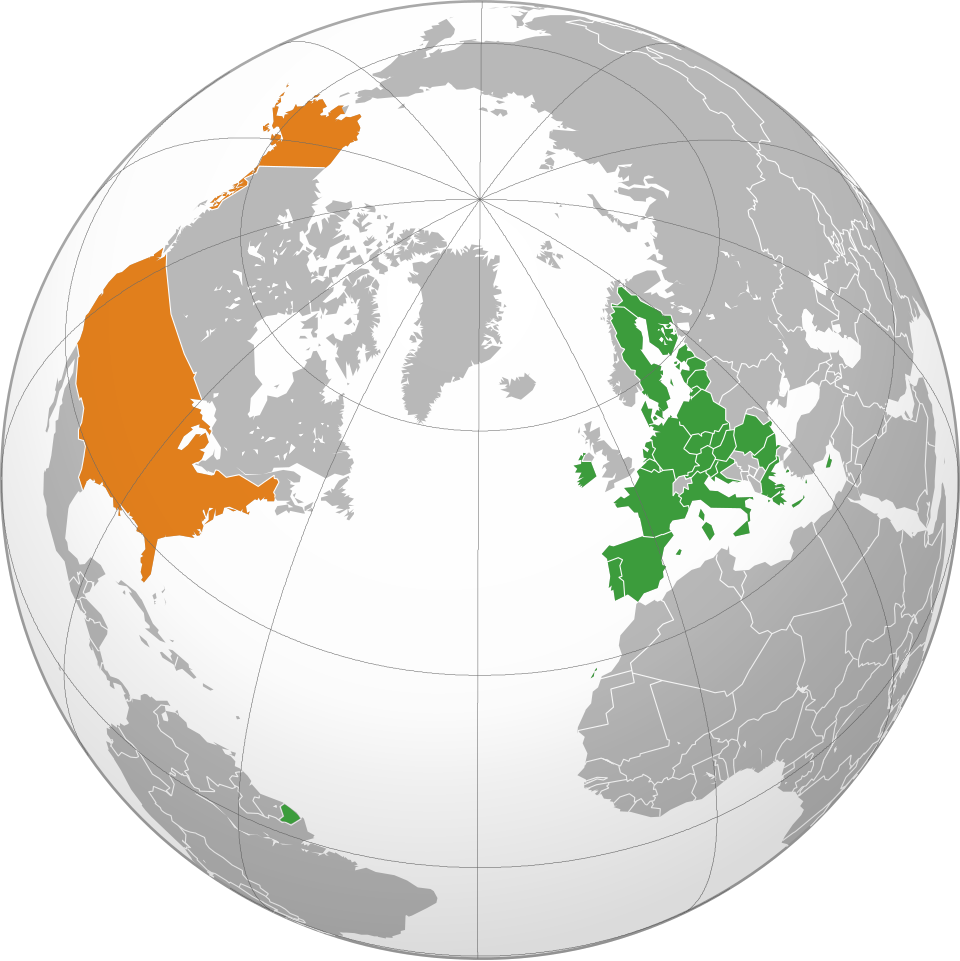
Despite the blitzkrieg launched against the Transatlantic relationship, it matters fundamentally because of deep mutually beneficial integration, common values and economic enablers. The scale, depth and future prospects ensure that the Transatlantic relationship eclipses all other global social and economic relationships today.
This article briefly compares the Transatlantic economic relationship against the US-China, and EU-China for trade in goods and services, foreign direct investment (FDI), and innovation strength.
Mark Timberlake is a reader-supported publication. Join a community who share a concern for the future. Participate in the comments section, or become a free subscriber.
In 2024, transatlantic trade between the US and EU represented 30% of global trade, and 43% of global GDP. Europe-US trade in goods & services was over $2 trillion. Every day, goods and services worth more than $5.5 billion cross the Atlantic. [1]
While in 2024, EU-China trade in goods and services exceeded US$972 billion, and US-China goods and services trade was estimated at $662 billion. However, Europe and the US have significant trade deficits with China. [Figure 2]
The scale and depth of Transatlantic integration becomes clear when comparing the Transatlantic relationship with the US-China and EU-China relationships for total two-way trade, foreign direct investment and innovation strength.

Figure 1; Foreign Direct Investment Stock; source: https://www.bea.gov/news/2025/direct-investment-country-and-industry-2024
The scale of transatlantic trade, and depth of integration are grounded in historical connections, and common cultural foundations. Mutual foreign direct investments between the US and Europe exceed the rest of the world combined. (Figure 1)
The US/EU mutual FDI is $7.6 trillion, generating employment for a combined 16 million workers on both sides of the Atlantic. [2]
As of 2024, US investment stock in EU/UK was $3.97 trillion, most of this directed towards manufacturing, with significant investments in financial services and insurance. [Figure 1]
While the EU/UK investment stock in the US was $3.64 trillion primarily invested in chemicals, technology, electronic products, with significant investments in finance, insurance, and wholesale trade. [Figure 1]
The US and EU are heavily invested in each other’s real economy.

Figure 2; US-UK-EU-China Goods and Services Trade, and FDI stock
By comparison, foreign direct investments involving China are relatively small. In 2024, the EU’s investment stock in China stood at $277 billion, and China’s investment stock in the EU was $84 billion. While, as of 2024, US investment stock in China was $123 billion, and China’s investment stock in the US was just $40 billion. [Figure 2]
Even trade and integration within Europe eclipses EU-China trade and investment. The UK is the EU’s second largest trade and investment partner following the US. In 2023, the total trade in goods and services between the UK and EU was $1,186.5 billion compared with EU-China at $972 billion. As of 2024, mutual UK-EU FDI stock amounted to $3,488.7 billion, compared with mutual UK-China plus EU-China FDI stock limping in at $386.7 billion. And Switzerland — a country with a population of less than 10 million — is the EU’s fourth largest trade partner. [Figure 2]

Figure 3; EU Foreign Direct Investment in the Rest of the World, (expressed as a percentage of the total)
By the end of 2024, the EU direct investment stock in the US was $3,066 billion, which represented about 28.7% of total EU FDI stock in the rest of the world, followed by the UK ($2,079 billion, 19.5%). While China accounted for just 2.6% of total EU FDI stock. [Figures 2,3]
In 2023, European investment amounted to 64% of the total stock of foreign investment in the US. [3]

Figure 4; Rest of the World Foreign Direct Investment in the EU (expressed as a percentage of the total)
The US accounted for 31% ($2,501 billion) of the total FDI held by the rest of the world in the EU, the UK followed with 17.5% ($1,408 billion) while China held just 1.1% [Figures 2,4]
At the end of 2023, FDI stock from the UK into the US was $671.2 billion, which accounted for 27.0% of the total UK outward FDI stock. [3]
At the end of 2023, the FDI stock from the US into the UK was $906.3 billion, representing 31.8% of the total UK inward FDI stock. [3]
In the period from 2009 — 2023, US investments in Europe accounted for 56% of the total stock of US outward investment globally. [4]
Since the 1990s, China deliberately engaged in global industrial espionage and IP theft. China was not interested in building its economy over decades; instead, it determined to steal industrial capability on a massive scale to short circuit the long-term investments that the West had to make to build its industrial capability.
China deliberately fostered elite capture in all countries that it sought to shift into strategic dependence upon China. This strategy was enormously successful in Germany: ultimately, over 5,000 major German industrial companies shipped operations and investments to China.
China also pursued an opportunistic zero-sum approach through Chinese market access restrictions and demands on foreign companies to surrender IP if they wanted to do business in China.
The scale of the plan re-oriented global manufacturing, so that China became the largest trade partner for 120 countries, exporting 35% of global manufactures, and in the process China gained a modern manufacturing workforce with technical capability unmatched anywhere in the world. [5]
The result has been a massive transfer of wealth and economic power from the West to China.
However despite all this, China’s nominal GDP is just 37% of the transatlantic economy. (based on IMF 2026 data) [6]
China has poor overall governance. National policies are mostly top-down commands with no or outline implementation directives; provincial governments and companies are expected to resolve the implementation details. Infrastructure and services are chaotic, for example the health system was on the verge of collapse during the pandemic, and China’s energy distribution network experienced frequent power outages over the same period.
Further, China’s economy is in structural decline, weighed down by a property crisis, massive debt driven infrastructure spending, and a population in irreversible decline: demographic studies suggest its population could fall to between 400–700 million by 2100.
The US and Europe actively pursued mutual trade and investment integration. China, however, is a mercantilist power: it heavily regulates the economy, rejects economic integration, and it incorporates state subsidised exports to dominate overseas markets with selective export controls as tools of state power.
[1] https://www.consilium.europa.eu/en/policies/united-states/
[2] https://atlantic-convergence.net/wp-content/uploads/2025/10/transatlantic-economy-2025-final.pdf
[5] https://geopoliticaleconomy.com/2024/01/31/china-world-manufacturing-superpower-production/
[6] https://www.imf.org/external/datamapper/NGDPD@WEO/EU/CHN/USA
Taking action starts with becoming engaged and informed. Subscribe for free.
Innovation Strength
The number of unicorns — startups that pass a $1B valuation — and the rate at which they are created is a metric of innovation strength.
While Tech unicorns reflect innovation strength. Non-tech unicorns reflect a broader range of innovative strengths: from disruptive business models; innovative approaches to market strategy, technology integration, operations and supply chains; access to venture capital; superior operational capability; superior infrastructure and services; and access to skills.
The number and rate of creation of non-tech unicorns suggests economic resilience, the depth of enabling capabilities, stable and varied funding, and employment growth.

The number of companies founded since 1990 that reached $1B valuation; Chart: Dealroom.co
Over the ten year period from 2012 to 2021, Europe created 296 unicorns, the UK added approximately 100. Over the same period, China created 276.
The chart above shows that for the period 2012 to 2021, Europe realised an accelerating growth in the number of unicorns created. The number of new unicorns in the UK grows but at a more modest rate. The graph for China shows a sudden increase in the number of new unicorns from 2014, overtaking Europe in 2016, but the growth rate slows by 2018, falling behind Europe by 2021. In 2021, Europe created 72 new unicorns, while China created 22 unicorns.
The sudden increase in the number of Chinese unicorns from 2014 corresponds to Apple’s 2014 commitment to spend US$275 billion in China training Chinese workers, building and installing custom equipment and machine tools in its Chinese suppliers’ factories. Several Chinese unicorns are part of the Apple supply chain.
The period from 2019 to 2021 corresponded to the COVID pandemic. Over this period, Europe’s growth in new unicorns rises almost asymptotically, while China’s falters. Europe demonstrated greater resilience to the disruption during the pandemic, while China was paralysed by chaos, and snap lockdowns.
In 2021, the US created 275 unicorns, and venture capital investment into the US was at least $140 billion.
As of 2024, The US has created 1,720 unicorns, Europe (including the UK) created 584 unicorns, and China created 438 unicorns.

Cities that host unicorns as of 2024; source: Dealroom.co
As of 2024, globally, 420+ cities were home to a Unicorn, of which over 100 cities are located in the US, 70 cities are in Europe, and 30 cities are located in China.
Contrary to the hand-wringing in the US over China’s technology advances, the Transatlantic relationship demonstrates superior tech and non-tech innovation strength.
US efforts to block or delay China’s advances in technology are unlikely to succeed and only distract from productive efforts to accelerate the considerable innovation strength within the Transatlantic relationship.
https://dealroom.co/guides/unicorns
https://sifted.eu/articles/europe-china-unicorn
Support writers directly. Mark Timberlake is a reader-supported publication. To receive new posts and support my work, please consider becoming a free subscriber.
Why Read This?
Thank you for reading this article. I write across Climate and Environment, Future, Geopolitics, Society, Technology, occasional creative writing, podcasts and more. If you would like to receive research based articles offering insights, analysis, and critical commentary then please consider subscribing, which is free.
The Value You Receive From Each Article And Podcast
- These articles and podcasts provide in-depth analysis
- They are extensively researched
- Written to be comprehensive, but in a summarised, and highly readable form
- Offering Insightful, critical commentary
- Save time and become critically informed
- Articles and podcasts contain analysis and insights not readily available through mainstream media
Stay up-to-date
Support writers directly. Never miss an update — every new article and podcast is sent directly to your email inbox. Only free subscribers receive podcasts. Support my work directly with a free subscription.
Taking Action
The state of the world should concern us all. Taking action starts with becoming engaged and informed. For my part, I write these articles and podcasts to provide insights and ideas towards a new narrative, a new vision for our world.
Be part of a community of people who share a concern for the future. Participate in the comments section, or support this work with a free subscription.

메타데이터
- post_id
- 68fbc1bc39c1
- slug
- why-the-transatlantic-relationship-matters-68fbc1bc39c1
- url
- https://medium.com/the-geopolitical-economist/why-the-transatlantic-relationship-matters-68fbc1bc39c1
- canonical_url
- https://medium.com/the-geopolitical-economist/why-the-transatlantic-relationship-matters-68fbc1bc39c1
- author_url
- https://medium.com/@marktimberlake
- status
- ok
- fetched_at
- 2026-06-24 18:57:25