MACD Indicator: A Beginner’s Guide to Understanding Market Trends and Momentum
Introduction
MACD Indicator: A Beginner’s Guide to Understanding Market Trends and Momentum
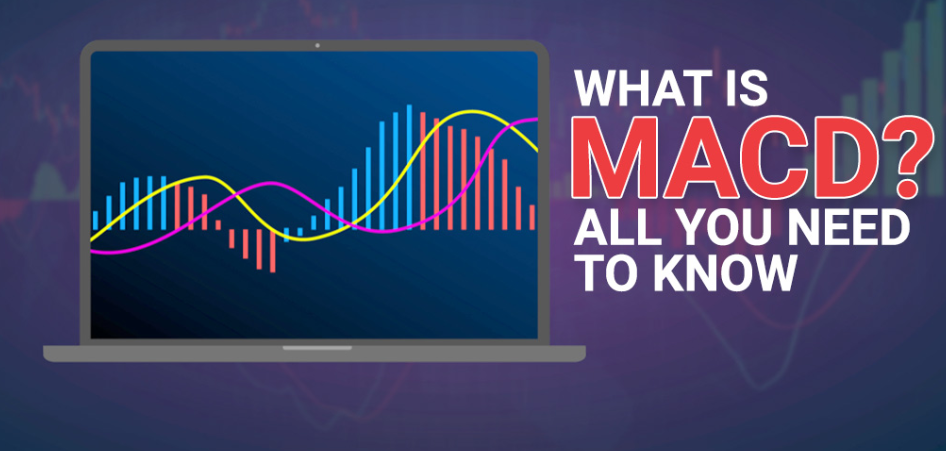
MACD indicator
Introduction
The Moving Average Convergence Divergence (MACD) Indicator is one of the most popular technical analysis tools used by traders and investors worldwide. Whether you trade stocks, forex, cryptocurrencies, or commodities, the MACD can help you identify market trends, momentum, and potential buy or sell opportunities.
Developed by Gerald Appel in the late 1970s, the MACD combines the power of moving averages with momentum analysis, making it a versatile indicator for both beginners and experienced traders. In this article, we will explain what the MACD Indicator is, how it works, how to interpret its signals, and how traders use it in real-world market situations.
What is the MACD Indicator?
MACD stands for Moving Average Convergence Divergence. It is a trend-following momentum indicator that shows the relationship between two moving averages of a security’s price.
The MACD helps traders answer three important questions:
- Is the market trending up or down?
- How strong is the current trend?
- When might the trend change direction?
By analyzing the difference between short-term and long-term moving averages, the MACD provides valuable insights into market momentum and potential trading opportunities.
Components of the MACD Indicator
The MACD consists of three main components:
1. MACD Line
The MACD Line is calculated by subtracting the 26-period Exponential Moving Average (EMA) from the 12-period EMA.
MACD Line = 12 EMA — 26 EMA
This line reflects the difference between short-term and long-term price momentum.
2. Signal Line
The Signal Line is a 9-period EMA of the MACD Line.
It helps traders identify potential buy and sell signals when it crosses above or below the MACD Line.
3. Histogram
The Histogram represents the difference between the MACD Line and the Signal Line.
- Positive histogram bars indicate bullish momentum.
- Negative histogram bars indicate bearish momentum.
- Larger bars suggest stronger momentum.
How Does MACD Work?
The MACD measures the relationship between two moving averages.
When the short-term EMA moves above the long-term EMA, the MACD becomes positive, indicating bullish momentum.
When the short-term EMA moves below the long-term EMA, the MACD becomes negative, indicating bearish momentum.
The indicator continuously adjusts to price changes, helping traders identify shifts in market direction.
MACD Buy Signals
Bullish Crossover
A bullish crossover occurs when the MACD Line crosses above the Signal Line.
This is often interpreted as a buy signal because it suggests increasing upward momentum.
Example
Suppose a stock has been trading sideways for several weeks. Suddenly, the MACD Line crosses above the Signal Line while the price begins to rise.
Many traders would consider this a potential buying opportunity.
MACD Sell Signals
Bearish Crossover
A bearish crossover occurs when the MACD Line crosses below the Signal Line.
This suggests weakening momentum and may indicate a selling opportunity.
Example
If a stock has been rising steadily and the MACD Line crosses below the Signal Line, traders may see this as an early warning that the uptrend is losing strength.
Understanding MACD Divergence
Divergence is one of the most powerful signals provided by the MACD.
Bullish Divergence
Bullish divergence occurs when:
- Price makes lower lows.
- MACD makes higher lows.
This indicates that selling pressure may be weakening and a price reversal could occur.
Bearish Divergence
Bearish divergence occurs when:
- Price makes higher highs.
- MACD makes lower highs.
This suggests that buying momentum is weakening and prices may decline.
MACD and Trend Confirmation
The MACD can also help confirm trends.
Uptrend Confirmation
When:
- MACD is above zero.
- MACD Line remains above Signal Line.
The market is generally considered bullish.
Downtrend Confirmation
When:
- MACD is below zero.
- MACD Line remains below Signal Line.
The market is generally considered bearish.
Using MACD for trend confirmation helps traders avoid entering trades against the prevailing market direction.
Advantages of the MACD Indicator
Easy to Understand
MACD is beginner-friendly and visually simple to interpret.
Combines Trend and Momentum
Unlike many indicators that focus on only one aspect of the market, MACD provides information about both trend direction and momentum.
Works Across Multiple Markets
MACD can be applied to:
- Stocks
- Forex
- Cryptocurrencies
- Commodities
- Indices
Helps Identify Reversals
Crossovers and divergences often provide early warnings of potential trend changes.
Limitations of the MACD Indicator
Lagging Indicator
Since MACD is based on moving averages, it reacts to price changes after they occur.
False Signals
In sideways or highly volatile markets, MACD may generate multiple false signals.
Not Perfect Alone
Professional traders often combine MACD with:
- Support and resistance levels
- Trend lines
- Volume analysis
- Relative Strength Index (RSI)
Using multiple tools can improve trading accuracy.
Best Practices for Using MACD
Use Multiple Time Frames
Analyze MACD on higher time frames to identify the primary trend and lower time frames for entry opportunities.
Confirm Signals
Do not rely solely on MACD crossovers. Look for confirmation from price action and other indicators.
Manage Risk
Always use stop-loss orders and proper position sizing to protect your trading capital.
Avoid Emotional Trading
Follow your trading plan rather than reacting emotionally to short-term market fluctuations.
Real-World Example
Imagine a stock trading at ₹500.
- The MACD Line crosses above the Signal Line.
- The histogram turns positive.
- Price breaks above a resistance level.
These combined signals suggest increasing bullish momentum.
A trader may enter a long position while setting a stop-loss below recent support levels.
As the trend continues, the trader can monitor the MACD for signs of weakening momentum or a bearish crossover to decide when to exit the trade.
Conclusion
The MACD Indicator is one of the most effective and widely used tools in technical analysis. It helps traders identify trends, measure momentum, and spot potential entry and exit opportunities. By understanding MACD crossovers, divergences, and trend confirmations, traders can make more informed decisions in the financial markets.
However, no indicator is perfect. The MACD should be used alongside sound risk management practices and other technical analysis tools for the best results. Whether you are a beginner or an experienced trader, mastering the MACD can significantly improve your understanding of market behavior and enhance your trading strategy.
메타데이터
- post_id
- 694bae058dee
- slug
- macd-indicator-a-beginners-guide-to-understanding-market-trends-and-momentum-694bae058dee
- url
- https://medium.com/@karimqc9/macd-indicator-a-beginners-guide-to-understanding-market-trends-and-momentum-694bae058dee
- canonical_url
- https://medium.com/@karimqc9/macd-indicator-a-beginners-guide-to-understanding-market-trends-and-momentum-694bae058dee
- author_url
- https://medium.com/@karimqc9
- status
- ok
- fetched_at
- 2026-06-09 15:37:30



